| Tissue | Expression Dynamics | Abbreviation |
| Cervix | 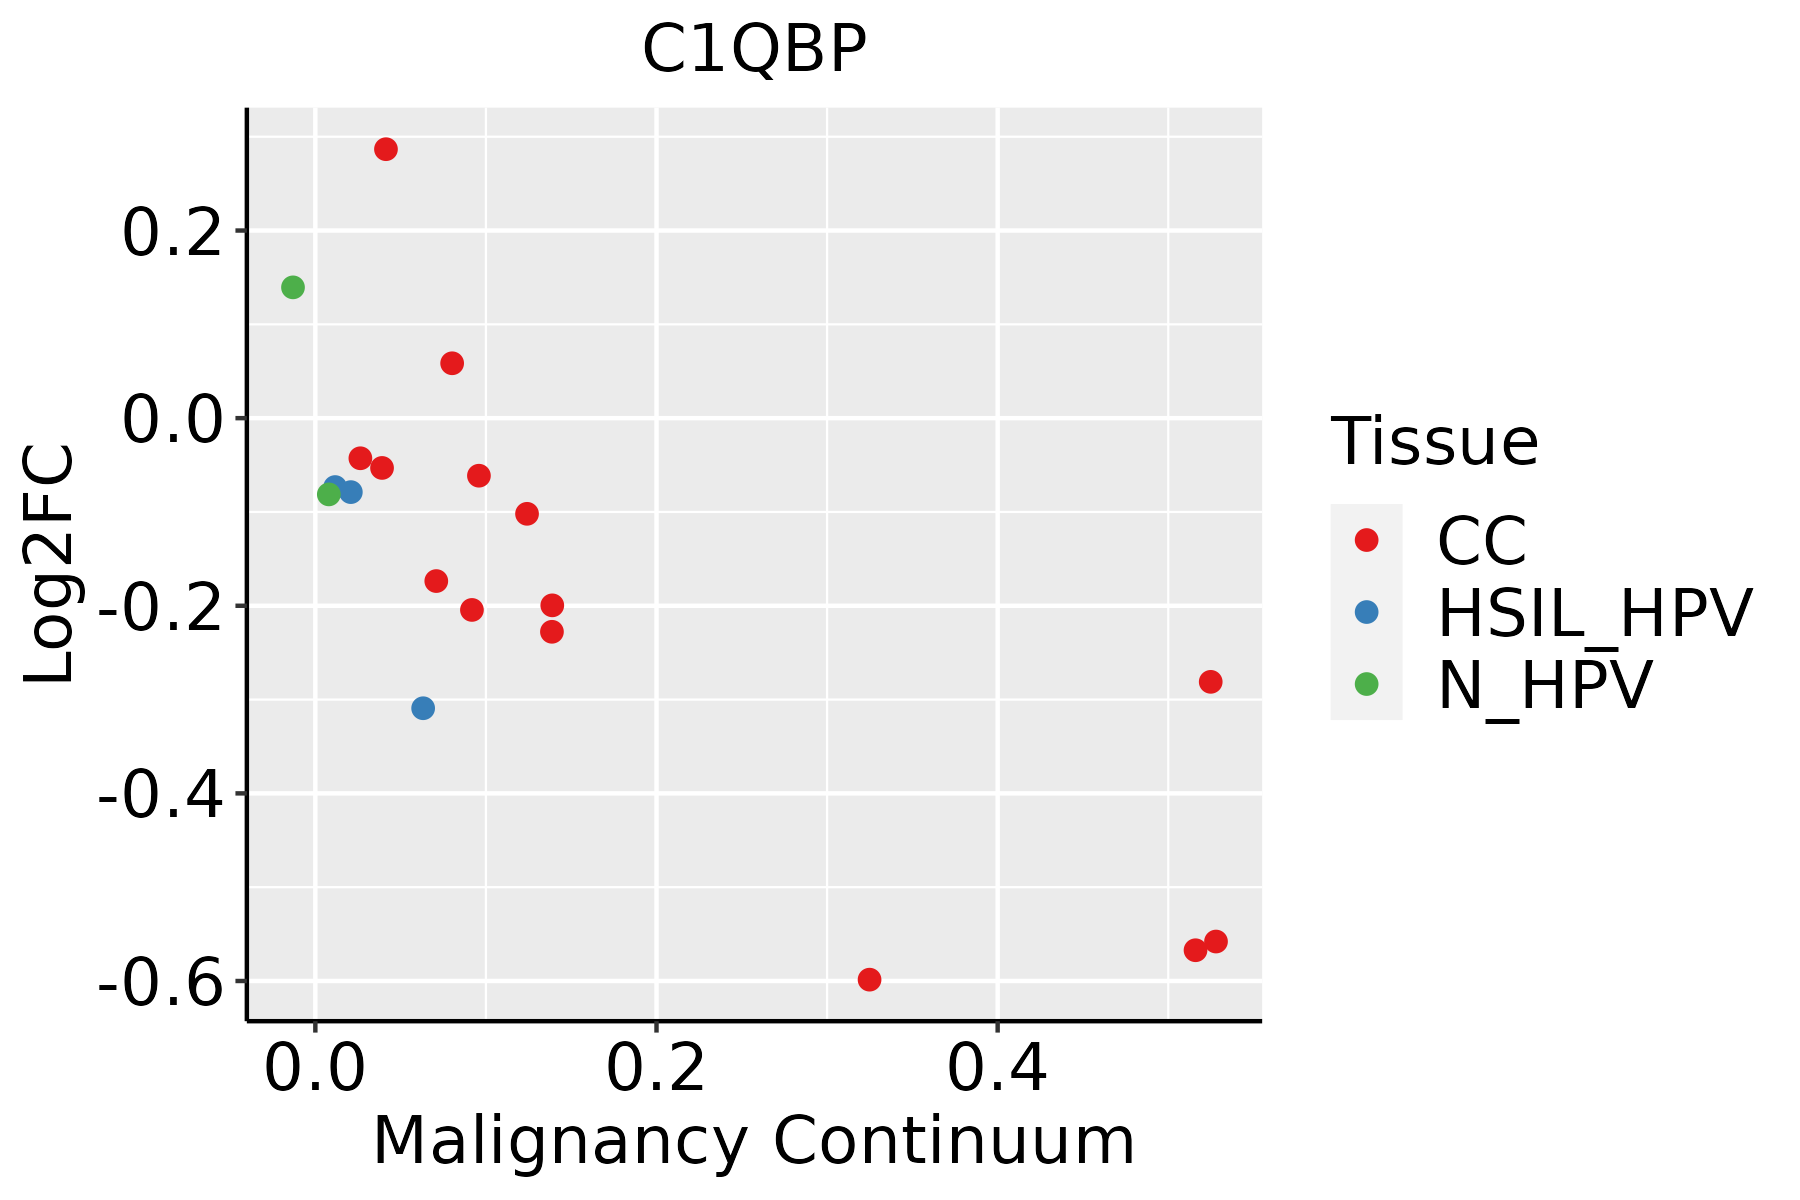 | CC: Cervix cancer |
| HSIL_HPV: HPV-infected high-grade squamous intraepithelial lesions |
| N_HPV: HPV-infected normal cervix |
| Colorectum (GSE201348) |  | FAP: Familial adenomatous polyposis |
| CRC: Colorectal cancer |
| Colorectum (HTA11) |  | AD: Adenomas |
| SER: Sessile serrated lesions |
| MSI-H: Microsatellite-high colorectal cancer |
| MSS: Microsatellite stable colorectal cancer |
| Endometrium |  | AEH: Atypical endometrial hyperplasia |
| EEC: Endometrioid Cancer |
| Esophagus | 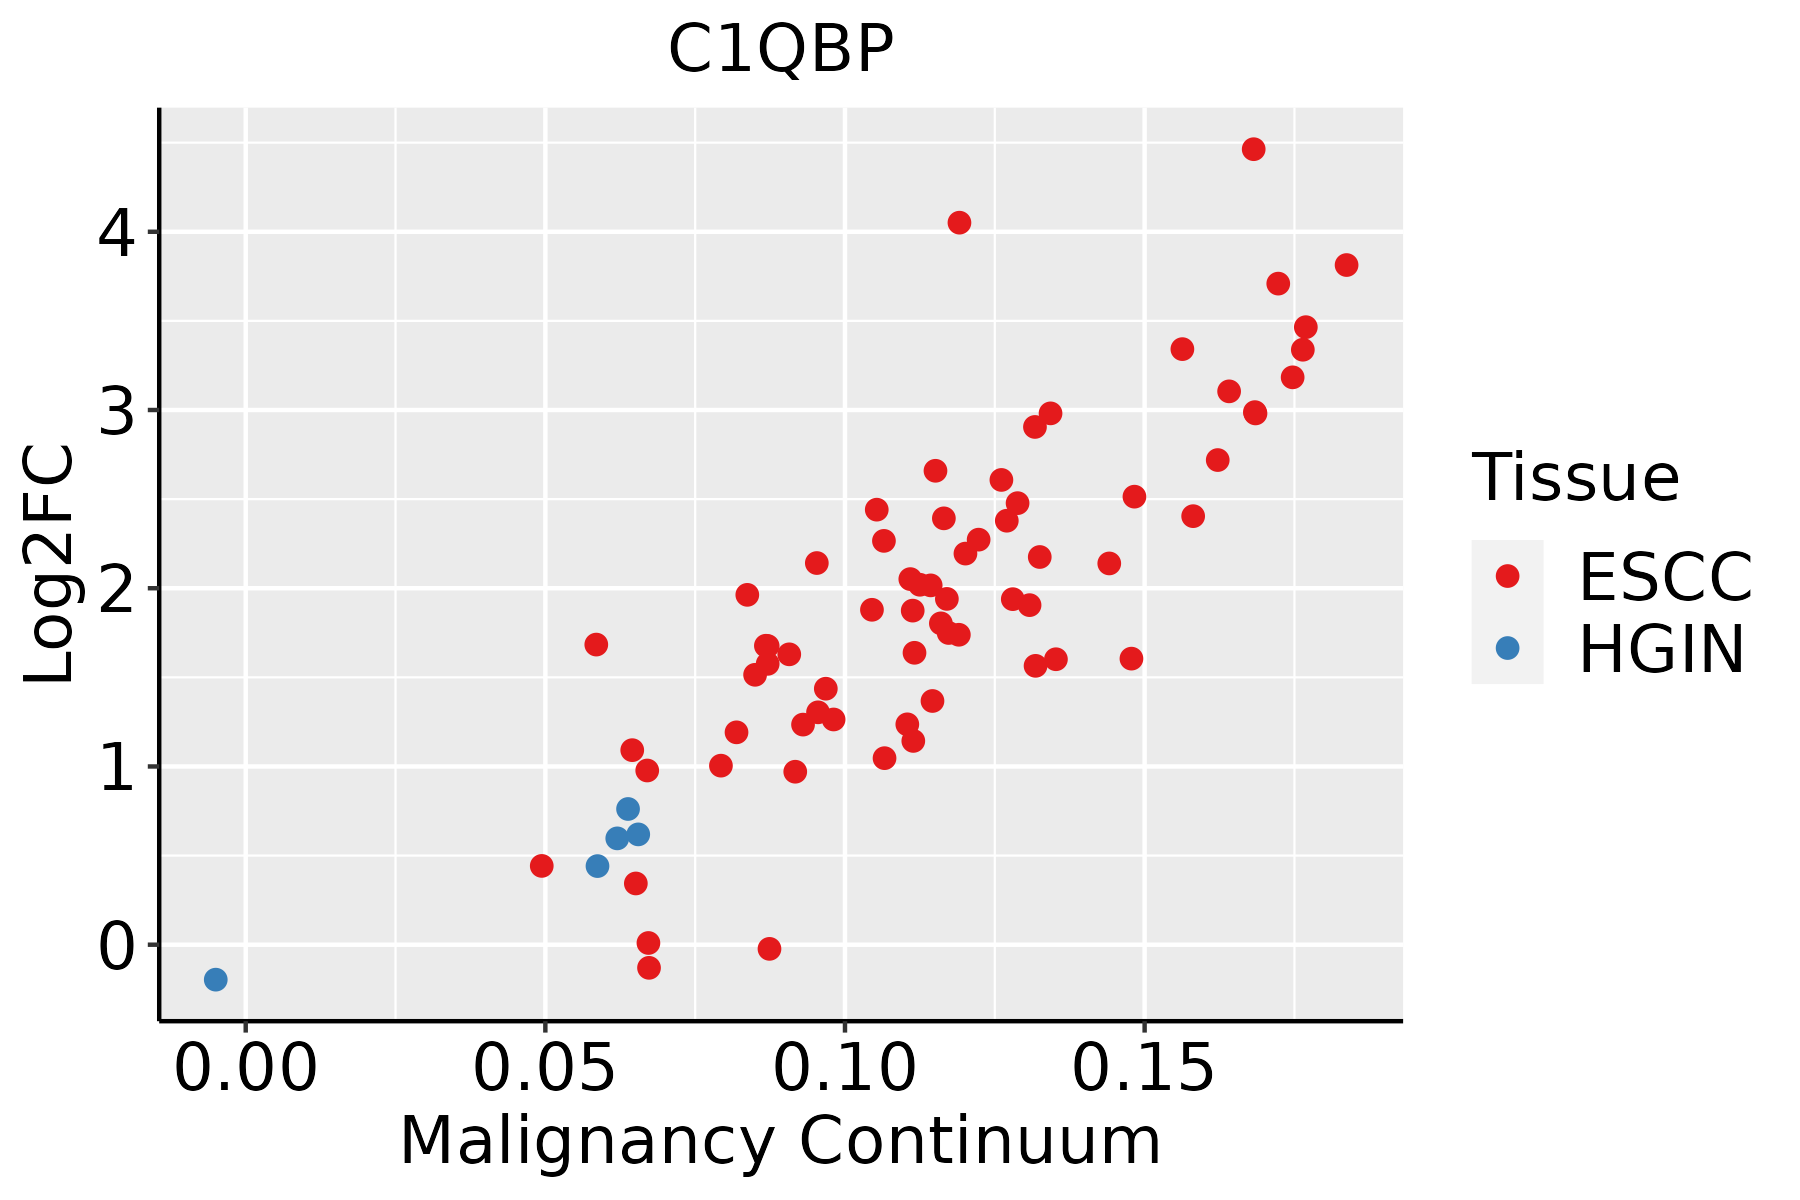 | ESCC: Esophageal squamous cell carcinoma |
| HGIN: High-grade intraepithelial neoplasias |
| LGIN: Low-grade intraepithelial neoplasias |
| GC | 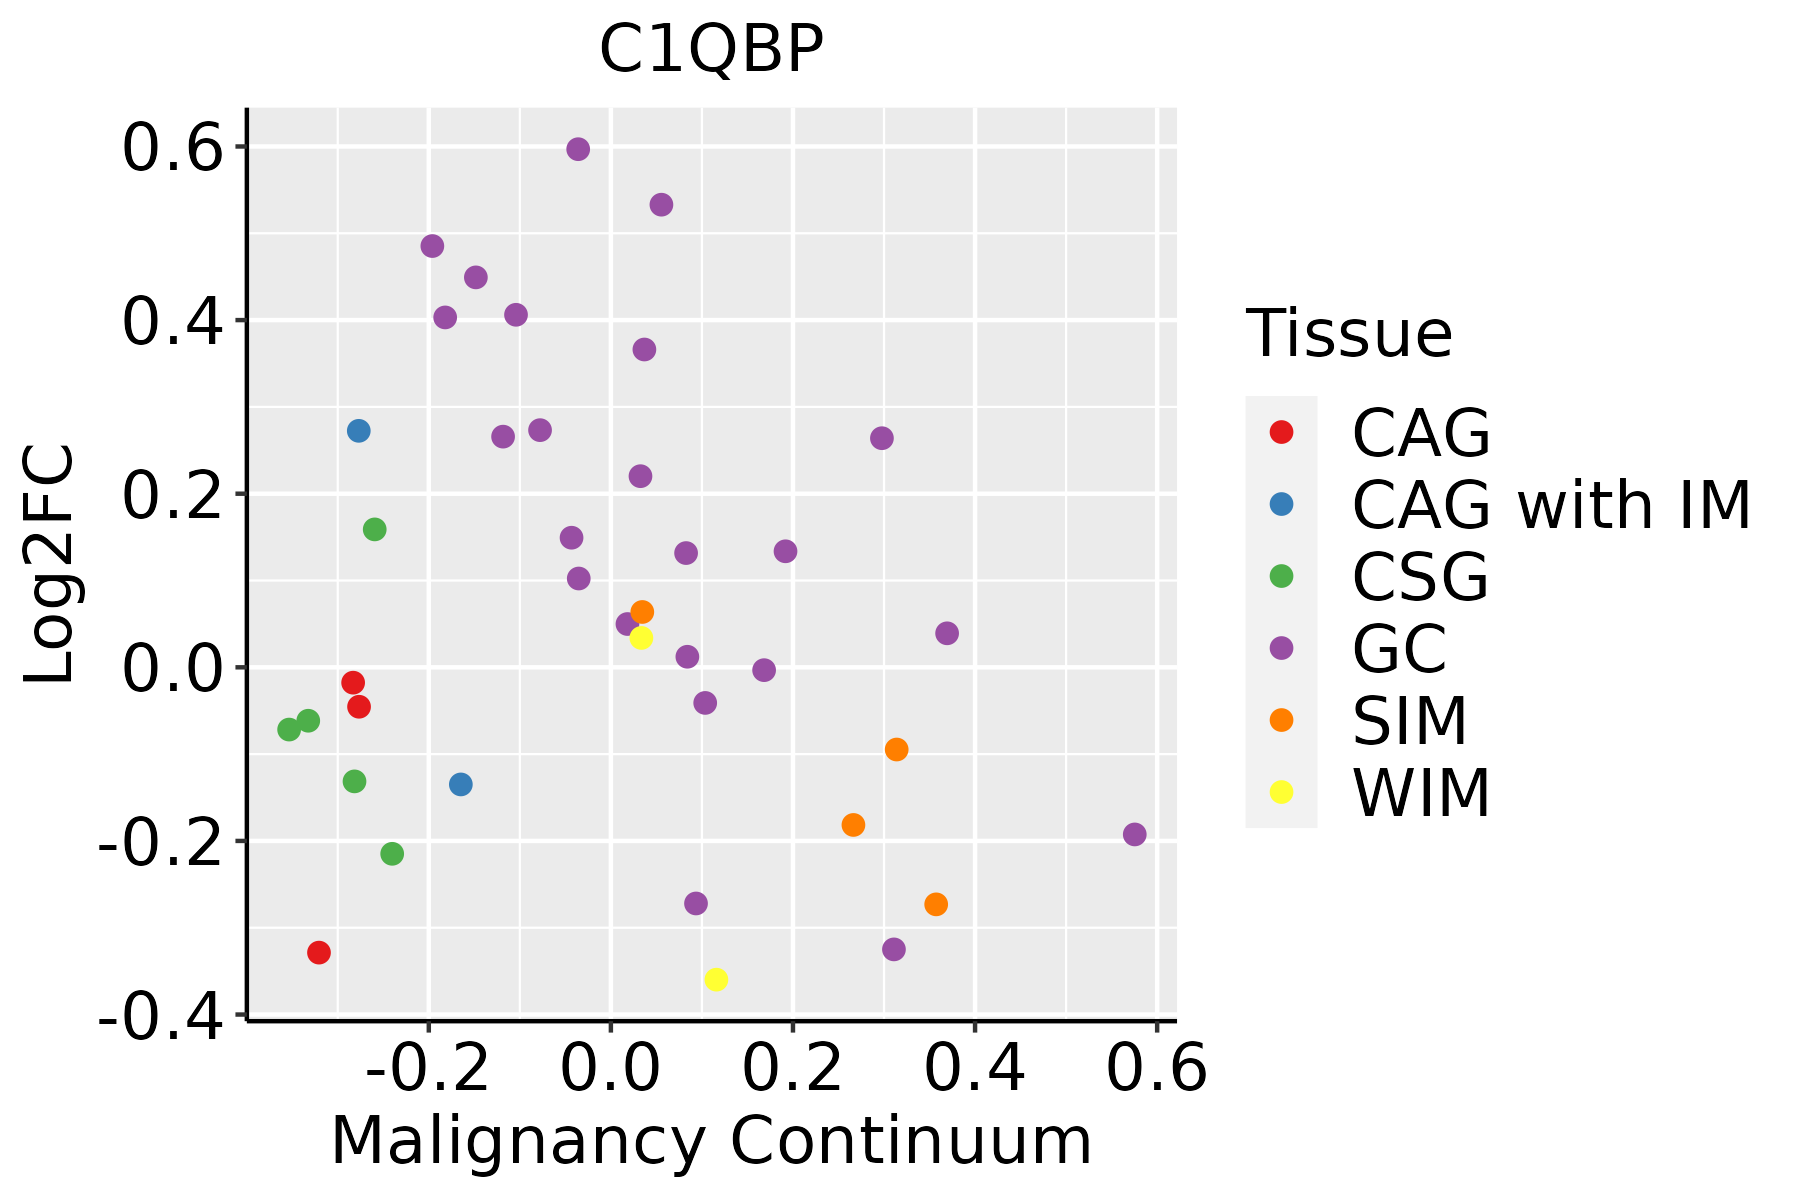 | CAG: Chronic atrophic gastritis |
| CAG with IM: Chronic atrophic gastritis with intestinal metaplasia |
| CSG: Chronic superficial gastritis |
| GC: Gastric cancer |
| SIM: Severe intestinal metaplasia |
| WIM: Wild intestinal metaplasia |
| Liver | 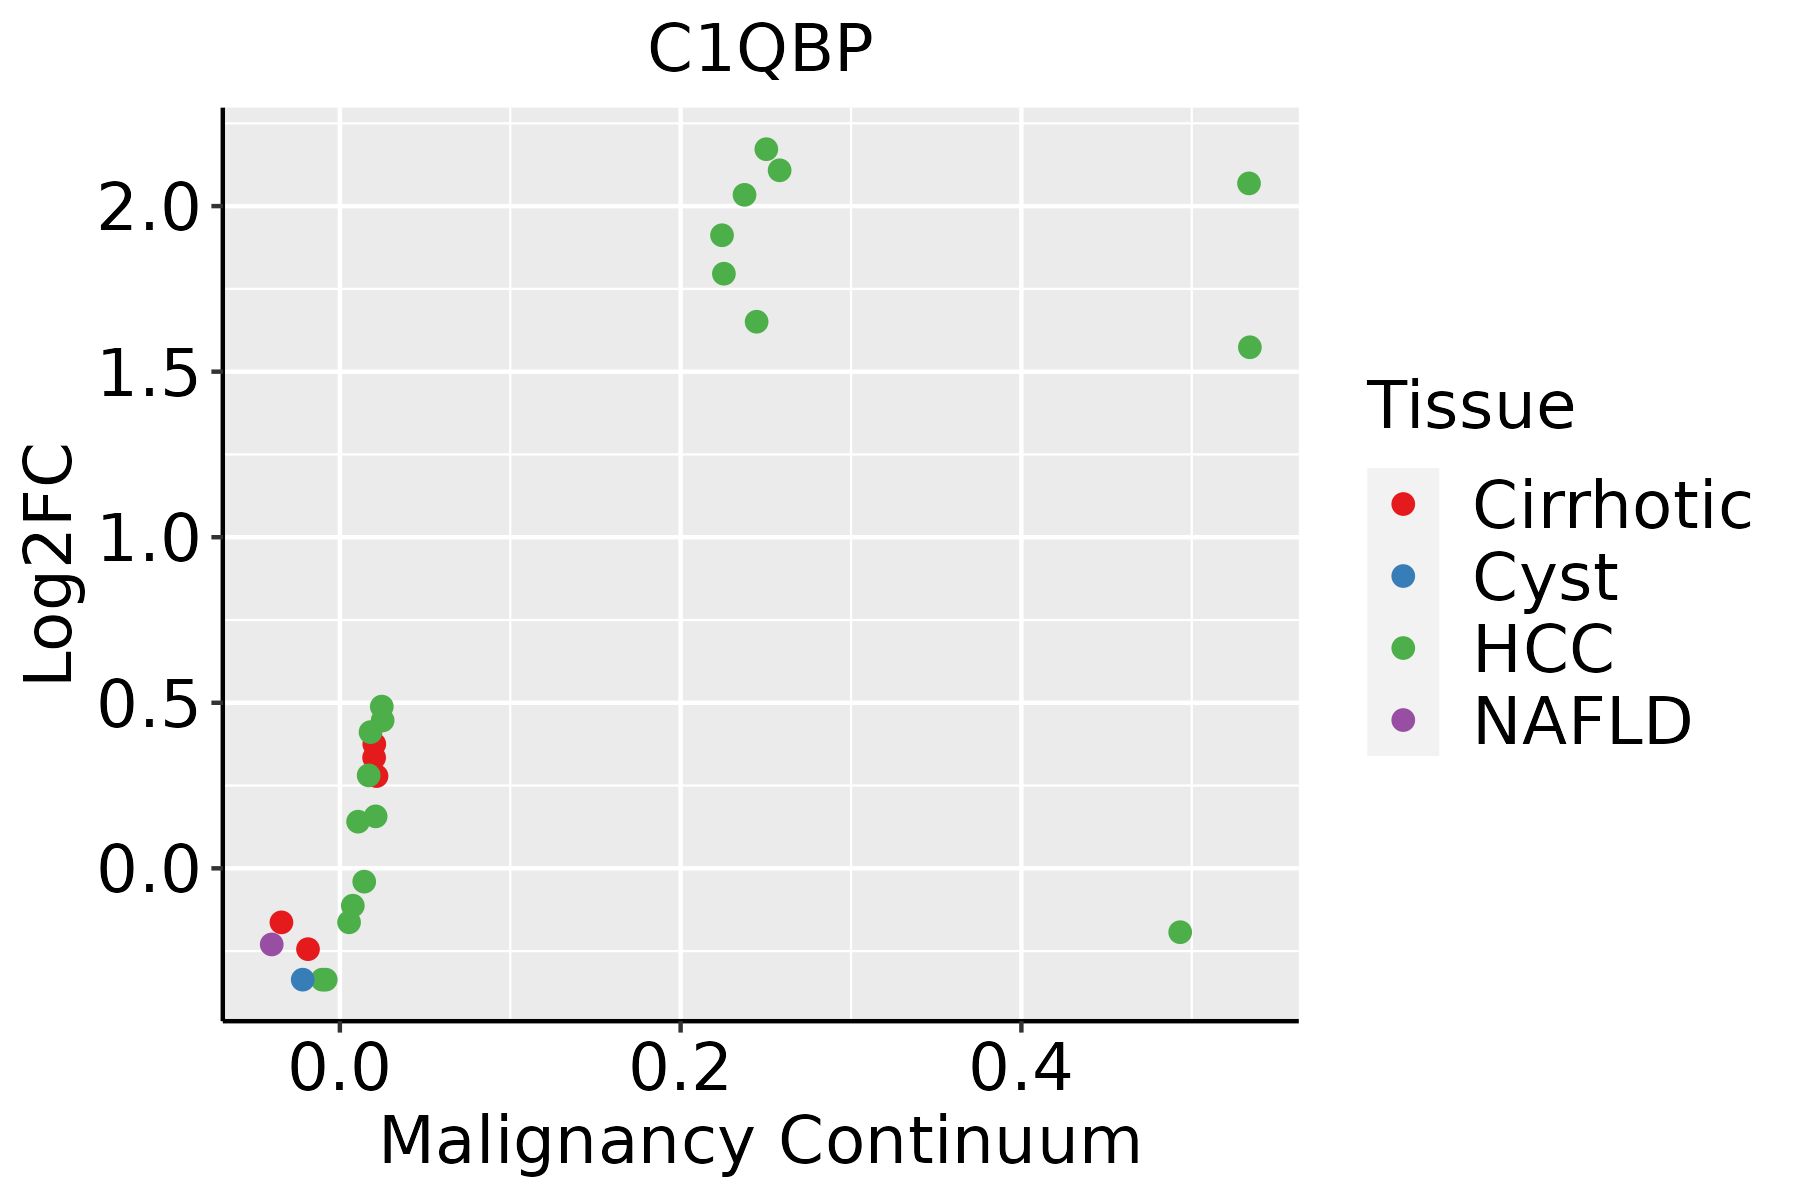 | HCC: Hepatocellular carcinoma |
| NAFLD: Non-alcoholic fatty liver disease |
| Oral Cavity |  | EOLP: Erosive Oral lichen planus |
| LP: leukoplakia |
| NEOLP: Non-erosive oral lichen planus |
| OSCC: Oral squamous cell carcinoma |
| Prostate |  | BPH: Benign Prostatic Hyperplasia |
| Skin | 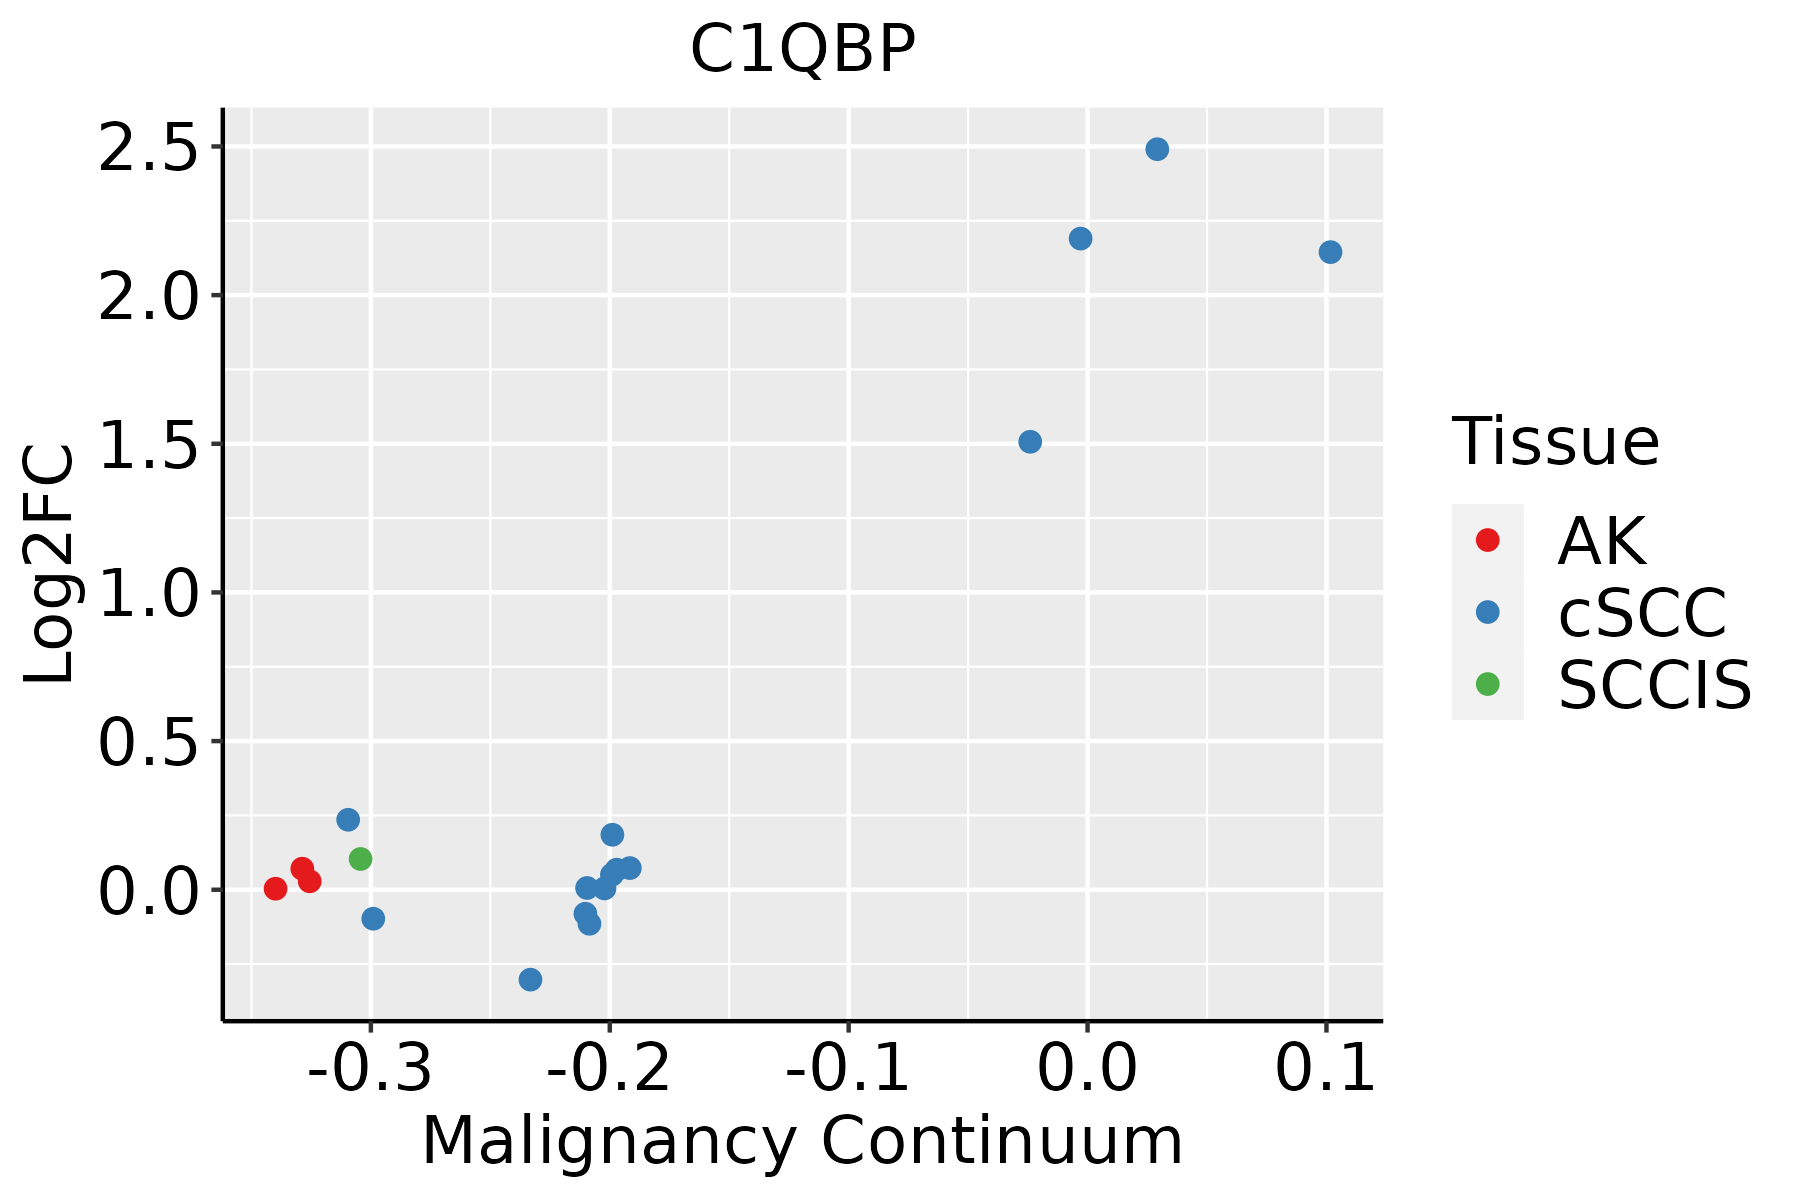 | AK: Actinic keratosis |
| cSCC: Cutaneous squamous cell carcinoma |
| SCCIS:squamous cell carcinoma in situ |
| Thyroid | 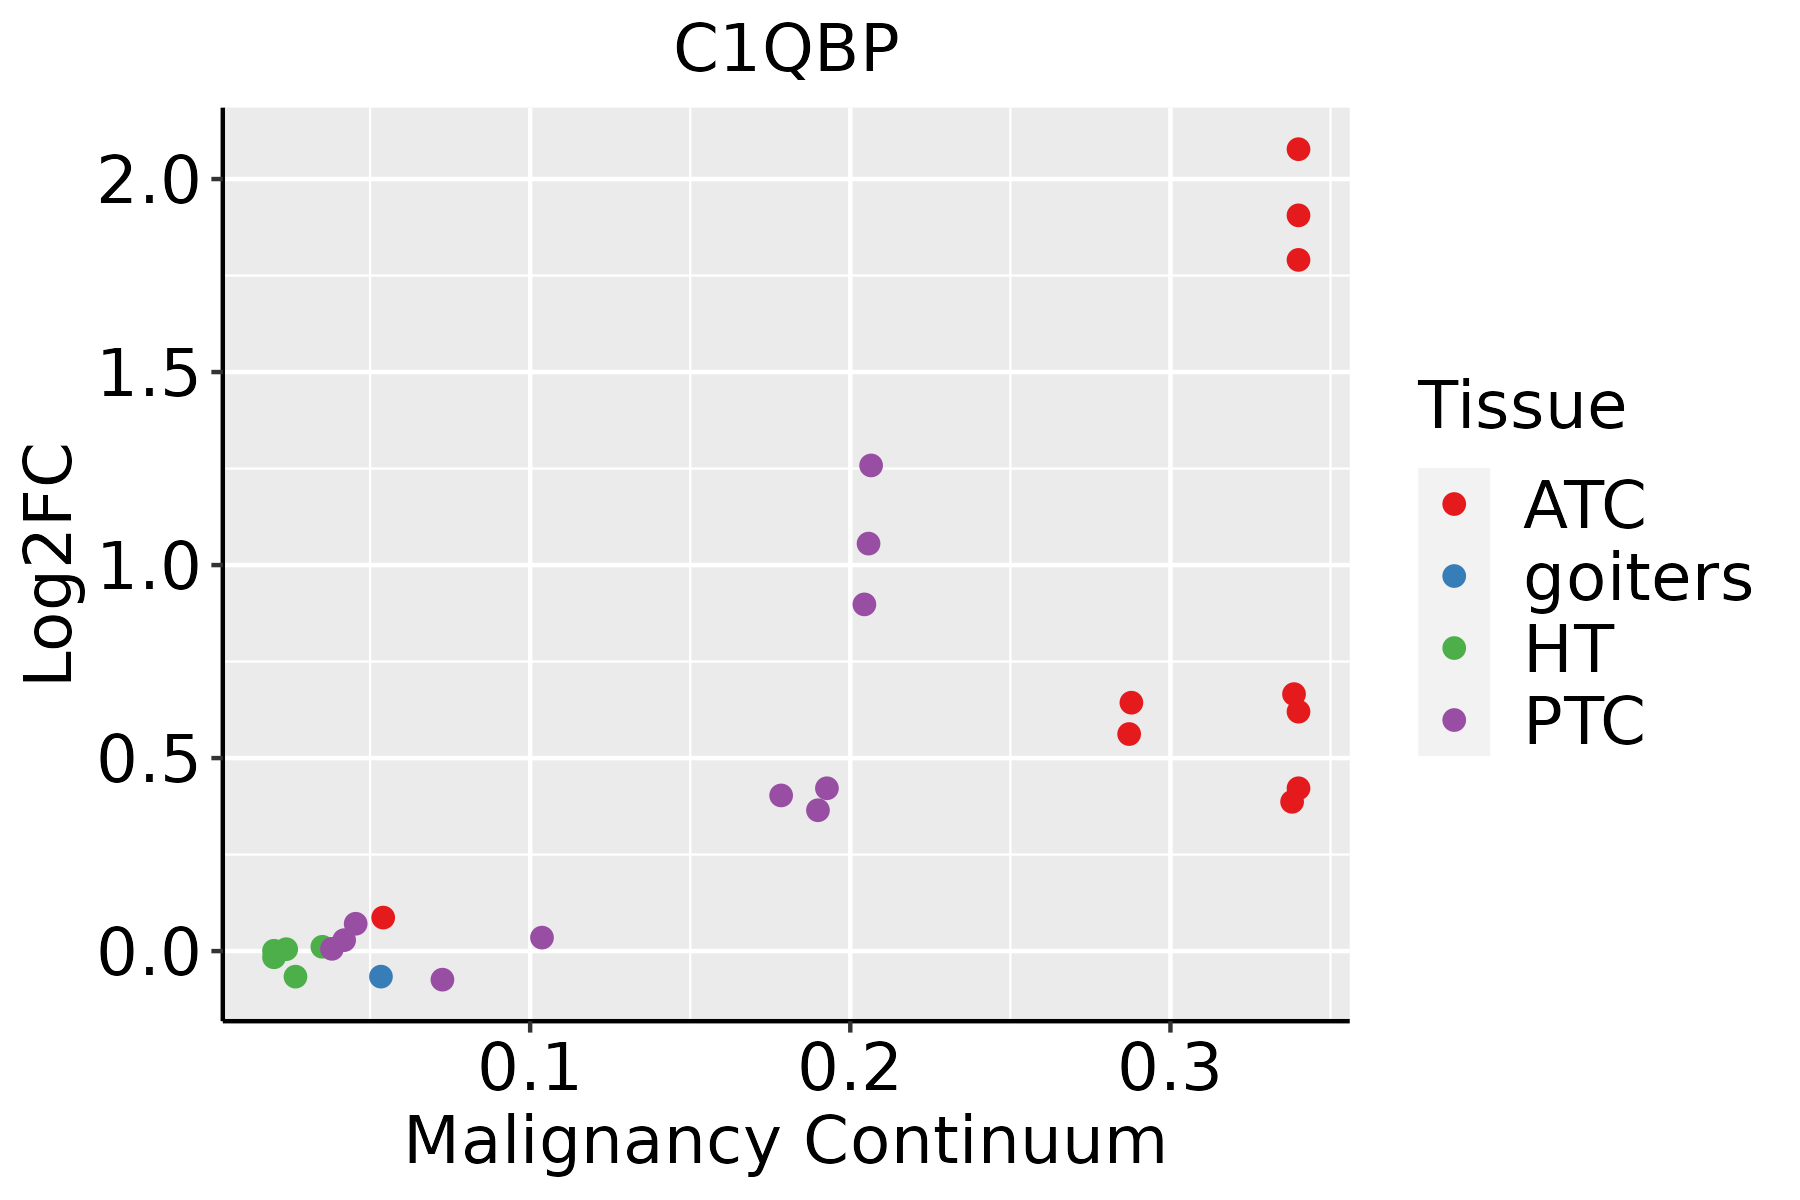 | ATC: Anaplastic thyroid cancer |
| HT: Hashimoto's thyroiditis |
| PTC: Papillary thyroid cancer |
| GO ID | Tissue | Disease Stage | Description | Gene Ratio | Bg Ratio | pvalue | p.adjust | Count |
| GO:001081010 | Cervix | CC | regulation of cell-substrate adhesion | 69/2311 | 221/18723 | 8.57e-14 | 5.69e-11 | 69 |
| GO:00315898 | Cervix | CC | cell-substrate adhesion | 96/2311 | 363/18723 | 1.48e-13 | 8.85e-11 | 96 |
| GO:002260410 | Cervix | CC | regulation of cell morphogenesis | 84/2311 | 309/18723 | 1.00e-12 | 4.29e-10 | 84 |
| GO:00016679 | Cervix | CC | ameboidal-type cell migration | 110/2311 | 475/18723 | 2.66e-11 | 6.36e-09 | 110 |
| GO:004578510 | Cervix | CC | positive regulation of cell adhesion | 101/2311 | 437/18723 | 1.96e-10 | 3.08e-08 | 101 |
| GO:00321035 | Cervix | CC | positive regulation of response to external stimulus | 95/2311 | 427/18723 | 5.44e-09 | 5.03e-07 | 95 |
| GO:004225510 | Cervix | CC | ribosome assembly | 25/2311 | 61/18723 | 1.70e-08 | 1.27e-06 | 25 |
| GO:00026837 | Cervix | CC | negative regulation of immune system process | 94/2311 | 434/18723 | 2.63e-08 | 1.87e-06 | 94 |
| GO:00603267 | Cervix | CC | cell chemotaxis | 73/2311 | 310/18723 | 2.82e-08 | 1.96e-06 | 73 |
| GO:00975298 | Cervix | CC | myeloid leukocyte migration | 56/2311 | 220/18723 | 7.21e-08 | 4.15e-06 | 56 |
| GO:19000249 | Cervix | CC | regulation of substrate adhesion-dependent cell spreading | 23/2311 | 57/18723 | 8.94e-08 | 5.04e-06 | 23 |
| GO:004348410 | Cervix | CC | regulation of RNA splicing | 42/2311 | 148/18723 | 1.25e-07 | 6.24e-06 | 42 |
| GO:00305957 | Cervix | CC | leukocyte chemotaxis | 57/2311 | 230/18723 | 1.48e-07 | 7.07e-06 | 57 |
| GO:00027644 | Cervix | CC | immune response-regulating signaling pathway | 97/2311 | 468/18723 | 1.49e-07 | 7.07e-06 | 97 |
| GO:00716218 | Cervix | CC | granulocyte chemotaxis | 37/2311 | 125/18723 | 2.16e-07 | 9.56e-06 | 37 |
| GO:00107699 | Cervix | CC | regulation of cell morphogenesis involved in differentiation | 31/2311 | 96/18723 | 2.43e-07 | 1.05e-05 | 31 |
| GO:00509007 | Cervix | CC | leukocyte migration | 78/2311 | 369/18723 | 1.09e-06 | 3.80e-05 | 78 |
| GO:00344469 | Cervix | CC | substrate adhesion-dependent cell spreading | 32/2311 | 108/18723 | 1.36e-06 | 4.55e-05 | 32 |
| GO:19033119 | Cervix | CC | regulation of mRNA metabolic process | 64/2311 | 288/18723 | 1.71e-06 | 5.64e-05 | 64 |
| GO:003311910 | Cervix | CC | negative regulation of RNA splicing | 13/2311 | 25/18723 | 1.83e-06 | 5.89e-05 | 13 |
| Hugo Symbol | Variant Class | Variant Classification | dbSNP RS | HGVSc | HGVSp | HGVSp Short | SWISSPROT | BIOTYPE | SIFT | PolyPhen | Tumor Sample Barcode | Tissue | Histology | Sex | Age | Stage | Therapy Types | Drugs | Outcome |
| C1QBP | SNV | Missense_Mutation | novel | c.529N>C | p.Asp177His | p.D177H | Q07021 | protein_coding | tolerated(0.13) | possibly_damaging(0.807) | TCGA-HM-A4S6-01 | Cervix | cervical & endocervical cancer | Female | <65 | III/IV | Chemotherapy | cisplatin | CR |
| C1QBP | SNV | Missense_Mutation | | c.352N>A | p.Ala118Thr | p.A118T | Q07021 | protein_coding | deleterious(0.04) | possibly_damaging(0.601) | TCGA-QG-A5Z2-01 | Colorectum | colon adenocarcinoma | Male | <65 | I/II | Unknown | Unknown | SD |
| C1QBP | SNV | Missense_Mutation | novel | c.304N>A | p.Leu102Ile | p.L102I | Q07021 | protein_coding | tolerated(0.22) | possibly_damaging(0.562) | TCGA-A5-A0G2-01 | Endometrium | uterine corpus endometrioid carcinoma | Female | <65 | III/IV | Unknown | Unknown | SD |
| C1QBP | SNV | Missense_Mutation | novel | c.814N>A | p.Leu272Ile | p.L272I | Q07021 | protein_coding | deleterious(0) | probably_damaging(0.999) | TCGA-A5-A2K5-01 | Endometrium | uterine corpus endometrioid carcinoma | Female | >=65 | I/II | Unknown | Unknown | SD |
| C1QBP | SNV | Missense_Mutation | | c.245N>C | p.Phe82Ser | p.F82S | Q07021 | protein_coding | deleterious(0) | possibly_damaging(0.764) | TCGA-AP-A059-01 | Endometrium | uterine corpus endometrioid carcinoma | Female | >=65 | I/II | Unknown | Unknown | SD |
| C1QBP | SNV | Missense_Mutation | rs115819590 | c.643N>A | p.Gly215Ser | p.G215S | Q07021 | protein_coding | tolerated_low_confidence(0.09) | benign(0.107) | TCGA-AP-A1DK-01 | Endometrium | uterine corpus endometrioid carcinoma | Female | <65 | I/II | Unknown | Unknown | SD |
| C1QBP | SNV | Missense_Mutation | novel | c.751A>G | p.Thr251Ala | p.T251A | Q07021 | protein_coding | tolerated(0.1) | possibly_damaging(0.559) | TCGA-D1-A175-01 | Endometrium | uterine corpus endometrioid carcinoma | Female | <65 | I/II | Chemotherapy | paclitaxel | SD |
| C1QBP | SNV | Missense_Mutation | novel | c.677N>C | p.Leu226Pro | p.L226P | Q07021 | protein_coding | deleterious(0) | probably_damaging(0.988) | TCGA-E6-A1LX-01 | Endometrium | uterine corpus endometrioid carcinoma | Female | <65 | I/II | Unknown | Unknown | SD |
| C1QBP | SNV | Missense_Mutation | novel | c.296N>G | p.His99Arg | p.H99R | Q07021 | protein_coding | tolerated(0.38) | benign(0.055) | TCGA-FI-A2D5-01 | Endometrium | uterine corpus endometrioid carcinoma | Female | <65 | III/IV | Chemotherapy | carboplatinum | PD |
| C1QBP | SNV | Missense_Mutation | | c.481N>A | p.Glu161Lys | p.E161K | Q07021 | protein_coding | deleterious(0.02) | possibly_damaging(0.684) | TCGA-18-5595-01 | Lung | lung squamous cell carcinoma | Male | <65 | I/II | Unknown | Unknown | SD |


