
|
|||||
|
 | |
| |
| |
| |
| |
| |
|
Gene: C1QB |
Gene summary for C1QB |
| Gene information | Species | Human | Gene symbol | C1QB | Gene ID | 713 |
| Gene name | complement C1q B chain | |
| Gene Alias | C1QB | |
| Cytomap | 1p36.12 | |
| Gene Type | protein-coding | GO ID | GO:0002250 | UniProtAcc | A0A024RAB9 |
Top |
Malignant transformation analysis |
| Identification of the aberrant gene expression in precancerous and cancerous lesions by comparing the gene expression of stem-like cells in diseased tissues with normal stem cells |
| Entrez ID | Symbol | Replicates | Species | Organ | Tissue | Adj P-value | Log2FC | Malignancy |
| 713 | C1QB | NCCBC11 | Human | Breast | DCIS | 8.68e-09 | 8.69e-01 | 0.1232 |
| 713 | C1QB | NCCBC14 | Human | Breast | DCIS | 5.13e-06 | 4.39e-01 | 0.2021 |
| 713 | C1QB | NCCBC3 | Human | Breast | DCIS | 1.95e-73 | 1.32e+00 | 0.1198 |
| 713 | C1QB | NCCBC5 | Human | Breast | DCIS | 3.14e-14 | 7.11e-01 | 0.2046 |
| 713 | C1QB | P2 | Human | Breast | IDC | 7.99e-03 | 2.92e-01 | 0.21 |
| 713 | C1QB | P16T-E | Human | Esophagus | ESCC | 1.64e-124 | 2.62e+00 | 0.1153 |
| 713 | C1QB | P20T-E | Human | Esophagus | ESCC | 2.85e-94 | 2.25e+00 | 0.1124 |
| 713 | C1QB | P21T-E | Human | Esophagus | ESCC | 1.81e-130 | 3.33e+00 | 0.1617 |
| 713 | C1QB | P23T-E | Human | Esophagus | ESCC | 2.93e-93 | 2.67e+00 | 0.108 |
| 713 | C1QB | P36T-E | Human | Esophagus | ESCC | 1.35e-02 | 9.16e-02 | 0.1187 |
| 713 | C1QB | P39T-E | Human | Esophagus | ESCC | 5.69e-86 | 1.80e+00 | 0.0894 |
| 713 | C1QB | P42T-E | Human | Esophagus | ESCC | 3.82e-71 | 2.17e+00 | 0.1175 |
| 713 | C1QB | P48T-E | Human | Esophagus | ESCC | 2.55e-72 | 1.53e+00 | 0.0959 |
| 713 | C1QB | P49T-E | Human | Esophagus | ESCC | 5.54e-31 | 3.69e+00 | 0.1768 |
| 713 | C1QB | P52T-E | Human | Esophagus | ESCC | 4.71e-95 | 2.63e+00 | 0.1555 |
| 713 | C1QB | P54T-E | Human | Esophagus | ESCC | 2.00e-86 | 2.37e+00 | 0.0975 |
| 713 | C1QB | P56T-E | Human | Esophagus | ESCC | 2.56e-21 | 2.95e+00 | 0.1613 |
| 713 | C1QB | P89T-E | Human | Esophagus | ESCC | 2.99e-37 | 3.57e+00 | 0.1752 |
| 713 | C1QB | P104T-E | Human | Esophagus | ESCC | 1.37e-07 | 1.46e+00 | 0.0931 |
| 713 | C1QB | P107T-E | Human | Esophagus | ESCC | 5.28e-119 | 3.94e+00 | 0.171 |
| Page: 1 2 3 |
| Tissue | Expression Dynamics | Abbreviation |
| Breast |  | IDC: Invasive ductal carcinoma |
| DCIS: Ductal carcinoma in situ | ||
| Precancer(BRCA1-mut): Precancerous lesion from BRCA1 mutation carriers | ||
| Esophagus | 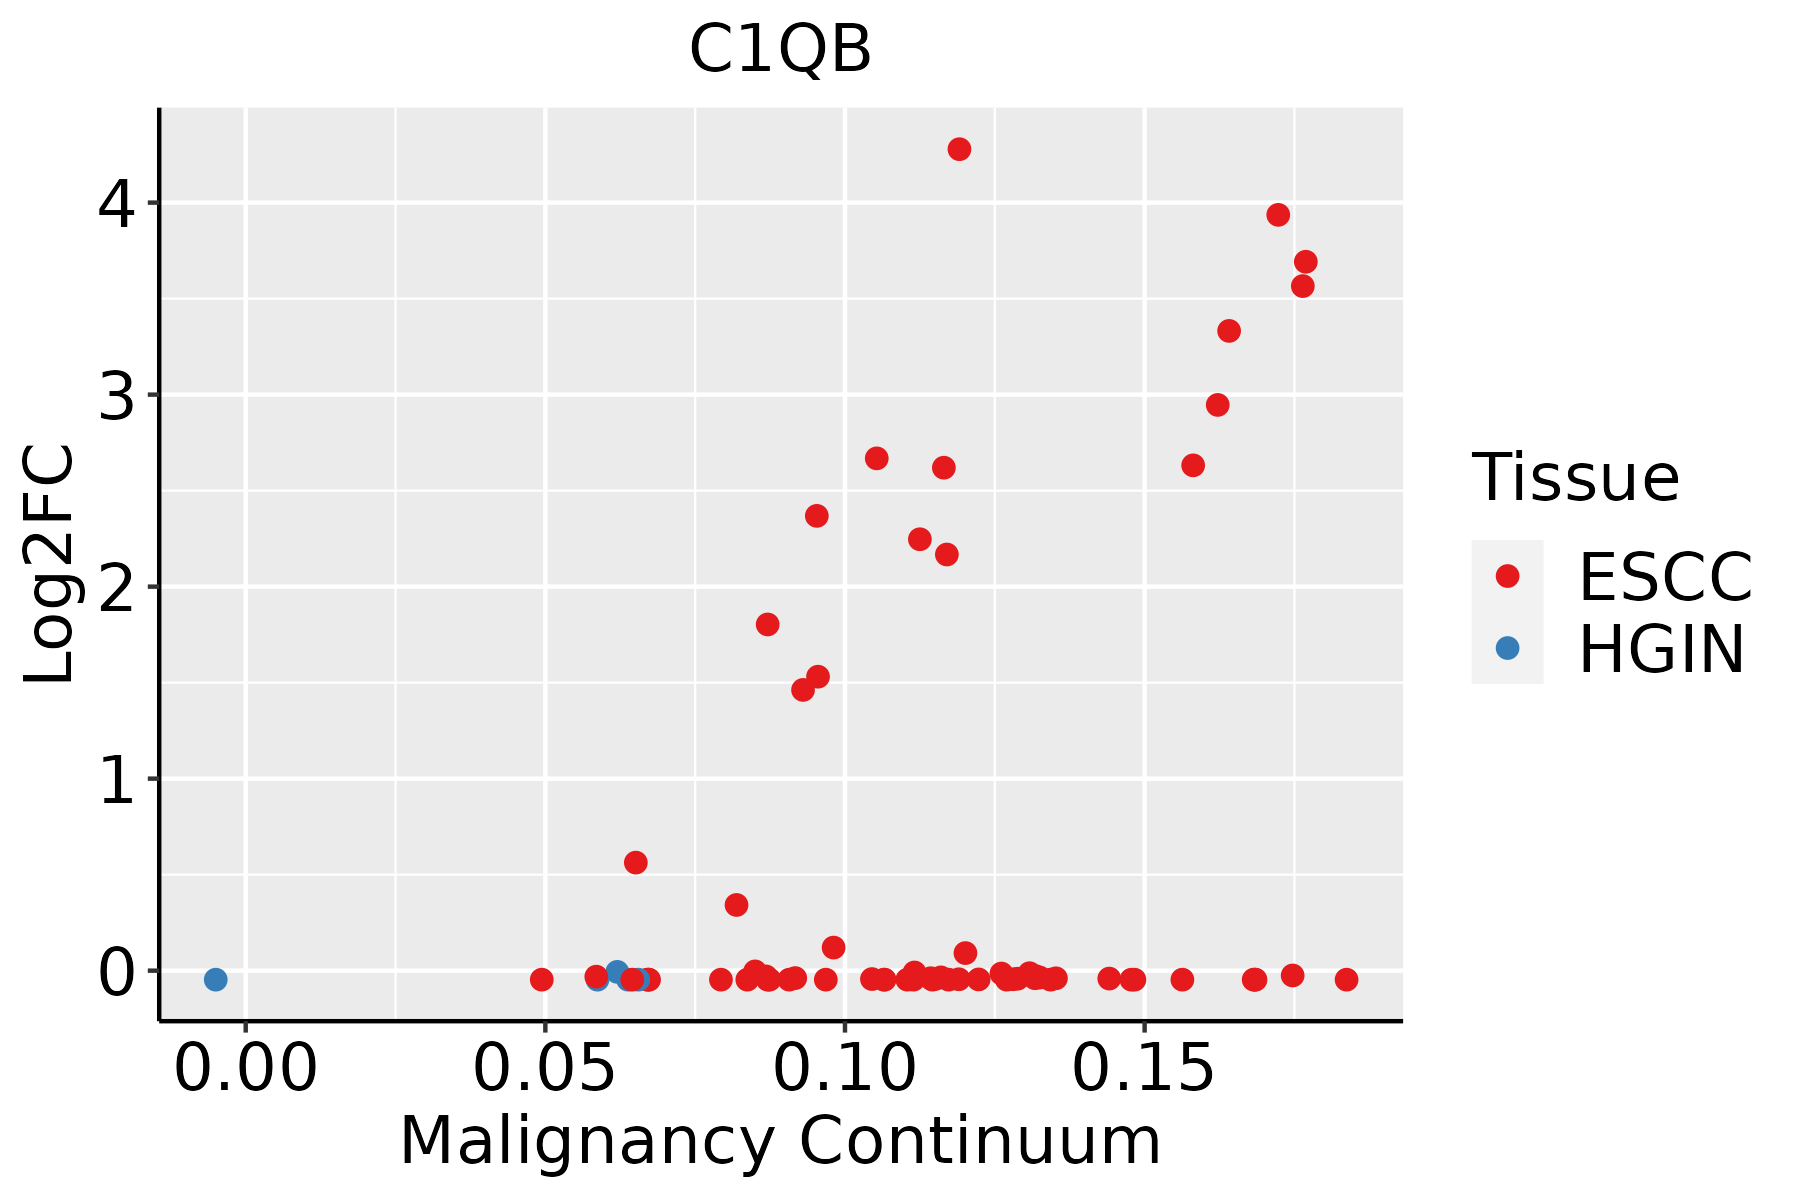 | ESCC: Esophageal squamous cell carcinoma |
| HGIN: High-grade intraepithelial neoplasias | ||
| LGIN: Low-grade intraepithelial neoplasias | ||
| Liver | 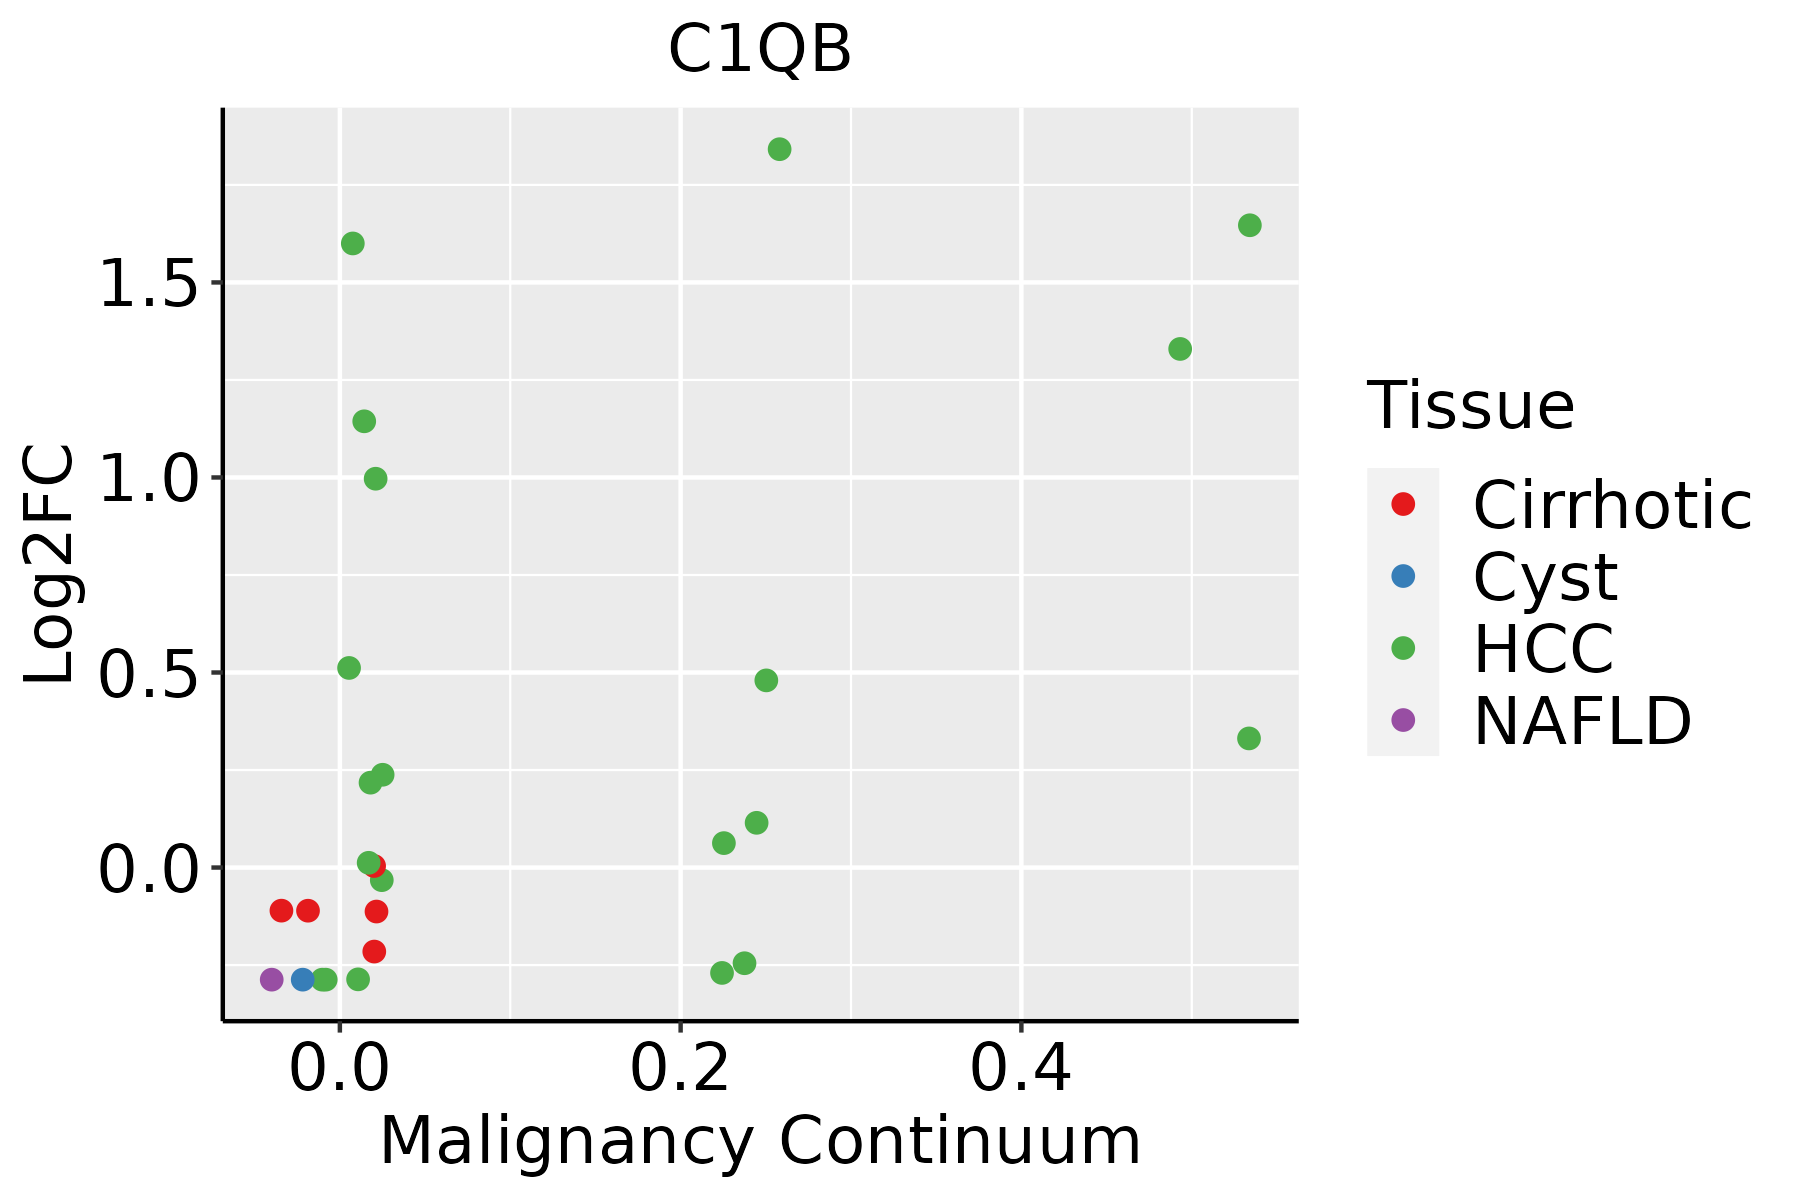 | HCC: Hepatocellular carcinoma |
| NAFLD: Non-alcoholic fatty liver disease | ||
| Oral Cavity | 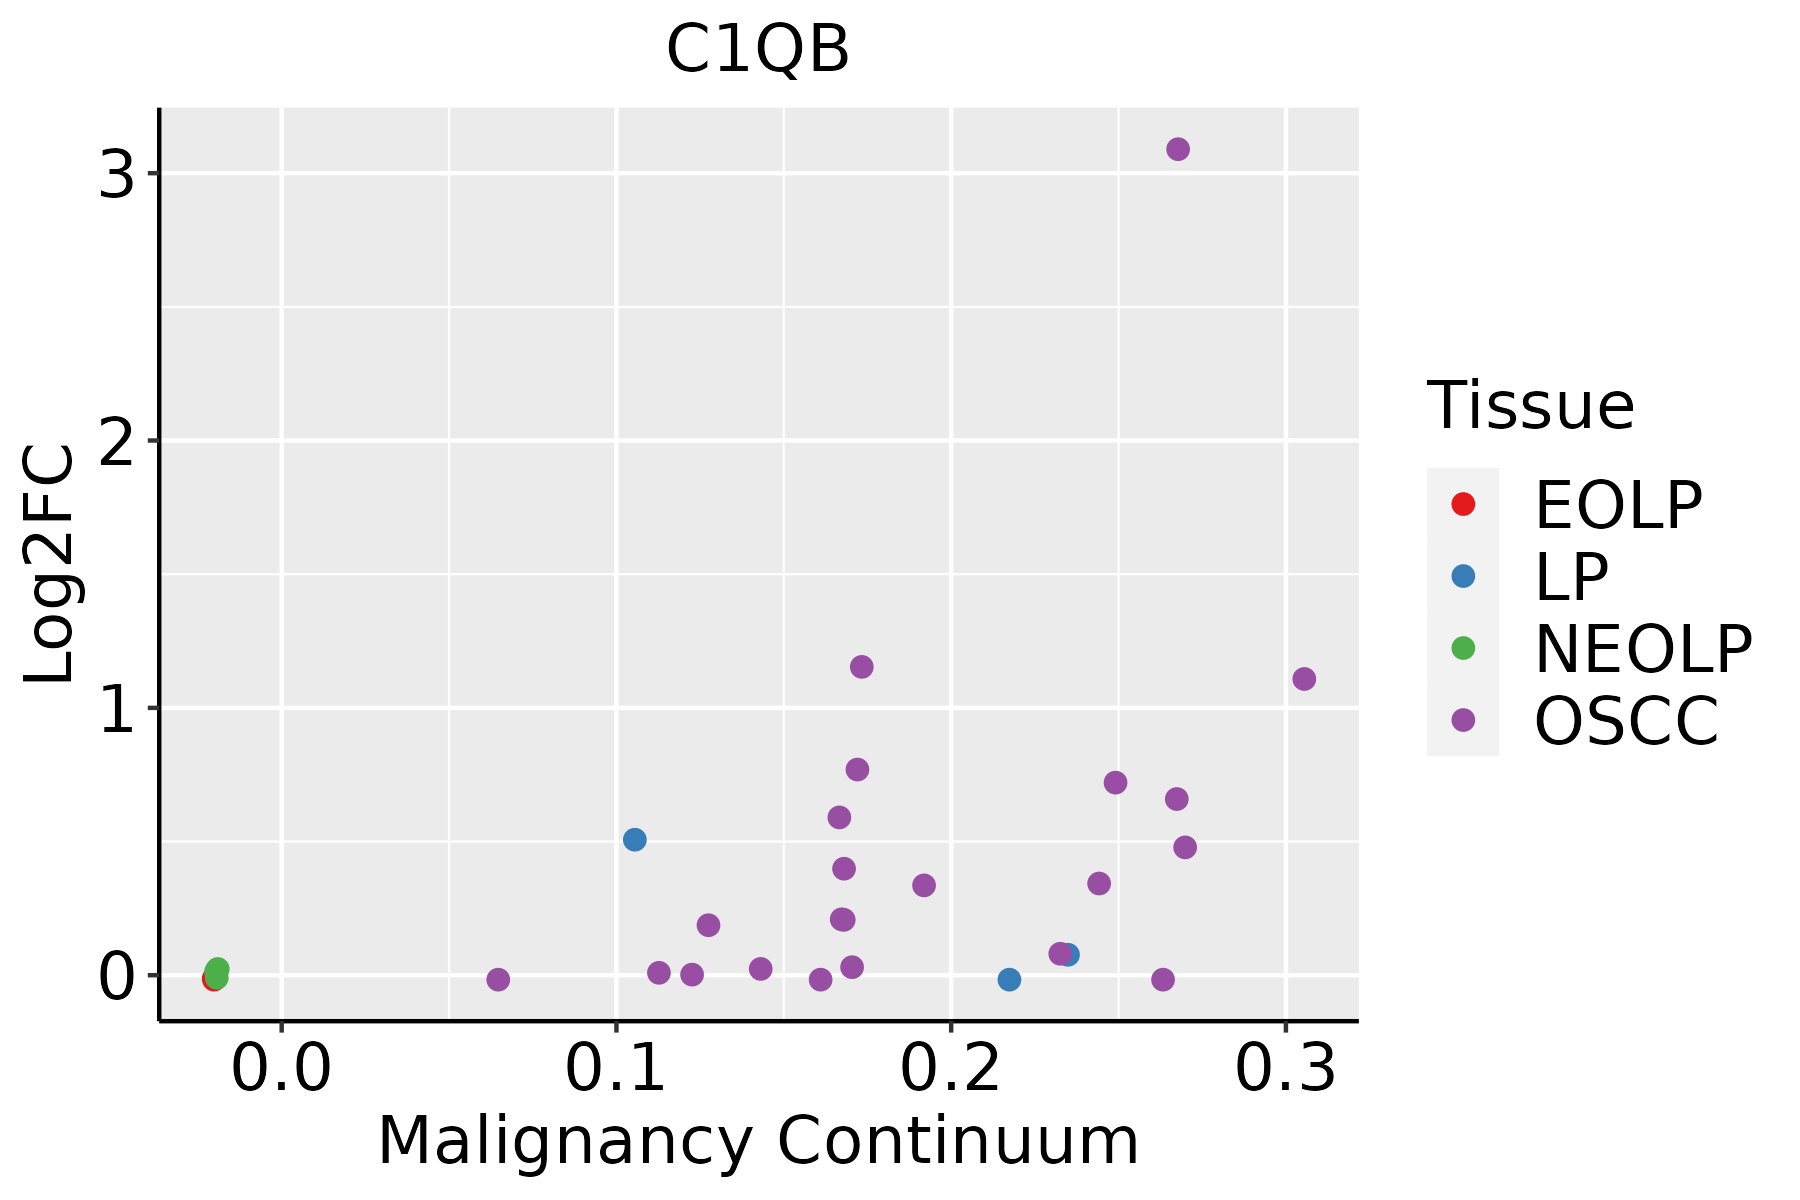 | EOLP: Erosive Oral lichen planus |
| LP: leukoplakia | ||
| NEOLP: Non-erosive oral lichen planus | ||
| OSCC: Oral squamous cell carcinoma | ||
| Skin | 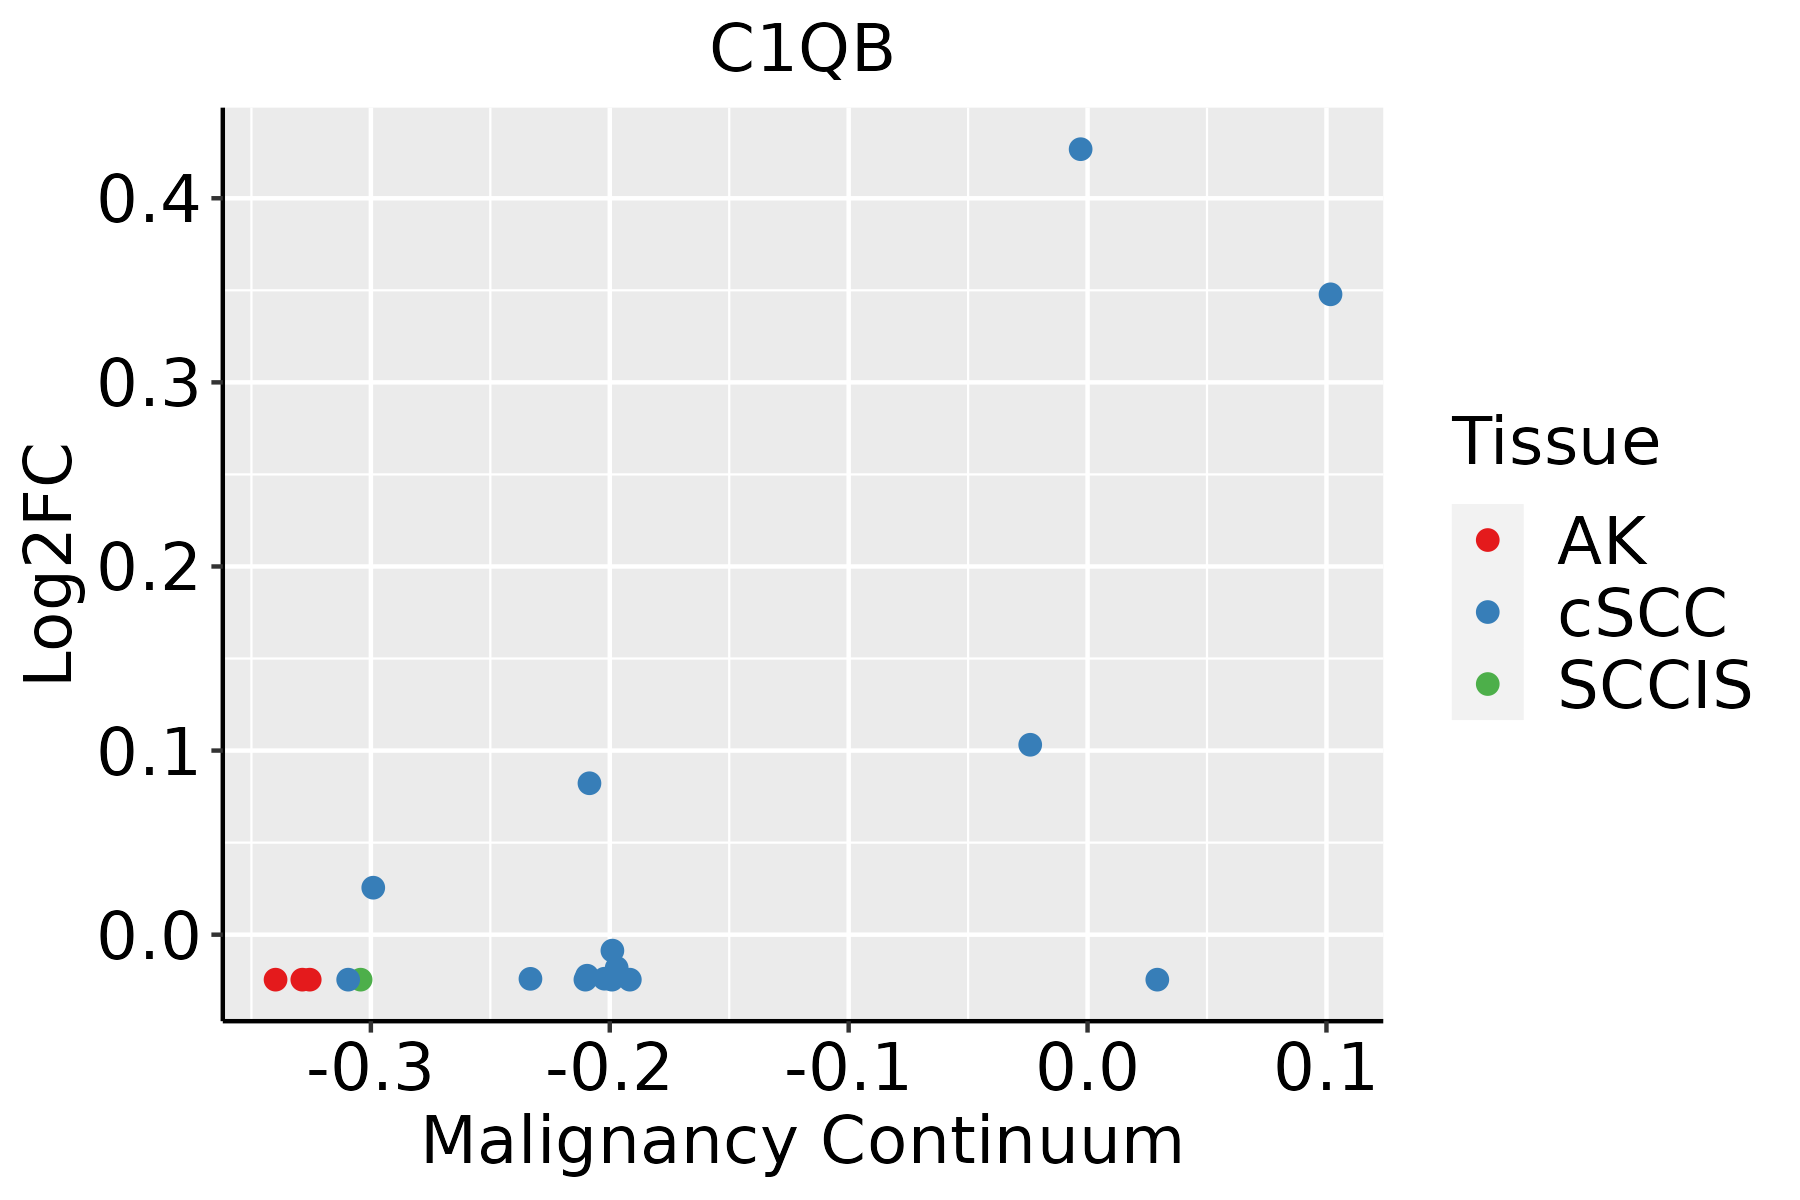 | AK: Actinic keratosis |
| cSCC: Cutaneous squamous cell carcinoma | ||
| SCCIS:squamous cell carcinoma in situ | ||
| Thyroid | 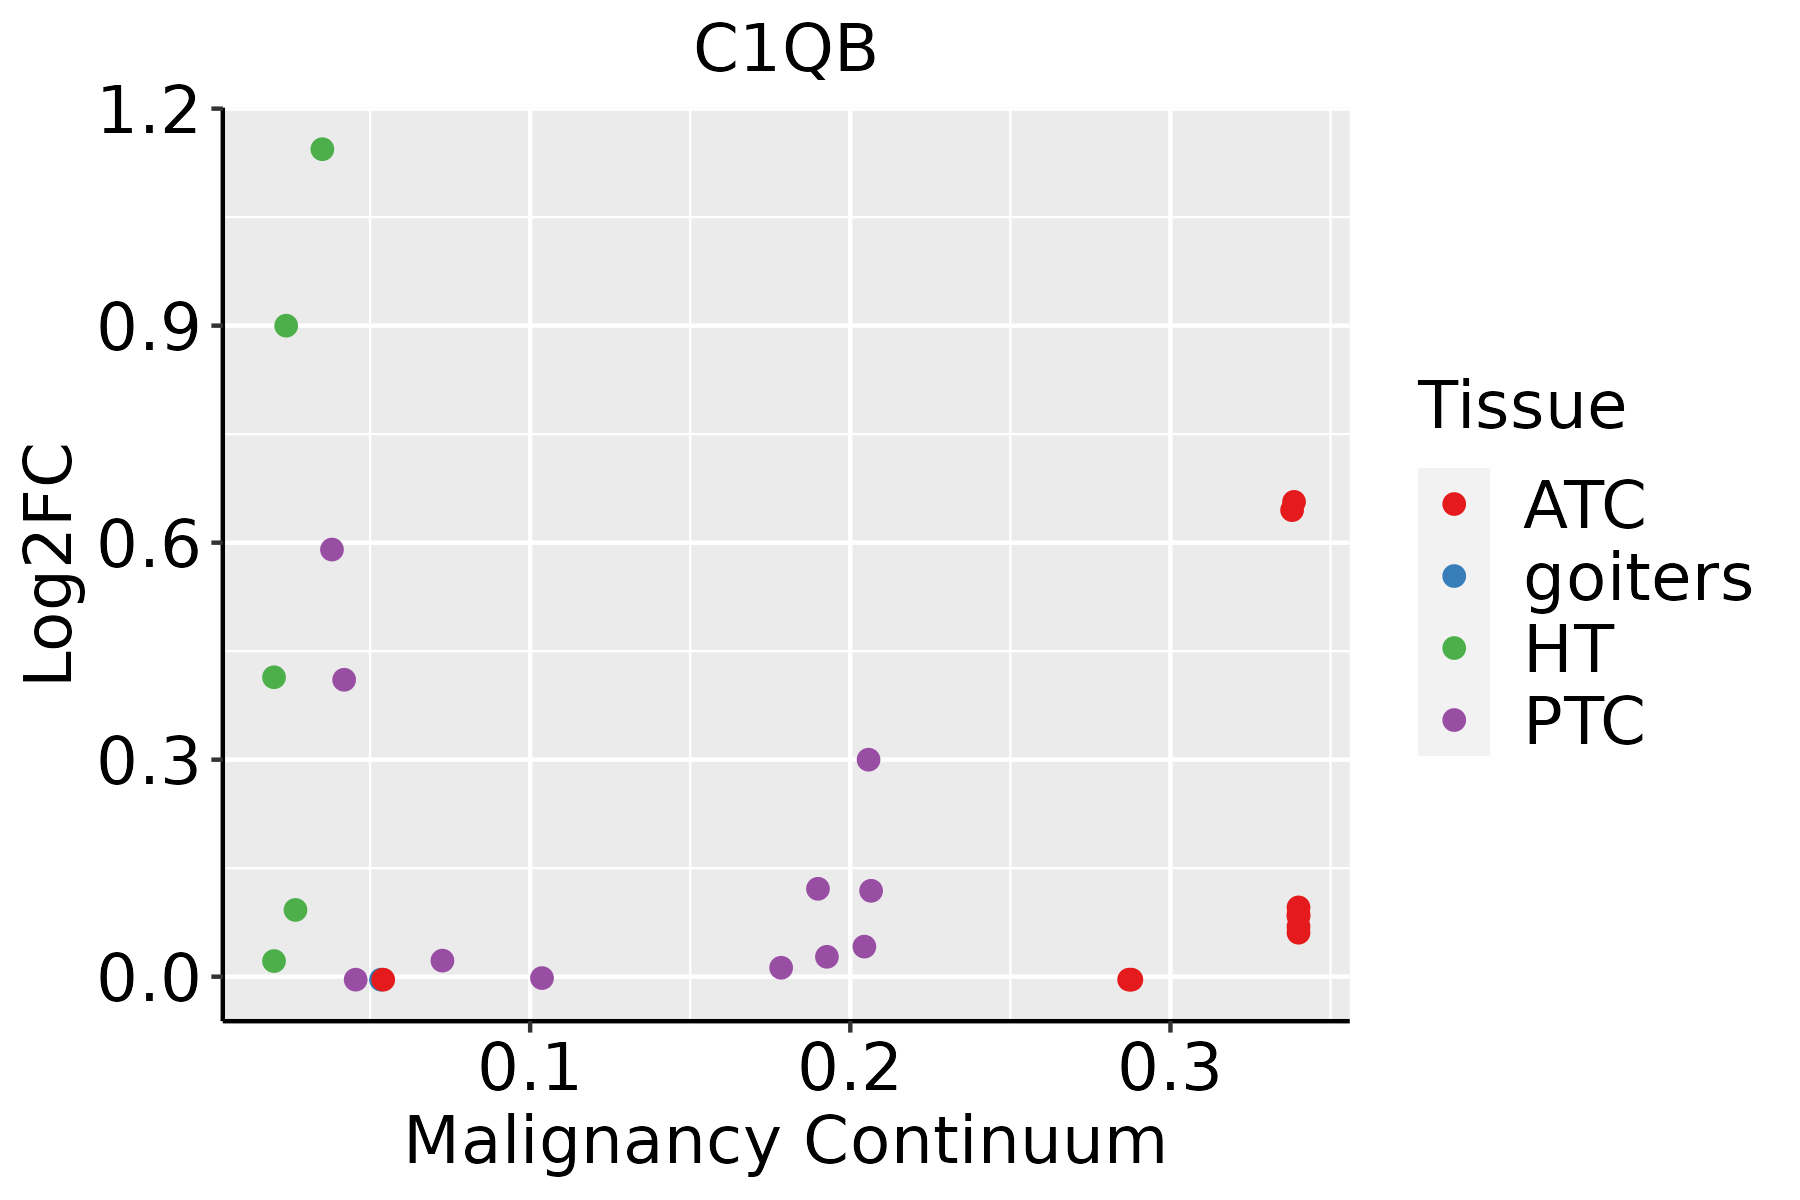 | ATC: Anaplastic thyroid cancer |
| HT: Hashimoto's thyroiditis | ||
| PTC: Papillary thyroid cancer |
| ∗log2FC in expression of this searched gene in stem-like cells from each diseased tissue sample relative to stem-like cells in normal samples in each tissue plotted against the malignancy continuum. Samples are colored based on if they are from different disease stage. |
Top |
Malignant transformation related pathway analysis |
| Find out the enriched GO biological processes and KEGG pathways involved in transition from healthy to precancer to cancer |
| Tissue | Disease Stage | Enriched GO biological Processes |
| Colorectum | AD |  |
| Colorectum | SER |  |
| Colorectum | MSS |  |
| Colorectum | MSI-H |  |
| Colorectum | FAP |  |
| ∗Top 15 enriched GO BP terms are showed in the bar plot of each disease state in each tissue. Each row represents a significant GO biological process which is colored according to the -log10(p.adjust). |
| Page: 1 2 3 4 5 6 7 8 9 |
| GO ID | Tissue | Disease Stage | Description | Gene Ratio | Bg Ratio | pvalue | p.adjust | Count |
| GO:00069596 | Breast | IDC | humoral immune response | 40/1434 | 317/18723 | 1.25e-03 | 1.33e-02 | 40 |
| GO:00022532 | Breast | IDC | activation of immune response | 43/1434 | 375/18723 | 5.16e-03 | 3.84e-02 | 43 |
| GO:000225311 | Breast | DCIS | activation of immune response | 43/1390 | 375/18723 | 2.96e-03 | 2.54e-02 | 43 |
| GO:000695911 | Breast | DCIS | humoral immune response | 37/1390 | 317/18723 | 4.16e-03 | 3.29e-02 | 37 |
| GO:002241113 | Breast | DCIS | cellular component disassembly | 48/1390 | 443/18723 | 5.35e-03 | 3.92e-02 | 48 |
| GO:001081010 | Cervix | CC | regulation of cell-substrate adhesion | 69/2311 | 221/18723 | 8.57e-14 | 5.69e-11 | 69 |
| GO:00315898 | Cervix | CC | cell-substrate adhesion | 96/2311 | 363/18723 | 1.48e-13 | 8.85e-11 | 96 |
| GO:002260410 | Cervix | CC | regulation of cell morphogenesis | 84/2311 | 309/18723 | 1.00e-12 | 4.29e-10 | 84 |
| GO:00016679 | Cervix | CC | ameboidal-type cell migration | 110/2311 | 475/18723 | 2.66e-11 | 6.36e-09 | 110 |
| GO:004578510 | Cervix | CC | positive regulation of cell adhesion | 101/2311 | 437/18723 | 1.96e-10 | 3.08e-08 | 101 |
| GO:00321035 | Cervix | CC | positive regulation of response to external stimulus | 95/2311 | 427/18723 | 5.44e-09 | 5.03e-07 | 95 |
| GO:004225510 | Cervix | CC | ribosome assembly | 25/2311 | 61/18723 | 1.70e-08 | 1.27e-06 | 25 |
| GO:00026837 | Cervix | CC | negative regulation of immune system process | 94/2311 | 434/18723 | 2.63e-08 | 1.87e-06 | 94 |
| GO:00603267 | Cervix | CC | cell chemotaxis | 73/2311 | 310/18723 | 2.82e-08 | 1.96e-06 | 73 |
| GO:00975298 | Cervix | CC | myeloid leukocyte migration | 56/2311 | 220/18723 | 7.21e-08 | 4.15e-06 | 56 |
| GO:19000249 | Cervix | CC | regulation of substrate adhesion-dependent cell spreading | 23/2311 | 57/18723 | 8.94e-08 | 5.04e-06 | 23 |
| GO:004348410 | Cervix | CC | regulation of RNA splicing | 42/2311 | 148/18723 | 1.25e-07 | 6.24e-06 | 42 |
| GO:00305957 | Cervix | CC | leukocyte chemotaxis | 57/2311 | 230/18723 | 1.48e-07 | 7.07e-06 | 57 |
| GO:00027644 | Cervix | CC | immune response-regulating signaling pathway | 97/2311 | 468/18723 | 1.49e-07 | 7.07e-06 | 97 |
| GO:00716218 | Cervix | CC | granulocyte chemotaxis | 37/2311 | 125/18723 | 2.16e-07 | 9.56e-06 | 37 |
| Page: 1 2 3 4 5 6 7 8 9 10 11 12 13 14 15 16 17 18 19 20 21 22 23 24 25 26 27 28 29 30 31 32 33 34 35 36 37 38 39 40 41 42 43 44 45 46 47 48 49 50 51 52 53 54 55 |
| Pathway ID | Tissue | Disease Stage | Description | Gene Ratio | Bg Ratio | pvalue | p.adjust | qvalue | Count |
| hsa0517124 | Breast | IDC | Coronavirus disease - COVID-19 | 86/867 | 232/8465 | 1.50e-28 | 9.72e-27 | 7.27e-27 | 86 |
| hsa0517134 | Breast | IDC | Coronavirus disease - COVID-19 | 86/867 | 232/8465 | 1.50e-28 | 9.72e-27 | 7.27e-27 | 86 |
| hsa0502043 | Breast | DCIS | Prion disease | 100/846 | 273/8465 | 1.44e-33 | 1.55e-31 | 1.14e-31 | 100 |
| hsa0517144 | Breast | DCIS | Coronavirus disease - COVID-19 | 86/846 | 232/8465 | 2.42e-29 | 1.56e-27 | 1.15e-27 | 86 |
| hsa05150 | Breast | DCIS | Staphylococcus aureus infection | 19/846 | 96/8465 | 2.68e-03 | 1.67e-02 | 1.23e-02 | 19 |
| hsa051336 | Breast | DCIS | Pertussis | 15/846 | 76/8465 | 7.42e-03 | 3.48e-02 | 2.56e-02 | 15 |
| hsa0502053 | Breast | DCIS | Prion disease | 100/846 | 273/8465 | 1.44e-33 | 1.55e-31 | 1.14e-31 | 100 |
| hsa0517154 | Breast | DCIS | Coronavirus disease - COVID-19 | 86/846 | 232/8465 | 2.42e-29 | 1.56e-27 | 1.15e-27 | 86 |
| hsa051501 | Breast | DCIS | Staphylococcus aureus infection | 19/846 | 96/8465 | 2.68e-03 | 1.67e-02 | 1.23e-02 | 19 |
| hsa0513311 | Breast | DCIS | Pertussis | 15/846 | 76/8465 | 7.42e-03 | 3.48e-02 | 2.56e-02 | 15 |
| hsa05171211 | Esophagus | ESCC | Coronavirus disease - COVID-19 | 156/4205 | 232/8465 | 3.18e-08 | 2.68e-07 | 1.37e-07 | 156 |
| hsa05171310 | Esophagus | ESCC | Coronavirus disease - COVID-19 | 156/4205 | 232/8465 | 3.18e-08 | 2.68e-07 | 1.37e-07 | 156 |
| hsa0517122 | Liver | Cirrhotic | Coronavirus disease - COVID-19 | 136/2530 | 232/8465 | 3.28e-20 | 1.82e-18 | 1.12e-18 | 136 |
| hsa0502014 | Liver | Cirrhotic | Prion disease | 152/2530 | 273/8465 | 1.84e-19 | 8.78e-18 | 5.41e-18 | 152 |
| hsa046102 | Liver | Cirrhotic | Complement and coagulation cascades | 48/2530 | 86/8465 | 4.41e-07 | 5.44e-06 | 3.35e-06 | 48 |
| hsa05133 | Liver | Cirrhotic | Pertussis | 37/2530 | 76/8465 | 4.17e-04 | 2.57e-03 | 1.58e-03 | 37 |
| hsa04936 | Liver | Cirrhotic | Alcoholic liver disease | 60/2530 | 142/8465 | 1.07e-03 | 5.85e-03 | 3.61e-03 | 60 |
| hsa0517132 | Liver | Cirrhotic | Coronavirus disease - COVID-19 | 136/2530 | 232/8465 | 3.28e-20 | 1.82e-18 | 1.12e-18 | 136 |
| hsa0502015 | Liver | Cirrhotic | Prion disease | 152/2530 | 273/8465 | 1.84e-19 | 8.78e-18 | 5.41e-18 | 152 |
| hsa046103 | Liver | Cirrhotic | Complement and coagulation cascades | 48/2530 | 86/8465 | 4.41e-07 | 5.44e-06 | 3.35e-06 | 48 |
| Page: 1 2 3 |
Top |
Cell-cell communication analysis |
| Identification of potential cell-cell interactions between two cell types and their ligand-receptor pairs for different disease states |
| Ligand | Receptor | LRpair | Pathway | Tissue | Disease Stage |
| Page: 1 |
Top |
Single-cell gene regulatory network inference analysis |
| Find out the significant the regulons (TFs) and the target genes of each regulon across cell types for different disease states |
| TF | Cell Type | Tissue | Disease Stage | Target Gene | RSS | Regulon Activity |
| ∗The dot plots of a searched regulon are shown for all cell subpopulations in each disease state of each tissue based on the regulon specific score inferred using pySCENIC and by calculating the average expression. |
| Page: 1 |
Top |
Somatic mutation of malignant transformation related genes |
| Annotation of somatic variants for genes involved in malignant transformation |
| Hugo Symbol | Variant Class | Variant Classification | dbSNP RS | HGVSc | HGVSp | HGVSp Short | SWISSPROT | BIOTYPE | SIFT | PolyPhen | Tumor Sample Barcode | Tissue | Histology | Sex | Age | Stage | Therapy Types | Drugs | Outcome |
| C1QB | SNV | Missense_Mutation | c.286N>A | p.Gly96Ser | p.G96S | P02746 | protein_coding | deleterious(0) | probably_damaging(1) | TCGA-A2-A0YD-01 | Breast | breast invasive carcinoma | Female | <65 | I/II | Chemotherapy | cytoxan | SD | |
| C1QB | SNV | Missense_Mutation | c.634N>G | p.Met212Val | p.M212V | P02746 | protein_coding | tolerated(1) | benign(0) | TCGA-AA-3815-01 | Colorectum | colon adenocarcinoma | Female | >=65 | I/II | Unknown | Unknown | SD | |
| C1QB | insertion | Frame_Shift_Ins | novel | c.495dupC | p.Gly166ArgfsTer34 | p.G166Rfs*34 | P02746 | protein_coding | TCGA-AA-A02R-01 | Colorectum | colon adenocarcinoma | Female | >=65 | I/II | Unknown | Unknown | PD | ||
| C1QB | SNV | Missense_Mutation | novel | c.131C>T | p.Pro44Leu | p.P44L | P02746 | protein_coding | deleterious(0.02) | probably_damaging(0.99) | TCGA-AJ-A3EK-01 | Endometrium | uterine corpus endometrioid carcinoma | Female | <65 | I/II | Chemotherapy | carboplatin | CR |
| C1QB | SNV | Missense_Mutation | novel | c.360N>T | p.Gln120His | p.Q120H | P02746 | protein_coding | tolerated(1) | benign(0.05) | TCGA-AJ-A3EL-01 | Endometrium | uterine corpus endometrioid carcinoma | Female | <65 | I/II | Unknown | Unknown | SD |
| C1QB | SNV | Missense_Mutation | novel | c.602C>T | p.Ala201Val | p.A201V | P02746 | protein_coding | tolerated(1) | benign(0.001) | TCGA-AP-A051-01 | Endometrium | uterine corpus endometrioid carcinoma | Female | >=65 | I/II | Unknown | Unknown | SD |
| C1QB | SNV | Missense_Mutation | c.701G>A | p.Gly234Asp | p.G234D | P02746 | protein_coding | deleterious(0) | possibly_damaging(0.889) | TCGA-AP-A051-01 | Endometrium | uterine corpus endometrioid carcinoma | Female | >=65 | I/II | Unknown | Unknown | SD | |
| C1QB | SNV | Missense_Mutation | novel | c.151N>A | p.Gly51Ser | p.G51S | P02746 | protein_coding | deleterious(0) | probably_damaging(1) | TCGA-AX-A0IZ-01 | Endometrium | uterine corpus endometrioid carcinoma | Female | <65 | I/II | Unknown | Unknown | SD |
| C1QB | SNV | Missense_Mutation | rs745414763 | c.338N>T | p.Ser113Leu | p.S113L | P02746 | protein_coding | deleterious(0.05) | possibly_damaging(0.703) | TCGA-AX-A0J0-01 | Endometrium | uterine corpus endometrioid carcinoma | Female | <65 | I/II | Unknown | Unknown | SD |
| C1QB | SNV | Missense_Mutation | rs770317321 | c.148G>A | p.Asp50Asn | p.D50N | P02746 | protein_coding | tolerated(0.25) | benign(0.033) | TCGA-BS-A0U8-01 | Endometrium | uterine corpus endometrioid carcinoma | Female | <65 | III/IV | Chemotherapy | doxorubicin | SD |
| Page: 1 2 3 4 |
Top |
Related drugs of malignant transformation related genes |
| Identification of chemicals and drugs interact with genes involved in malignant transfromation |
| (DGIdb 4.0) |
| Entrez ID | Symbol | Category | Interaction Types | Drug Claim Name | Drug Name | PMIDs |
| Page: 1 |

Copyright 2023-Present -The University of Texas Health Science Center at Houston |