
|
|||||
|
 | |
| |
| |
| |
| |
| |
|
Gene: C1QA |
Gene summary for C1QA |
| Gene information | Species | Human | Gene symbol | C1QA | Gene ID | 712 |
| Gene name | complement C1q A chain | |
| Gene Alias | C1QA | |
| Cytomap | 1p36.12 | |
| Gene Type | protein-coding | GO ID | GO:0001774 | UniProtAcc | A0A024RAG6 |
Top |
Malignant transformation analysis |
| Identification of the aberrant gene expression in precancerous and cancerous lesions by comparing the gene expression of stem-like cells in diseased tissues with normal stem cells |
| Entrez ID | Symbol | Replicates | Species | Organ | Tissue | Adj P-value | Log2FC | Malignancy |
| 712 | C1QA | GSM4909287 | Human | Breast | IDC | 1.85e-03 | 1.66e-01 | 0.2057 |
| 712 | C1QA | NCCBC11 | Human | Breast | DCIS | 3.48e-09 | 7.76e-01 | 0.1232 |
| 712 | C1QA | NCCBC14 | Human | Breast | DCIS | 7.58e-07 | 3.87e-01 | 0.2021 |
| 712 | C1QA | NCCBC3 | Human | Breast | DCIS | 1.79e-52 | 1.20e+00 | 0.1198 |
| 712 | C1QA | NCCBC5 | Human | Breast | DCIS | 1.34e-14 | 6.50e-01 | 0.2046 |
| 712 | C1QA | P2 | Human | Breast | IDC | 1.18e-02 | 1.88e-01 | 0.21 |
| 712 | C1QA | HCC1_Meng | Human | Liver | HCC | 3.17e-28 | 4.00e-02 | 0.0246 |
| 712 | C1QA | cirrhotic2 | Human | Liver | Cirrhotic | 5.59e-10 | 8.81e-02 | 0.0201 |
| 712 | C1QA | cirrhotic3 | Human | Liver | Cirrhotic | 6.50e-07 | -9.00e-06 | 0.0215 |
| 712 | C1QA | HCC2 | Human | Liver | HCC | 6.27e-10 | 1.37e+00 | 0.5341 |
| 712 | C1QA | Pt13.a | Human | Liver | HCC | 9.40e-28 | 1.07e+00 | 0.021 |
| 712 | C1QA | Pt13.b | Human | Liver | HCC | 5.26e-19 | 4.53e-01 | 0.0251 |
| 712 | C1QA | Pt13.c | Human | Liver | HCC | 1.54e-48 | 1.64e+00 | 0.0076 |
| 712 | C1QA | Pt14.d | Human | Liver | HCC | 4.32e-37 | 1.17e+00 | 0.0143 |
| 712 | C1QA | C21 | Human | Oral cavity | OSCC | 2.44e-91 | 2.94e+00 | 0.2678 |
| 712 | C1QA | C30 | Human | Oral cavity | OSCC | 3.41e-24 | 8.55e-01 | 0.3055 |
| 712 | C1QA | C38 | Human | Oral cavity | OSCC | 2.16e-03 | 6.46e-01 | 0.172 |
| 712 | C1QA | C51 | Human | Oral cavity | OSCC | 4.10e-16 | 6.56e-01 | 0.2674 |
| 712 | C1QA | C57 | Human | Oral cavity | OSCC | 4.49e-02 | 1.73e-01 | 0.1679 |
| 712 | C1QA | C07 | Human | Oral cavity | OSCC | 3.06e-03 | 4.95e-01 | 0.2491 |
| Page: 1 2 |
| Tissue | Expression Dynamics | Abbreviation |
| Breast | 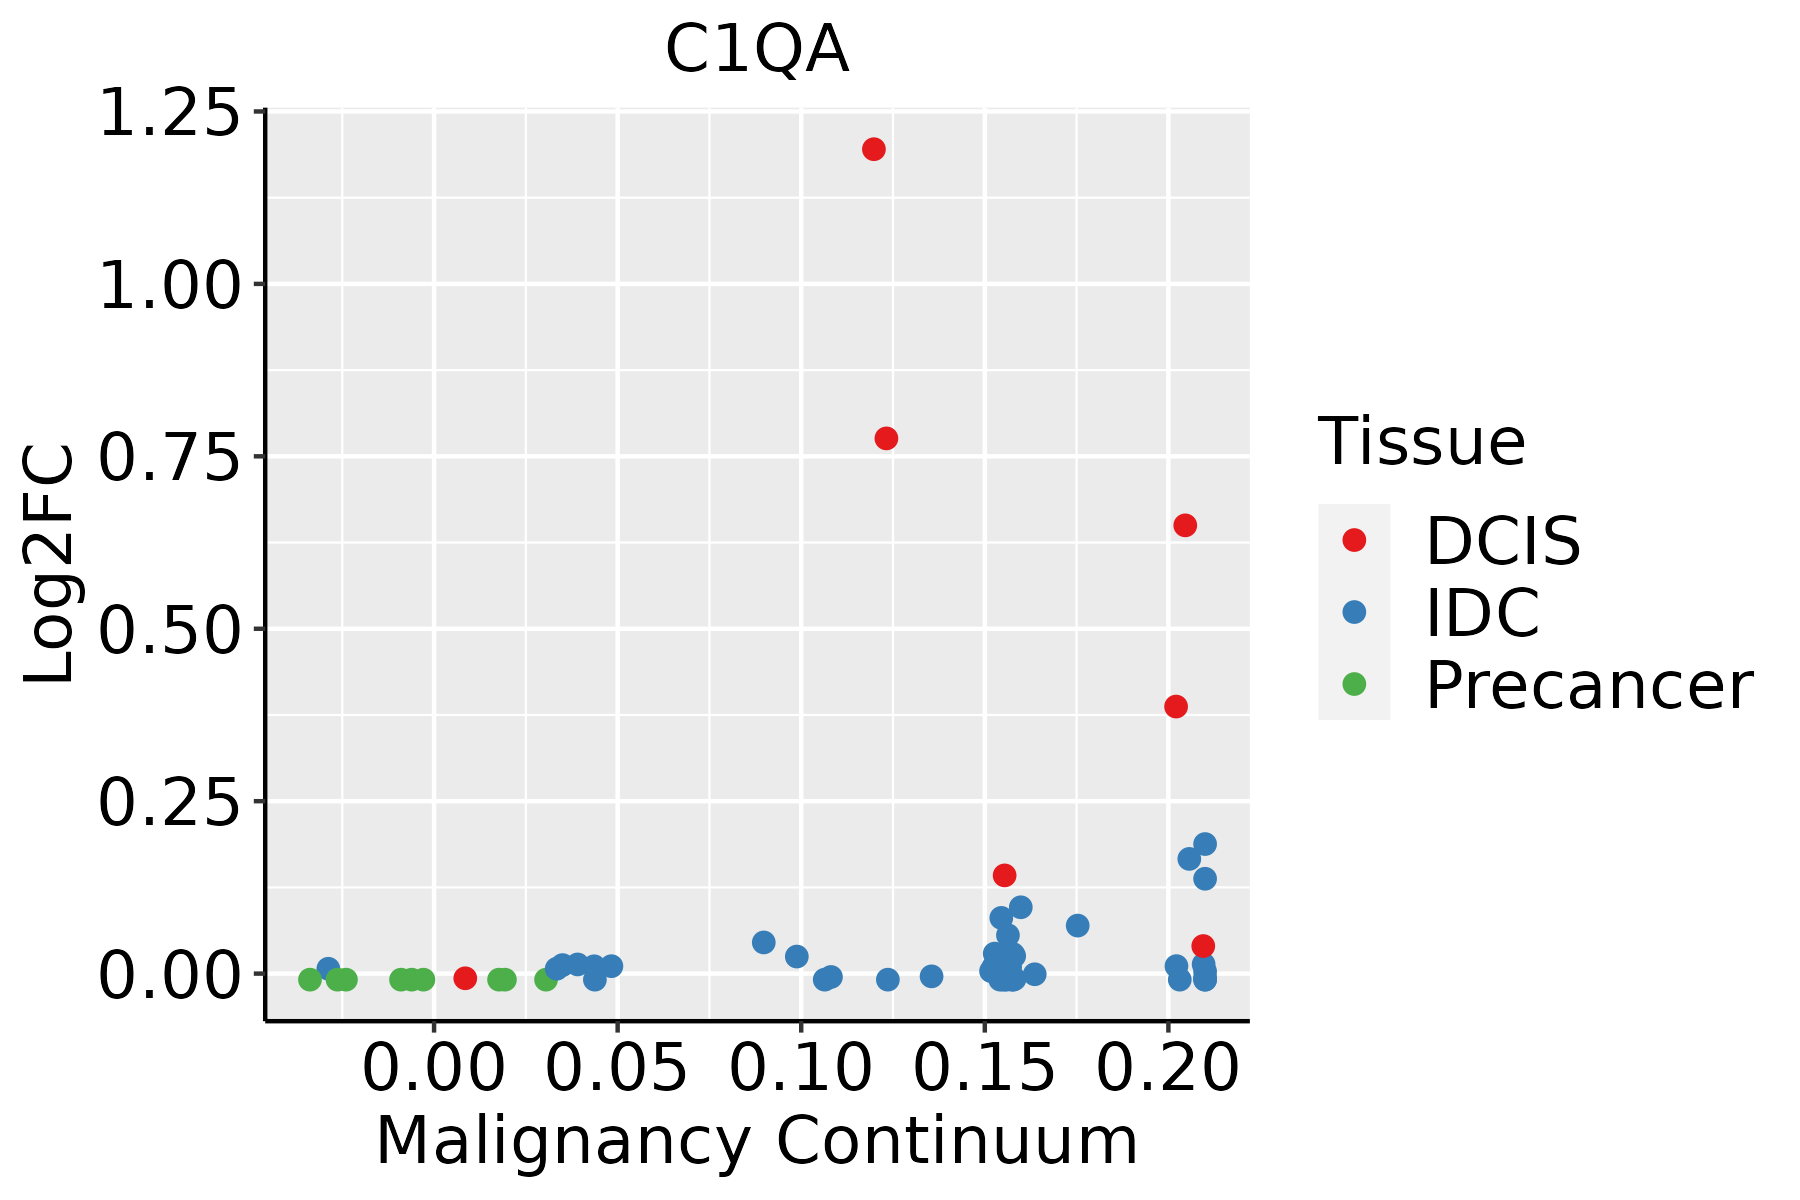 | IDC: Invasive ductal carcinoma |
| DCIS: Ductal carcinoma in situ | ||
| Precancer(BRCA1-mut): Precancerous lesion from BRCA1 mutation carriers | ||
| Liver | 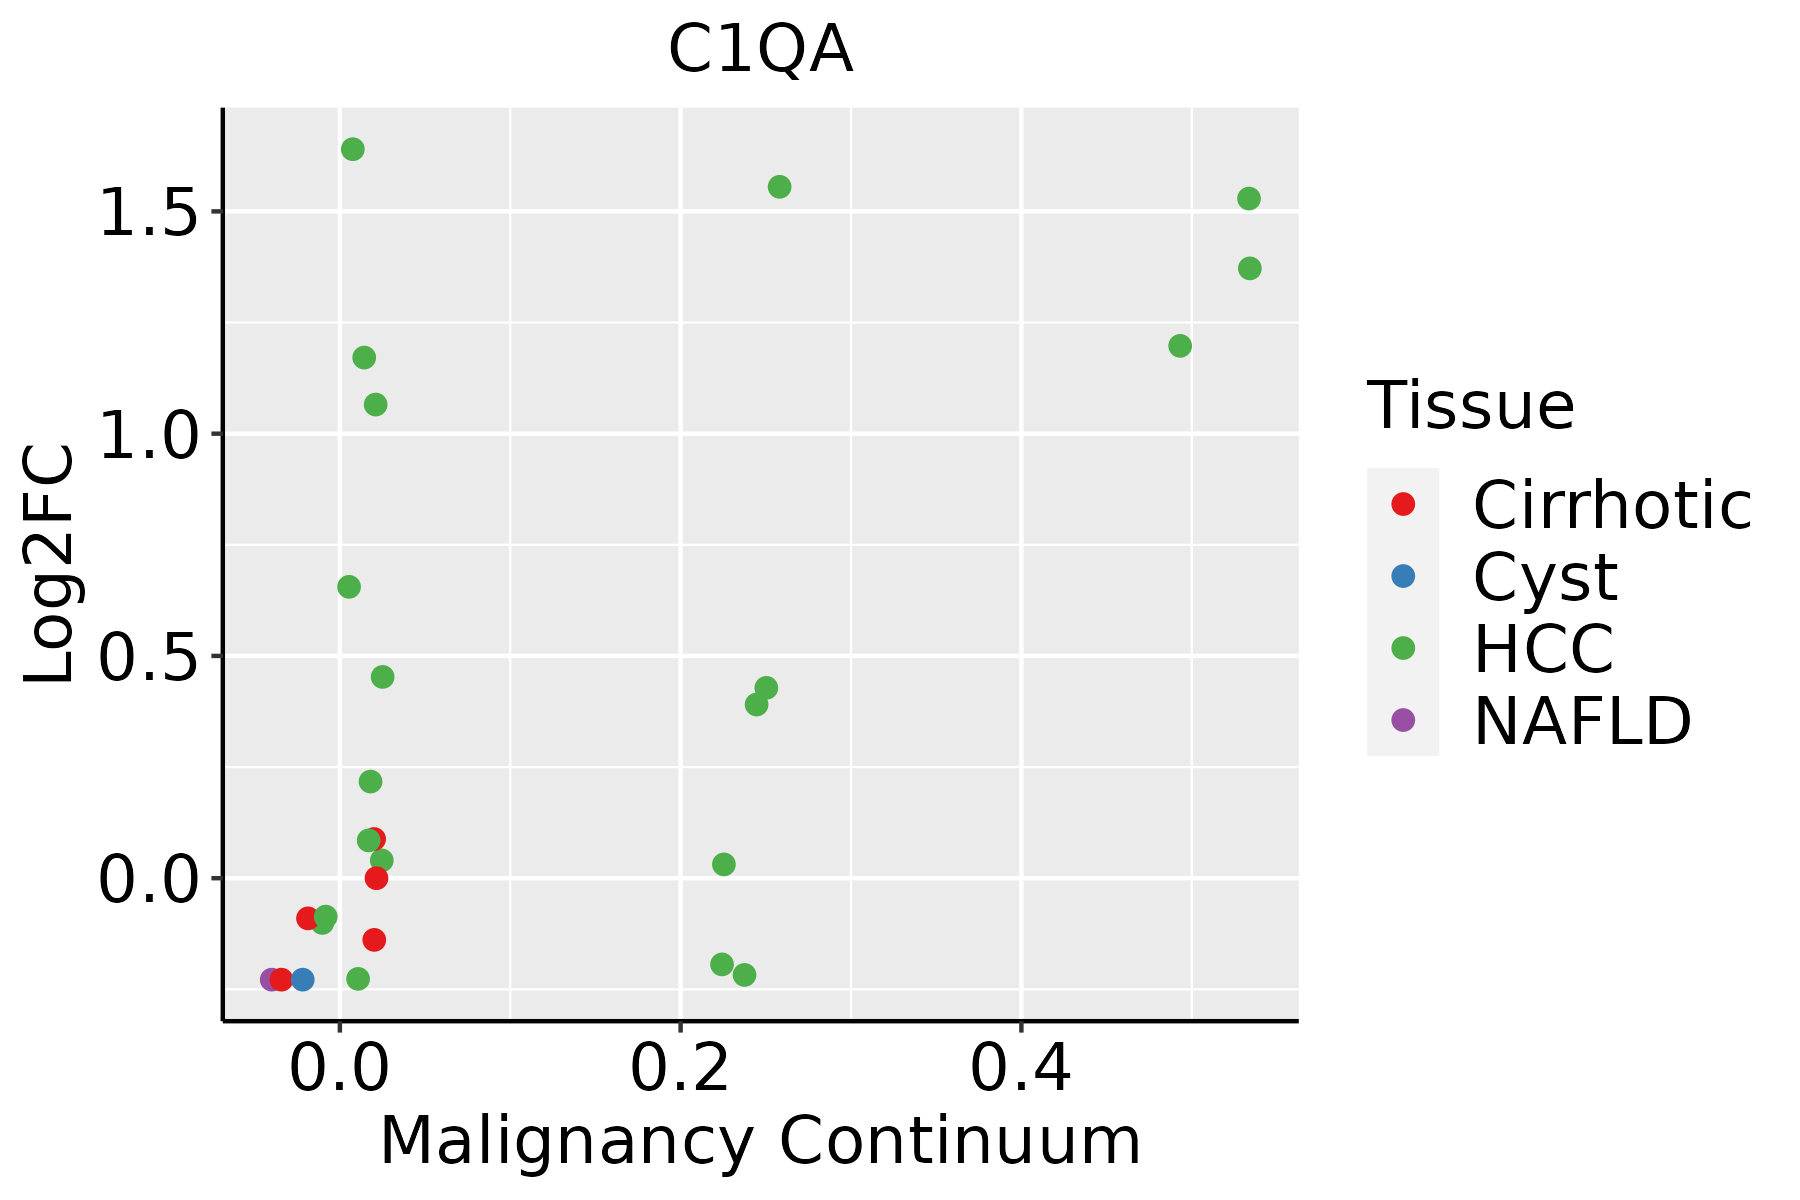 | HCC: Hepatocellular carcinoma |
| NAFLD: Non-alcoholic fatty liver disease | ||
| Oral Cavity |  | EOLP: Erosive Oral lichen planus |
| LP: leukoplakia | ||
| NEOLP: Non-erosive oral lichen planus | ||
| OSCC: Oral squamous cell carcinoma | ||
| Thyroid |  | ATC: Anaplastic thyroid cancer |
| HT: Hashimoto's thyroiditis | ||
| PTC: Papillary thyroid cancer |
| ∗log2FC in expression of this searched gene in stem-like cells from each diseased tissue sample relative to stem-like cells in normal samples in each tissue plotted against the malignancy continuum. Samples are colored based on if they are from different disease stage. |
Top |
Malignant transformation related pathway analysis |
| Find out the enriched GO biological processes and KEGG pathways involved in transition from healthy to precancer to cancer |
| Tissue | Disease Stage | Enriched GO biological Processes |
| Colorectum | AD |  |
| Colorectum | SER |  |
| Colorectum | MSS |  |
| Colorectum | MSI-H |  |
| Colorectum | FAP |  |
| ∗Top 15 enriched GO BP terms are showed in the bar plot of each disease state in each tissue. Each row represents a significant GO biological process which is colored according to the -log10(p.adjust). |
| Page: 1 2 3 4 5 6 7 8 9 |
| GO ID | Tissue | Disease Stage | Description | Gene Ratio | Bg Ratio | pvalue | p.adjust | Count |
| GO:001003814 | Breast | IDC | response to metal ion | 65/1434 | 373/18723 | 2.95e-10 | 3.42e-08 | 65 |
| GO:007099714 | Breast | IDC | neuron death | 57/1434 | 361/18723 | 1.31e-07 | 7.38e-06 | 57 |
| GO:000756813 | Breast | IDC | aging | 52/1434 | 339/18723 | 1.14e-06 | 5.10e-05 | 52 |
| GO:190121414 | Breast | IDC | regulation of neuron death | 48/1434 | 319/18723 | 5.01e-06 | 1.69e-04 | 48 |
| GO:190121614 | Breast | IDC | positive regulation of neuron death | 19/1434 | 97/18723 | 1.22e-04 | 2.25e-03 | 19 |
| GO:004206311 | Breast | IDC | gliogenesis | 39/1434 | 301/18723 | 8.63e-04 | 1.00e-02 | 39 |
| GO:00100011 | Breast | IDC | glial cell differentiation | 31/1434 | 225/18723 | 1.04e-03 | 1.15e-02 | 31 |
| GO:00069596 | Breast | IDC | humoral immune response | 40/1434 | 317/18723 | 1.25e-03 | 1.33e-02 | 40 |
| GO:0010039 | Breast | IDC | response to iron ion | 8/1434 | 32/18723 | 2.32e-03 | 2.10e-02 | 8 |
| GO:00022532 | Breast | IDC | activation of immune response | 43/1434 | 375/18723 | 5.16e-03 | 3.84e-02 | 43 |
| GO:001003824 | Breast | DCIS | response to metal ion | 65/1390 | 373/18723 | 8.03e-11 | 9.88e-09 | 65 |
| GO:007099724 | Breast | DCIS | neuron death | 57/1390 | 361/18723 | 4.56e-08 | 2.84e-06 | 57 |
| GO:190121421 | Breast | DCIS | regulation of neuron death | 48/1390 | 319/18723 | 2.13e-06 | 7.79e-05 | 48 |
| GO:000756823 | Breast | DCIS | aging | 50/1390 | 339/18723 | 2.38e-06 | 8.46e-05 | 50 |
| GO:190121622 | Breast | DCIS | positive regulation of neuron death | 20/1390 | 97/18723 | 2.45e-05 | 5.68e-04 | 20 |
| GO:00420632 | Breast | DCIS | gliogenesis | 39/1390 | 301/18723 | 4.76e-04 | 6.25e-03 | 39 |
| GO:00100012 | Breast | DCIS | glial cell differentiation | 31/1390 | 225/18723 | 6.24e-04 | 7.87e-03 | 31 |
| GO:00100391 | Breast | DCIS | response to iron ion | 8/1390 | 32/18723 | 1.90e-03 | 1.81e-02 | 8 |
| GO:000225311 | Breast | DCIS | activation of immune response | 43/1390 | 375/18723 | 2.96e-03 | 2.54e-02 | 43 |
| GO:000695911 | Breast | DCIS | humoral immune response | 37/1390 | 317/18723 | 4.16e-03 | 3.29e-02 | 37 |
| Page: 1 2 3 4 5 |
| Pathway ID | Tissue | Disease Stage | Description | Gene Ratio | Bg Ratio | pvalue | p.adjust | qvalue | Count |
| hsa0502023 | Breast | IDC | Prion disease | 102/867 | 273/8465 | 3.70e-34 | 4.01e-32 | 3.00e-32 | 102 |
| hsa0517124 | Breast | IDC | Coronavirus disease - COVID-19 | 86/867 | 232/8465 | 1.50e-28 | 9.72e-27 | 7.27e-27 | 86 |
| hsa0502033 | Breast | IDC | Prion disease | 102/867 | 273/8465 | 3.70e-34 | 4.01e-32 | 3.00e-32 | 102 |
| hsa0517134 | Breast | IDC | Coronavirus disease - COVID-19 | 86/867 | 232/8465 | 1.50e-28 | 9.72e-27 | 7.27e-27 | 86 |
| hsa0502043 | Breast | DCIS | Prion disease | 100/846 | 273/8465 | 1.44e-33 | 1.55e-31 | 1.14e-31 | 100 |
| hsa0502053 | Breast | DCIS | Prion disease | 100/846 | 273/8465 | 1.44e-33 | 1.55e-31 | 1.14e-31 | 100 |
| hsa0517122 | Liver | Cirrhotic | Coronavirus disease - COVID-19 | 136/2530 | 232/8465 | 3.28e-20 | 1.82e-18 | 1.12e-18 | 136 |
| hsa0502014 | Liver | Cirrhotic | Prion disease | 152/2530 | 273/8465 | 1.84e-19 | 8.78e-18 | 5.41e-18 | 152 |
| hsa046102 | Liver | Cirrhotic | Complement and coagulation cascades | 48/2530 | 86/8465 | 4.41e-07 | 5.44e-06 | 3.35e-06 | 48 |
| hsa05133 | Liver | Cirrhotic | Pertussis | 37/2530 | 76/8465 | 4.17e-04 | 2.57e-03 | 1.58e-03 | 37 |
| hsa04936 | Liver | Cirrhotic | Alcoholic liver disease | 60/2530 | 142/8465 | 1.07e-03 | 5.85e-03 | 3.61e-03 | 60 |
| hsa0517132 | Liver | Cirrhotic | Coronavirus disease - COVID-19 | 136/2530 | 232/8465 | 3.28e-20 | 1.82e-18 | 1.12e-18 | 136 |
| hsa0502015 | Liver | Cirrhotic | Prion disease | 152/2530 | 273/8465 | 1.84e-19 | 8.78e-18 | 5.41e-18 | 152 |
| hsa046103 | Liver | Cirrhotic | Complement and coagulation cascades | 48/2530 | 86/8465 | 4.41e-07 | 5.44e-06 | 3.35e-06 | 48 |
| hsa051331 | Liver | Cirrhotic | Pertussis | 37/2530 | 76/8465 | 4.17e-04 | 2.57e-03 | 1.58e-03 | 37 |
| hsa049361 | Liver | Cirrhotic | Alcoholic liver disease | 60/2530 | 142/8465 | 1.07e-03 | 5.85e-03 | 3.61e-03 | 60 |
| hsa0502022 | Liver | HCC | Prion disease | 195/4020 | 273/8465 | 3.26e-16 | 1.56e-14 | 8.67e-15 | 195 |
| hsa0517142 | Liver | HCC | Coronavirus disease - COVID-19 | 167/4020 | 232/8465 | 1.50e-14 | 4.19e-13 | 2.33e-13 | 167 |
| hsa049362 | Liver | HCC | Alcoholic liver disease | 89/4020 | 142/8465 | 1.73e-04 | 8.53e-04 | 4.75e-04 | 89 |
| hsa046104 | Liver | HCC | Complement and coagulation cascades | 57/4020 | 86/8465 | 3.19e-04 | 1.45e-03 | 8.04e-04 | 57 |
| Page: 1 2 |
Top |
Cell-cell communication analysis |
| Identification of potential cell-cell interactions between two cell types and their ligand-receptor pairs for different disease states |
| Ligand | Receptor | LRpair | Pathway | Tissue | Disease Stage |
| Page: 1 |
Top |
Single-cell gene regulatory network inference analysis |
| Find out the significant the regulons (TFs) and the target genes of each regulon across cell types for different disease states |
| TF | Cell Type | Tissue | Disease Stage | Target Gene | RSS | Regulon Activity |
| ∗The dot plots of a searched regulon are shown for all cell subpopulations in each disease state of each tissue based on the regulon specific score inferred using pySCENIC and by calculating the average expression. |
| Page: 1 |
Top |
Somatic mutation of malignant transformation related genes |
| Annotation of somatic variants for genes involved in malignant transformation |
| Hugo Symbol | Variant Class | Variant Classification | dbSNP RS | HGVSc | HGVSp | HGVSp Short | SWISSPROT | BIOTYPE | SIFT | PolyPhen | Tumor Sample Barcode | Tissue | Histology | Sex | Age | Stage | Therapy Types | Drugs | Outcome |
| C1QA | SNV | Missense_Mutation | c.302G>A | p.Gly101Asp | p.G101D | P02745 | protein_coding | deleterious(0) | probably_damaging(1) | TCGA-A2-A25D-01 | Breast | breast invasive carcinoma | Female | >=65 | III/IV | Hormone Therapy | tamoxiphen | SD | |
| C1QA | SNV | Missense_Mutation | novel | c.317N>T | p.Pro106Leu | p.P106L | P02745 | protein_coding | deleterious(0.01) | possibly_damaging(0.446) | TCGA-VS-A9V5-01 | Cervix | cervical & endocervical cancer | Female | <65 | I/II | Chemotherapy | carboplatin | PD |
| C1QA | SNV | Missense_Mutation | rs568891417 | c.388N>A | p.Val130Met | p.V130M | P02745 | protein_coding | tolerated(0.08) | benign(0.104) | TCGA-AD-A5EJ-01 | Colorectum | colon adenocarcinoma | Female | >=65 | I/II | Unknown | Unknown | SD |
| C1QA | SNV | Missense_Mutation | c.554N>A | p.Arg185His | p.R185H | P02745 | protein_coding | tolerated(0.1) | benign(0.011) | TCGA-AD-A5EJ-01 | Colorectum | colon adenocarcinoma | Female | >=65 | I/II | Unknown | Unknown | SD | |
| C1QA | SNV | Missense_Mutation | c.185N>T | p.Gly62Val | p.G62V | P02745 | protein_coding | deleterious(0) | possibly_damaging(0.869) | TCGA-D5-6928-01 | Colorectum | colon adenocarcinoma | Male | >=65 | I/II | Unknown | Unknown | SD | |
| C1QA | SNV | Missense_Mutation | novel | c.361C>T | p.Arg121Trp | p.R121W | P02745 | protein_coding | deleterious(0) | possibly_damaging(0.803) | TCGA-AG-A002-01 | Colorectum | rectum adenocarcinoma | Male | <65 | I/II | Unknown | Unknown | SD |
| C1QA | SNV | Missense_Mutation | novel | c.577N>C | p.Thr193Pro | p.T193P | P02745 | protein_coding | deleterious(0.04) | benign(0.007) | TCGA-AJ-A3EL-01 | Endometrium | uterine corpus endometrioid carcinoma | Female | <65 | I/II | Unknown | Unknown | SD |
| C1QA | SNV | Missense_Mutation | c.21G>T | p.Trp7Cys | p.W7C | P02745 | protein_coding | deleterious(0.01) | probably_damaging(0.96) | TCGA-AP-A056-01 | Endometrium | uterine corpus endometrioid carcinoma | Female | <65 | I/II | Unknown | Unknown | SD | |
| C1QA | SNV | Missense_Mutation | novel | c.277N>A | p.Ala93Thr | p.A93T | P02745 | protein_coding | tolerated(0.58) | benign(0.021) | TCGA-AP-A1DK-01 | Endometrium | uterine corpus endometrioid carcinoma | Female | <65 | I/II | Unknown | Unknown | SD |
| C1QA | SNV | Missense_Mutation | novel | c.417N>A | p.Asn139Lys | p.N139K | P02745 | protein_coding | deleterious(0) | probably_damaging(0.996) | TCGA-AP-A1DK-01 | Endometrium | uterine corpus endometrioid carcinoma | Female | <65 | I/II | Unknown | Unknown | SD |
| Page: 1 2 3 |
Top |
Related drugs of malignant transformation related genes |
| Identification of chemicals and drugs interact with genes involved in malignant transfromation |
| (DGIdb 4.0) |
| Entrez ID | Symbol | Category | Interaction Types | Drug Claim Name | Drug Name | PMIDs |
| 712 | C1QA | DRUGGABLE GENOME, CELL SURFACE | IMMUNE GLOBULIN |
| Page: 1 |

Copyright 2023-Present -The University of Texas Health Science Center at Houston |