
|
|||||
|
 | |
| |
| |
| |
| |
| |
|
Gene: C1GALT1 |
Gene summary for C1GALT1 |
| Gene information | Species | Human | Gene symbol | C1GALT1 | Gene ID | 56913 |
| Gene name | core 1 synthase, glycoprotein-N-acetylgalactosamine 3-beta-galactosyltransferase 1 | |
| Gene Alias | C1GALT | |
| Cytomap | 7p22.1-p21.3 | |
| Gene Type | protein-coding | GO ID | GO:0001525 | UniProtAcc | A0A024RA32 |
Top |
Malignant transformation analysis |
| Identification of the aberrant gene expression in precancerous and cancerous lesions by comparing the gene expression of stem-like cells in diseased tissues with normal stem cells |
| Entrez ID | Symbol | Replicates | Species | Organ | Tissue | Adj P-value | Log2FC | Malignancy |
| 56913 | C1GALT1 | LZE4T | Human | Esophagus | ESCC | 3.11e-07 | 2.64e-01 | 0.0811 |
| 56913 | C1GALT1 | LZE7T | Human | Esophagus | ESCC | 1.36e-02 | 2.99e-01 | 0.0667 |
| 56913 | C1GALT1 | LZE8T | Human | Esophagus | ESCC | 1.74e-10 | 3.08e-01 | 0.067 |
| 56913 | C1GALT1 | LZE20T | Human | Esophagus | ESCC | 2.15e-03 | 2.06e-01 | 0.0662 |
| 56913 | C1GALT1 | LZE24T | Human | Esophagus | ESCC | 3.71e-12 | 3.90e-01 | 0.0596 |
| 56913 | C1GALT1 | LZE21T | Human | Esophagus | ESCC | 2.71e-02 | 1.61e-01 | 0.0655 |
| 56913 | C1GALT1 | P1T-E | Human | Esophagus | ESCC | 3.38e-05 | 4.24e-01 | 0.0875 |
| 56913 | C1GALT1 | P2T-E | Human | Esophagus | ESCC | 1.50e-13 | 3.68e-01 | 0.1177 |
| 56913 | C1GALT1 | P4T-E | Human | Esophagus | ESCC | 8.83e-17 | 4.38e-01 | 0.1323 |
| 56913 | C1GALT1 | P5T-E | Human | Esophagus | ESCC | 1.84e-15 | 3.74e-01 | 0.1327 |
| 56913 | C1GALT1 | P8T-E | Human | Esophagus | ESCC | 1.31e-16 | 3.50e-01 | 0.0889 |
| 56913 | C1GALT1 | P9T-E | Human | Esophagus | ESCC | 4.48e-09 | 1.18e-01 | 0.1131 |
| 56913 | C1GALT1 | P10T-E | Human | Esophagus | ESCC | 2.53e-17 | 2.79e-01 | 0.116 |
| 56913 | C1GALT1 | P11T-E | Human | Esophagus | ESCC | 4.19e-13 | 7.58e-01 | 0.1426 |
| 56913 | C1GALT1 | P12T-E | Human | Esophagus | ESCC | 1.09e-17 | 2.53e-01 | 0.1122 |
| 56913 | C1GALT1 | P15T-E | Human | Esophagus | ESCC | 3.51e-13 | 3.74e-01 | 0.1149 |
| 56913 | C1GALT1 | P16T-E | Human | Esophagus | ESCC | 2.52e-21 | 6.07e-01 | 0.1153 |
| 56913 | C1GALT1 | P19T-E | Human | Esophagus | ESCC | 1.66e-02 | 5.07e-01 | 0.1662 |
| 56913 | C1GALT1 | P20T-E | Human | Esophagus | ESCC | 2.45e-13 | 3.32e-01 | 0.1124 |
| 56913 | C1GALT1 | P21T-E | Human | Esophagus | ESCC | 2.35e-21 | 4.75e-01 | 0.1617 |
| Page: 1 2 3 4 5 6 |
| Tissue | Expression Dynamics | Abbreviation |
| Esophagus |  | ESCC: Esophageal squamous cell carcinoma |
| HGIN: High-grade intraepithelial neoplasias | ||
| LGIN: Low-grade intraepithelial neoplasias | ||
| Liver | 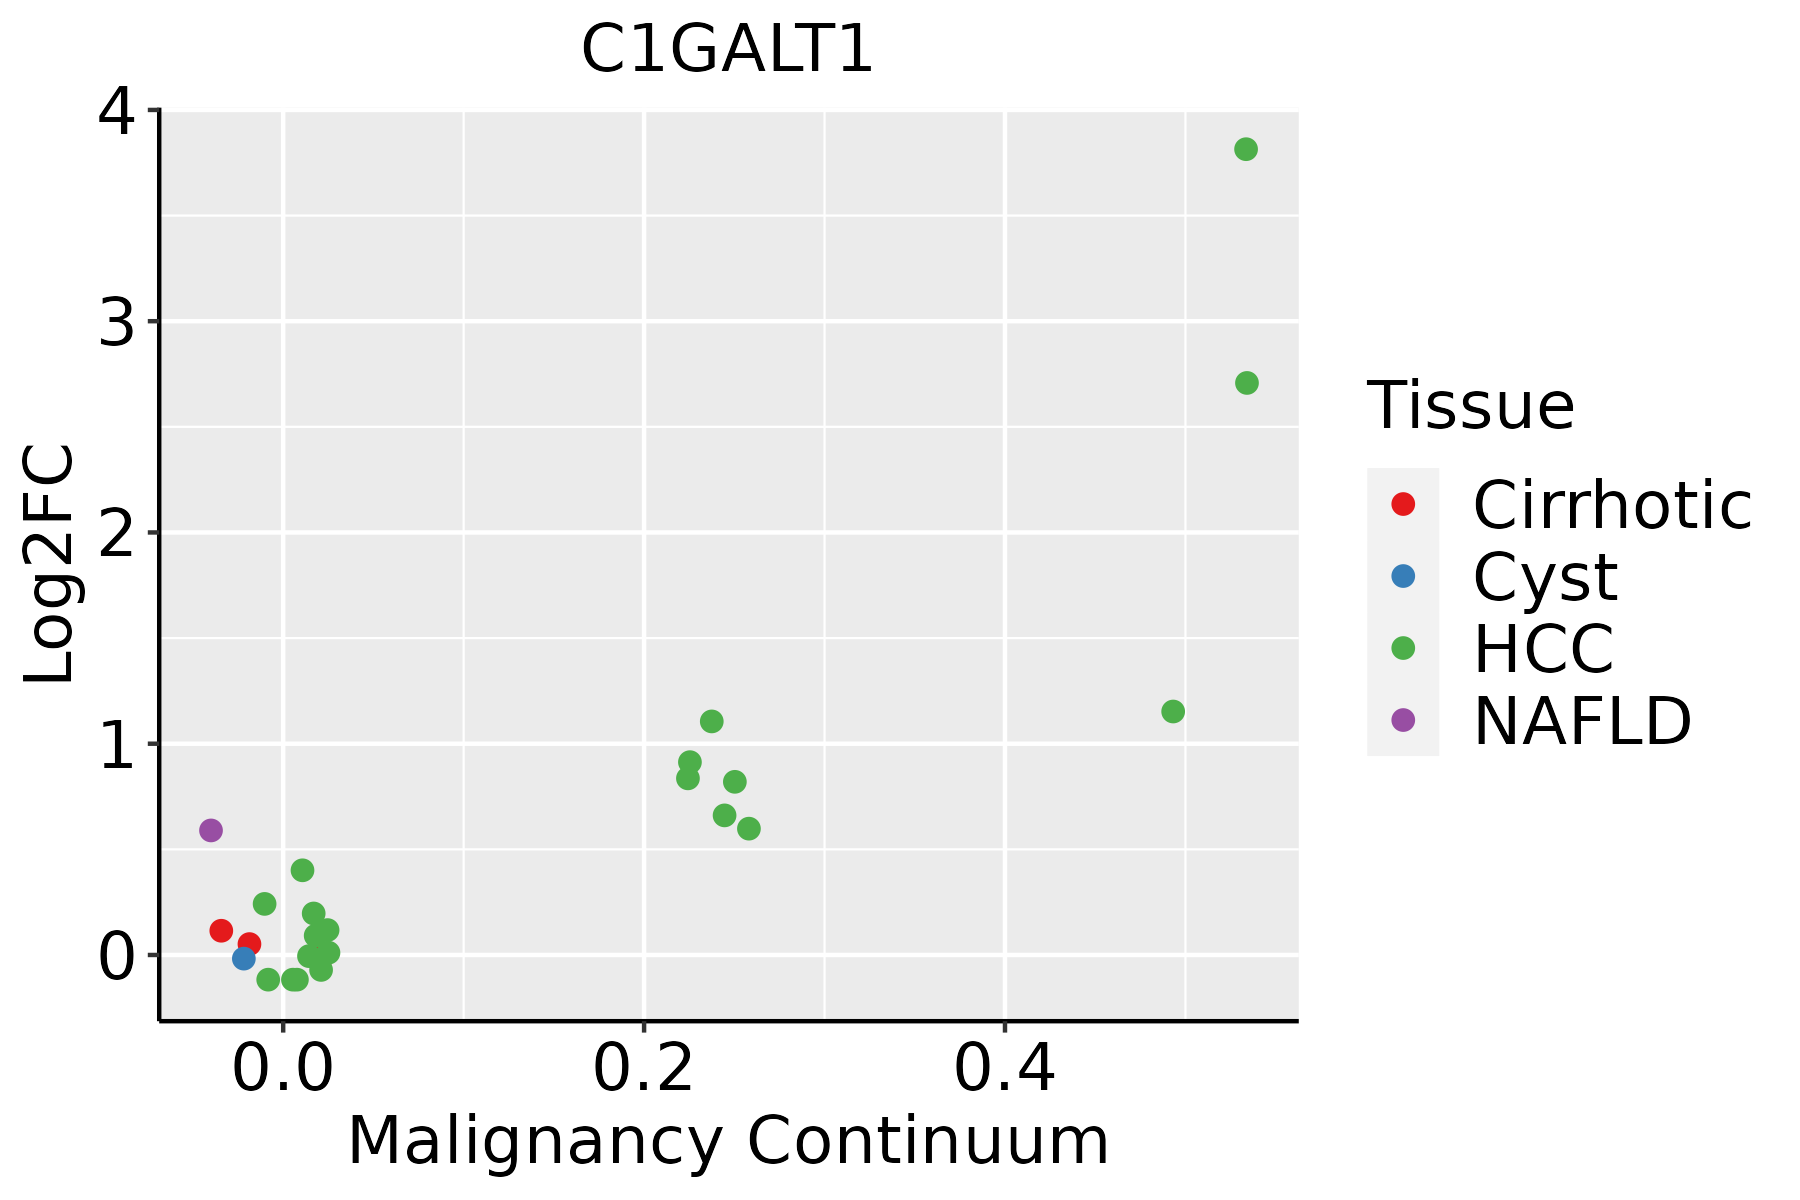 | HCC: Hepatocellular carcinoma |
| NAFLD: Non-alcoholic fatty liver disease | ||
| Oral Cavity | 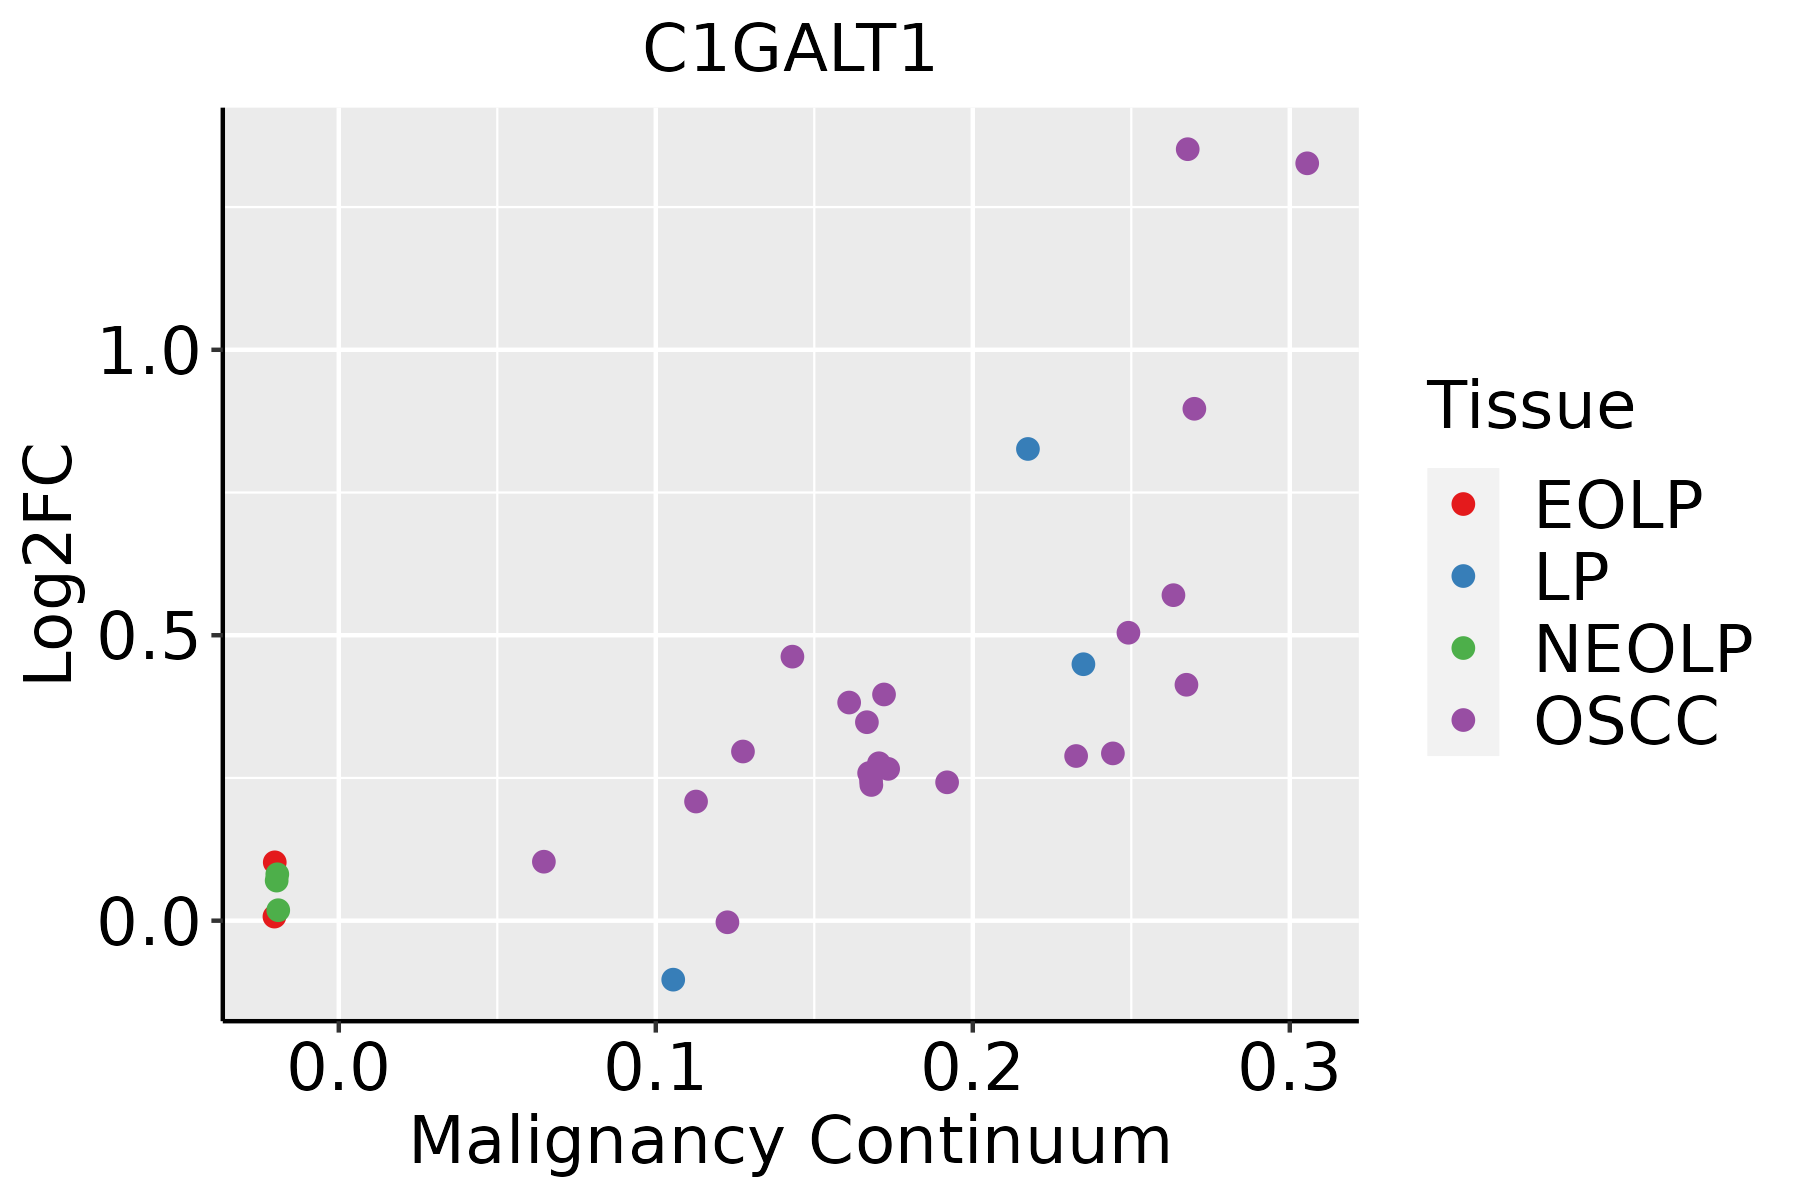 | EOLP: Erosive Oral lichen planus |
| LP: leukoplakia | ||
| NEOLP: Non-erosive oral lichen planus | ||
| OSCC: Oral squamous cell carcinoma | ||
| Skin | 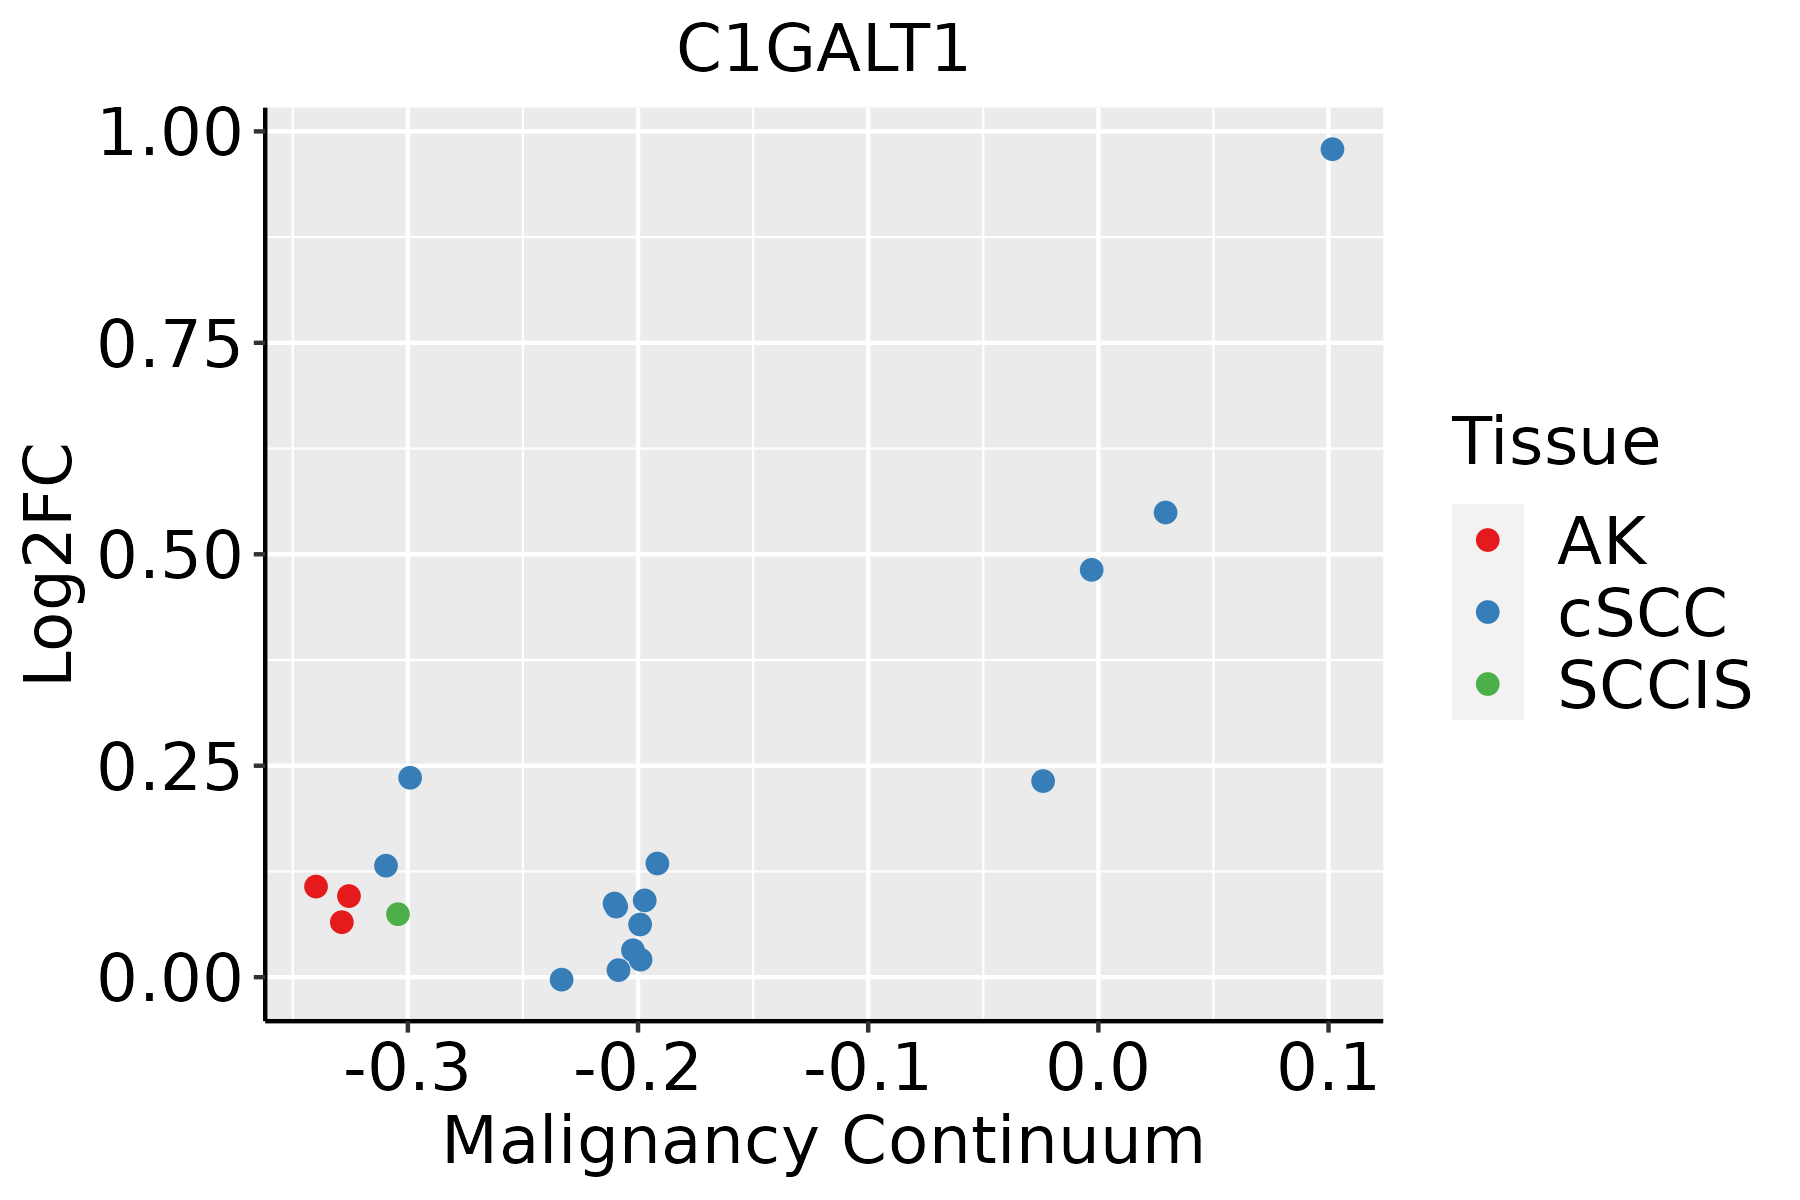 | AK: Actinic keratosis |
| cSCC: Cutaneous squamous cell carcinoma | ||
| SCCIS:squamous cell carcinoma in situ | ||
| Thyroid | 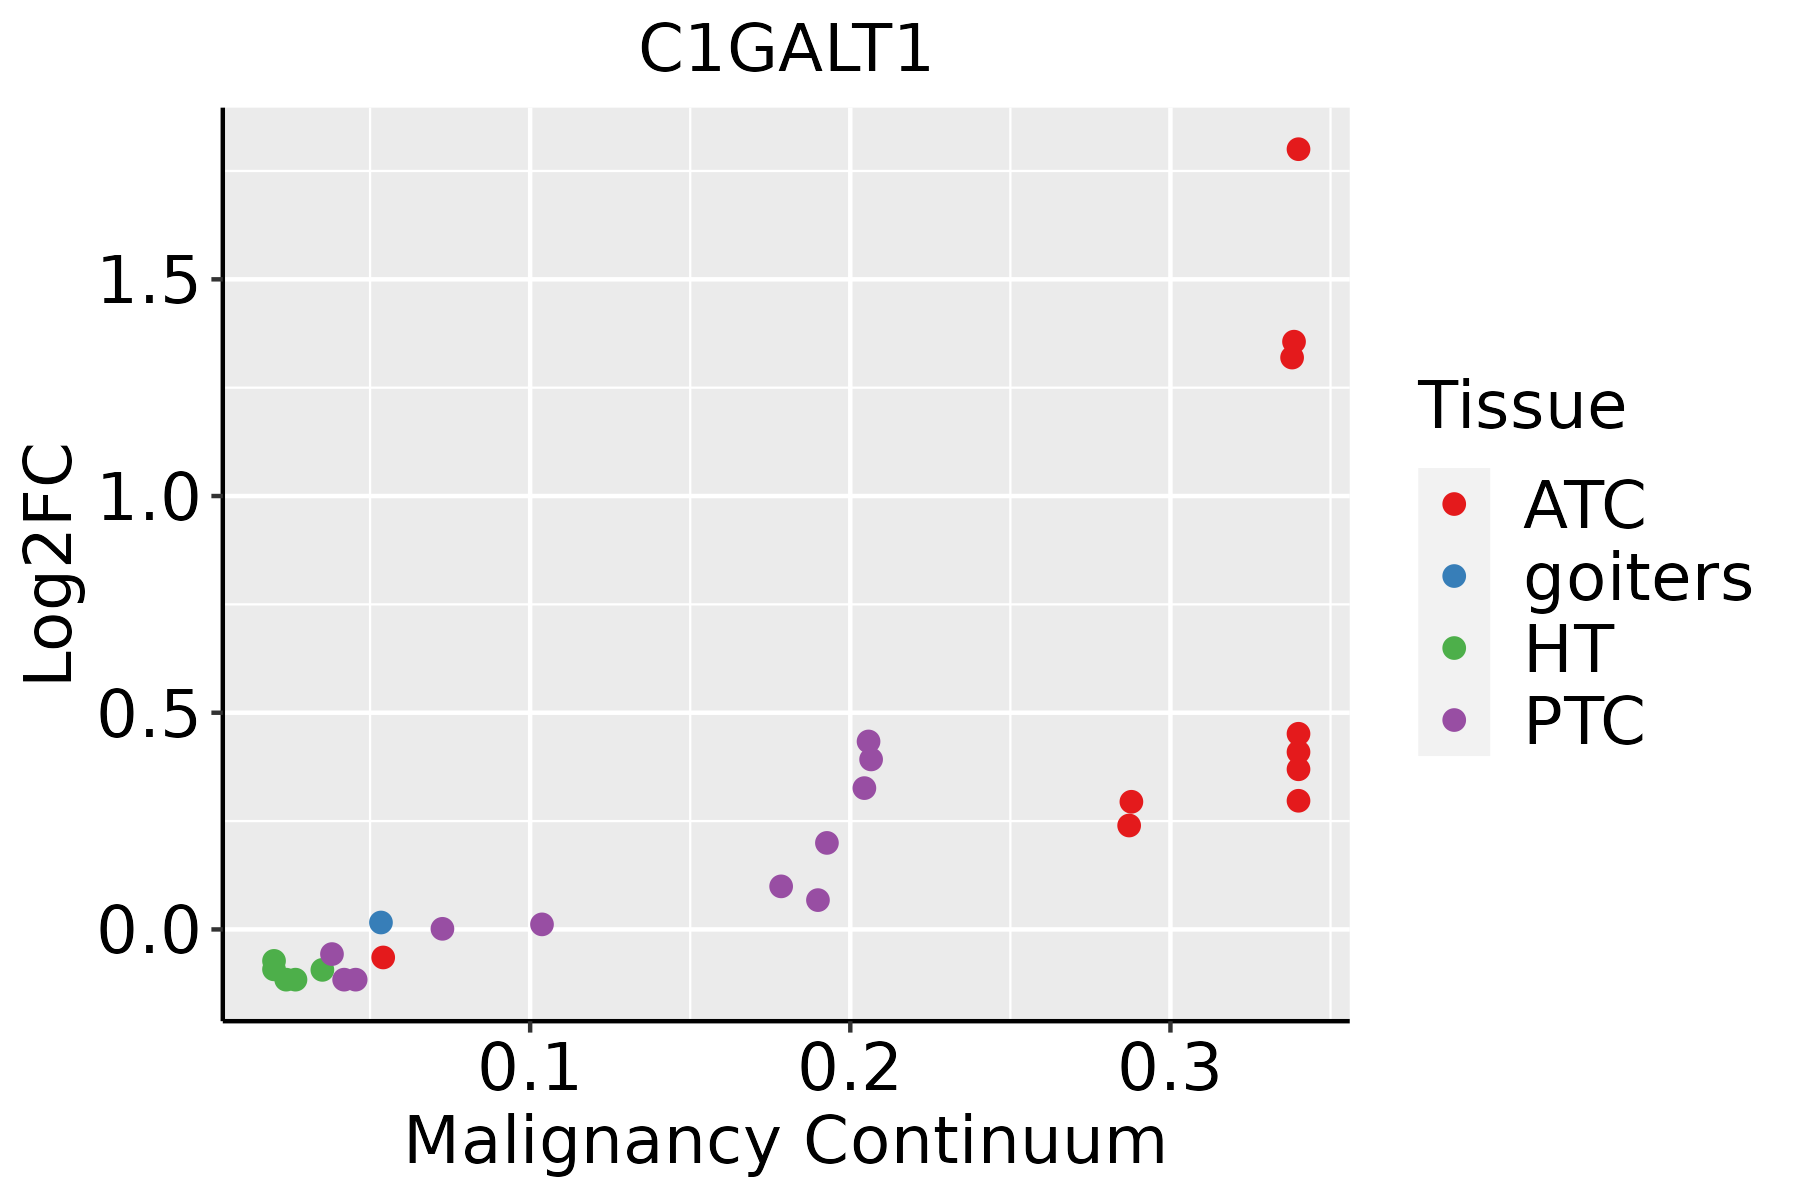 | ATC: Anaplastic thyroid cancer |
| HT: Hashimoto's thyroiditis | ||
| PTC: Papillary thyroid cancer |
| ∗log2FC in expression of this searched gene in stem-like cells from each diseased tissue sample relative to stem-like cells in normal samples in each tissue plotted against the malignancy continuum. Samples are colored based on if they are from different disease stage. |
Top |
Malignant transformation related pathway analysis |
| Find out the enriched GO biological processes and KEGG pathways involved in transition from healthy to precancer to cancer |
| Tissue | Disease Stage | Enriched GO biological Processes |
| Colorectum | AD |  |
| Colorectum | SER |  |
| Colorectum | MSS |  |
| Colorectum | MSI-H |  |
| Colorectum | FAP |  |
| ∗Top 15 enriched GO BP terms are showed in the bar plot of each disease state in each tissue. Each row represents a significant GO biological process which is colored according to the -log10(p.adjust). |
| Page: 1 2 3 4 5 6 7 8 9 |
| GO ID | Tissue | Disease Stage | Description | Gene Ratio | Bg Ratio | pvalue | p.adjust | Count |
| GO:00091002 | Esophagus | ESCC | glycoprotein metabolic process | 226/8552 | 387/18723 | 2.64e-07 | 3.94e-06 | 226 |
| GO:00700854 | Esophagus | ESCC | glycosylation | 144/8552 | 240/18723 | 5.12e-06 | 5.38e-05 | 144 |
| GO:00064865 | Esophagus | ESCC | protein glycosylation | 135/8552 | 226/18723 | 1.36e-05 | 1.24e-04 | 135 |
| GO:00434135 | Esophagus | ESCC | macromolecule glycosylation | 135/8552 | 226/18723 | 1.36e-05 | 1.24e-04 | 135 |
| GO:00091012 | Esophagus | ESCC | glycoprotein biosynthetic process | 181/8552 | 317/18723 | 2.54e-05 | 2.15e-04 | 181 |
| GO:00016559 | Esophagus | ESCC | urogenital system development | 177/8552 | 338/18723 | 7.51e-03 | 2.69e-02 | 177 |
| GO:00064931 | Esophagus | ESCC | protein O-linked glycosylation | 51/8552 | 86/18723 | 7.54e-03 | 2.70e-02 | 51 |
| GO:00064862 | Liver | HCC | protein glycosylation | 122/7958 | 226/18723 | 3.11e-04 | 2.21e-03 | 122 |
| GO:00434132 | Liver | HCC | macromolecule glycosylation | 122/7958 | 226/18723 | 3.11e-04 | 2.21e-03 | 122 |
| GO:00700852 | Liver | HCC | glycosylation | 128/7958 | 240/18723 | 4.35e-04 | 2.92e-03 | 128 |
| GO:0009100 | Liver | HCC | glycoprotein metabolic process | 193/7958 | 387/18723 | 1.89e-03 | 9.62e-03 | 193 |
| GO:00016553 | Liver | HCC | urogenital system development | 170/7958 | 338/18723 | 2.15e-03 | 1.08e-02 | 170 |
| GO:00018222 | Liver | HCC | kidney development | 148/7958 | 293/18723 | 3.25e-03 | 1.49e-02 | 148 |
| GO:00720012 | Liver | HCC | renal system development | 152/7958 | 302/18723 | 3.45e-03 | 1.56e-02 | 152 |
| GO:00091001 | Oral cavity | OSCC | glycoprotein metabolic process | 185/7305 | 387/18723 | 2.37e-04 | 1.54e-03 | 185 |
| GO:00091011 | Oral cavity | OSCC | glycoprotein biosynthetic process | 151/7305 | 317/18723 | 1.01e-03 | 5.26e-03 | 151 |
| GO:00016558 | Oral cavity | OSCC | urogenital system development | 160/7305 | 338/18723 | 1.03e-03 | 5.31e-03 | 160 |
| GO:00064864 | Oral cavity | OSCC | protein glycosylation | 111/7305 | 226/18723 | 1.22e-03 | 6.10e-03 | 111 |
| GO:00434134 | Oral cavity | OSCC | macromolecule glycosylation | 111/7305 | 226/18723 | 1.22e-03 | 6.10e-03 | 111 |
| GO:00700853 | Oral cavity | OSCC | glycosylation | 117/7305 | 240/18723 | 1.29e-03 | 6.42e-03 | 117 |
| Page: 1 2 |
| Pathway ID | Tissue | Disease Stage | Description | Gene Ratio | Bg Ratio | pvalue | p.adjust | qvalue | Count |
| Page: 1 |
Top |
Cell-cell communication analysis |
| Identification of potential cell-cell interactions between two cell types and their ligand-receptor pairs for different disease states |
| Ligand | Receptor | LRpair | Pathway | Tissue | Disease Stage |
| Page: 1 |
Top |
Single-cell gene regulatory network inference analysis |
| Find out the significant the regulons (TFs) and the target genes of each regulon across cell types for different disease states |
| TF | Cell Type | Tissue | Disease Stage | Target Gene | RSS | Regulon Activity |
| ∗The dot plots of a searched regulon are shown for all cell subpopulations in each disease state of each tissue based on the regulon specific score inferred using pySCENIC and by calculating the average expression. |
| Page: 1 |
Top |
Somatic mutation of malignant transformation related genes |
| Annotation of somatic variants for genes involved in malignant transformation |
| Hugo Symbol | Variant Class | Variant Classification | dbSNP RS | HGVSc | HGVSp | HGVSp Short | SWISSPROT | BIOTYPE | SIFT | PolyPhen | Tumor Sample Barcode | Tissue | Histology | Sex | Age | Stage | Therapy Types | Drugs | Outcome |
| C1GALT1 | SNV | Missense_Mutation | novel | c.547C>A | p.Leu183Ile | p.L183I | Q9NS00 | protein_coding | deleterious(0) | probably_damaging(0.992) | TCGA-AN-A046-01 | Breast | breast invasive carcinoma | Female | >=65 | I/II | Unknown | Unknown | SD |
| C1GALT1 | SNV | Missense_Mutation | c.220G>A | p.Asp74Asn | p.D74N | Q9NS00 | protein_coding | tolerated(0.39) | benign(0.052) | TCGA-AN-A0AR-01 | Breast | breast invasive carcinoma | Female | <65 | I/II | Unknown | Unknown | SD | |
| C1GALT1 | SNV | Missense_Mutation | novel | c.902G>A | p.Cys301Tyr | p.C301Y | Q9NS00 | protein_coding | deleterious(0) | possibly_damaging(0.885) | TCGA-BH-A0HF-01 | Breast | breast invasive carcinoma | Female | >=65 | I/II | Hormone Therapy | arimidex | SD |
| C1GALT1 | SNV | Missense_Mutation | c.1063N>C | p.Asp355His | p.D355H | Q9NS00 | protein_coding | deleterious(0.03) | benign(0.079) | TCGA-D8-A27G-01 | Breast | breast invasive carcinoma | Female | >=65 | I/II | Unknown | Unknown | SD | |
| C1GALT1 | insertion | Frame_Shift_Ins | novel | c.1073_1074insAGTG | p.Lys359ValfsTer13 | p.K359Vfs*13 | Q9NS00 | protein_coding | TCGA-A7-A26I-01 | Breast | breast invasive carcinoma | Female | >=65 | I/II | Chemotherapy | cytoxan | SD | ||
| C1GALT1 | SNV | Missense_Mutation | novel | c.967N>A | p.Val323Ile | p.V323I | Q9NS00 | protein_coding | tolerated(1) | benign(0) | TCGA-5M-AAT6-01 | Colorectum | colon adenocarcinoma | Female | <65 | III/IV | Unknown | Unknown | PD |
| C1GALT1 | SNV | Missense_Mutation | novel | c.881C>A | p.Pro294His | p.P294H | Q9NS00 | protein_coding | tolerated(0.27) | benign(0.035) | TCGA-AA-3950-01 | Colorectum | colon adenocarcinoma | Female | >=65 | I/II | Unknown | Unknown | SD |
| C1GALT1 | SNV | Missense_Mutation | c.755N>C | p.Val252Ala | p.V252A | Q9NS00 | protein_coding | deleterious(0) | probably_damaging(0.997) | TCGA-AA-A02R-01 | Colorectum | colon adenocarcinoma | Female | >=65 | I/II | Unknown | Unknown | PD | |
| C1GALT1 | SNV | Missense_Mutation | novel | c.949T>C | p.Tyr317His | p.Y317H | Q9NS00 | protein_coding | deleterious(0.03) | benign(0.321) | TCGA-CA-6717-01 | Colorectum | colon adenocarcinoma | Male | <65 | I/II | Chemotherapy | oxaliplatin | CR |
| C1GALT1 | insertion | Frame_Shift_Ins | novel | c.100_101insAATT | p.Val35LeufsTer3 | p.V35Lfs*3 | Q9NS00 | protein_coding | TCGA-AM-5820-01 | Colorectum | colon adenocarcinoma | Female | <65 | I/II | Unknown | Unknown | SD |
| Page: 1 2 3 4 5 |
Top |
Related drugs of malignant transformation related genes |
| Identification of chemicals and drugs interact with genes involved in malignant transfromation |
| (DGIdb 4.0) |
| Entrez ID | Symbol | Category | Interaction Types | Drug Claim Name | Drug Name | PMIDs |
| Page: 1 |

Copyright 2023-Present -The University of Texas Health Science Center at Houston |