
|
|||||
|
 | |
| |
| |
| |
| |
| |
|
Gene: C1D |
Gene summary for C1D |
| Gene information | Species | Human | Gene symbol | C1D | Gene ID | 10438 |
| Gene name | C1D nuclear receptor corepressor | |
| Gene Alias | LRP1 | |
| Cytomap | 2p14 | |
| Gene Type | protein-coding | GO ID | GO:0000460 | UniProtAcc | Q13901 |
Top |
Malignant transformation analysis |
| Identification of the aberrant gene expression in precancerous and cancerous lesions by comparing the gene expression of stem-like cells in diseased tissues with normal stem cells |
| Entrez ID | Symbol | Replicates | Species | Organ | Tissue | Adj P-value | Log2FC | Malignancy |
| 10438 | C1D | LZE2T | Human | Esophagus | ESCC | 1.99e-10 | 1.21e+00 | 0.082 |
| 10438 | C1D | LZE4T | Human | Esophagus | ESCC | 8.54e-35 | 9.38e-01 | 0.0811 |
| 10438 | C1D | LZE5T | Human | Esophagus | ESCC | 4.02e-07 | 5.71e-01 | 0.0514 |
| 10438 | C1D | LZE7T | Human | Esophagus | ESCC | 3.64e-10 | 6.87e-01 | 0.0667 |
| 10438 | C1D | LZE8T | Human | Esophagus | ESCC | 1.23e-13 | 5.19e-01 | 0.067 |
| 10438 | C1D | LZE20T | Human | Esophagus | ESCC | 1.98e-07 | 3.58e-01 | 0.0662 |
| 10438 | C1D | LZE22D1 | Human | Esophagus | HGIN | 8.91e-06 | 2.70e-01 | 0.0595 |
| 10438 | C1D | LZE22T | Human | Esophagus | ESCC | 3.17e-09 | 6.34e-01 | 0.068 |
| 10438 | C1D | LZE24T | Human | Esophagus | ESCC | 3.36e-30 | 8.80e-01 | 0.0596 |
| 10438 | C1D | LZE21T | Human | Esophagus | ESCC | 2.19e-09 | 6.68e-01 | 0.0655 |
| 10438 | C1D | LZE6T | Human | Esophagus | ESCC | 4.51e-09 | 4.67e-01 | 0.0845 |
| 10438 | C1D | P1T-E | Human | Esophagus | ESCC | 1.48e-10 | 7.86e-01 | 0.0875 |
| 10438 | C1D | P2T-E | Human | Esophagus | ESCC | 8.79e-59 | 9.53e-01 | 0.1177 |
| 10438 | C1D | P4T-E | Human | Esophagus | ESCC | 2.49e-54 | 1.22e+00 | 0.1323 |
| 10438 | C1D | P5T-E | Human | Esophagus | ESCC | 1.20e-47 | 8.69e-01 | 0.1327 |
| 10438 | C1D | P8T-E | Human | Esophagus | ESCC | 5.12e-58 | 8.93e-01 | 0.0889 |
| 10438 | C1D | P9T-E | Human | Esophagus | ESCC | 6.21e-35 | 7.23e-01 | 0.1131 |
| 10438 | C1D | P10T-E | Human | Esophagus | ESCC | 2.97e-57 | 9.14e-01 | 0.116 |
| 10438 | C1D | P11T-E | Human | Esophagus | ESCC | 7.69e-27 | 9.68e-01 | 0.1426 |
| 10438 | C1D | P12T-E | Human | Esophagus | ESCC | 3.61e-58 | 1.05e+00 | 0.1122 |
| Page: 1 2 3 4 5 6 7 |
| Tissue | Expression Dynamics | Abbreviation |
| Esophagus | 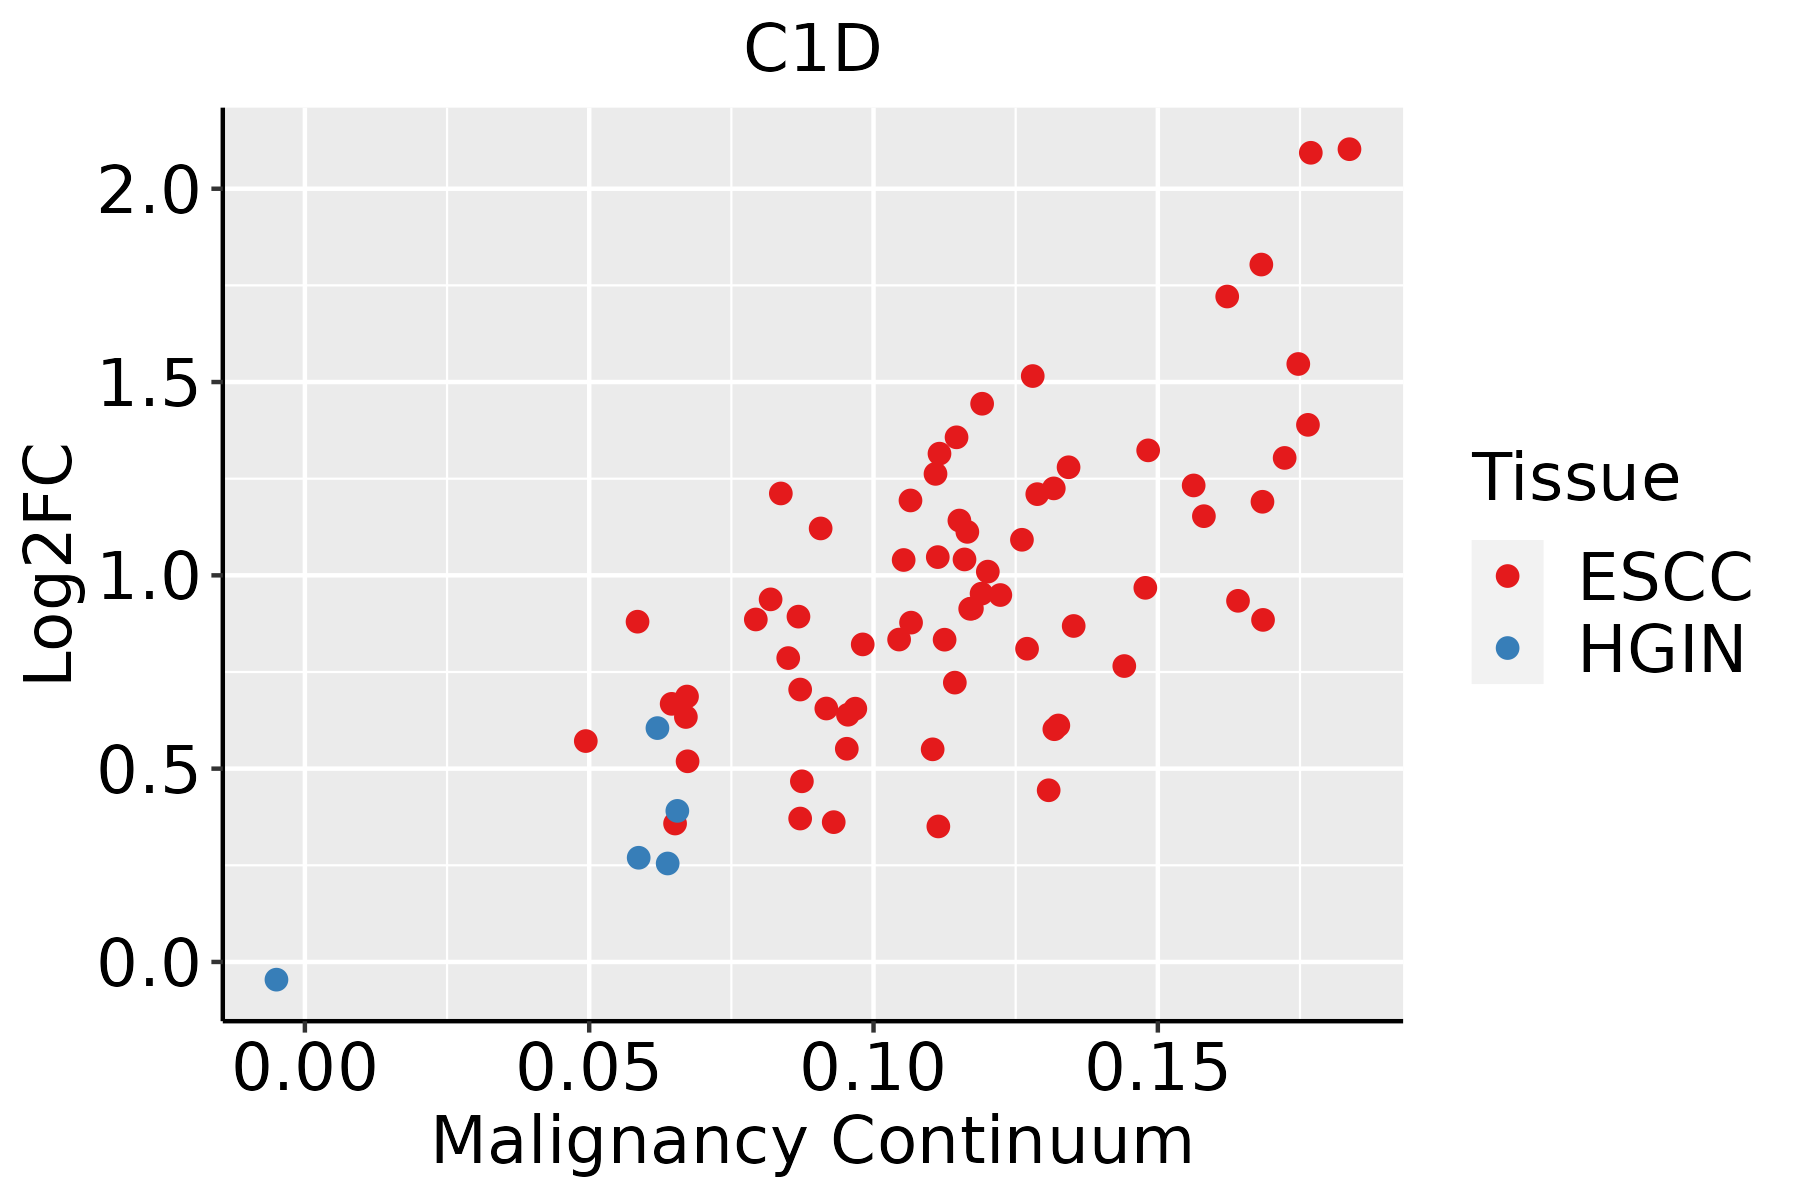 | ESCC: Esophageal squamous cell carcinoma |
| HGIN: High-grade intraepithelial neoplasias | ||
| LGIN: Low-grade intraepithelial neoplasias | ||
| Liver |  | HCC: Hepatocellular carcinoma |
| NAFLD: Non-alcoholic fatty liver disease | ||
| Oral Cavity | 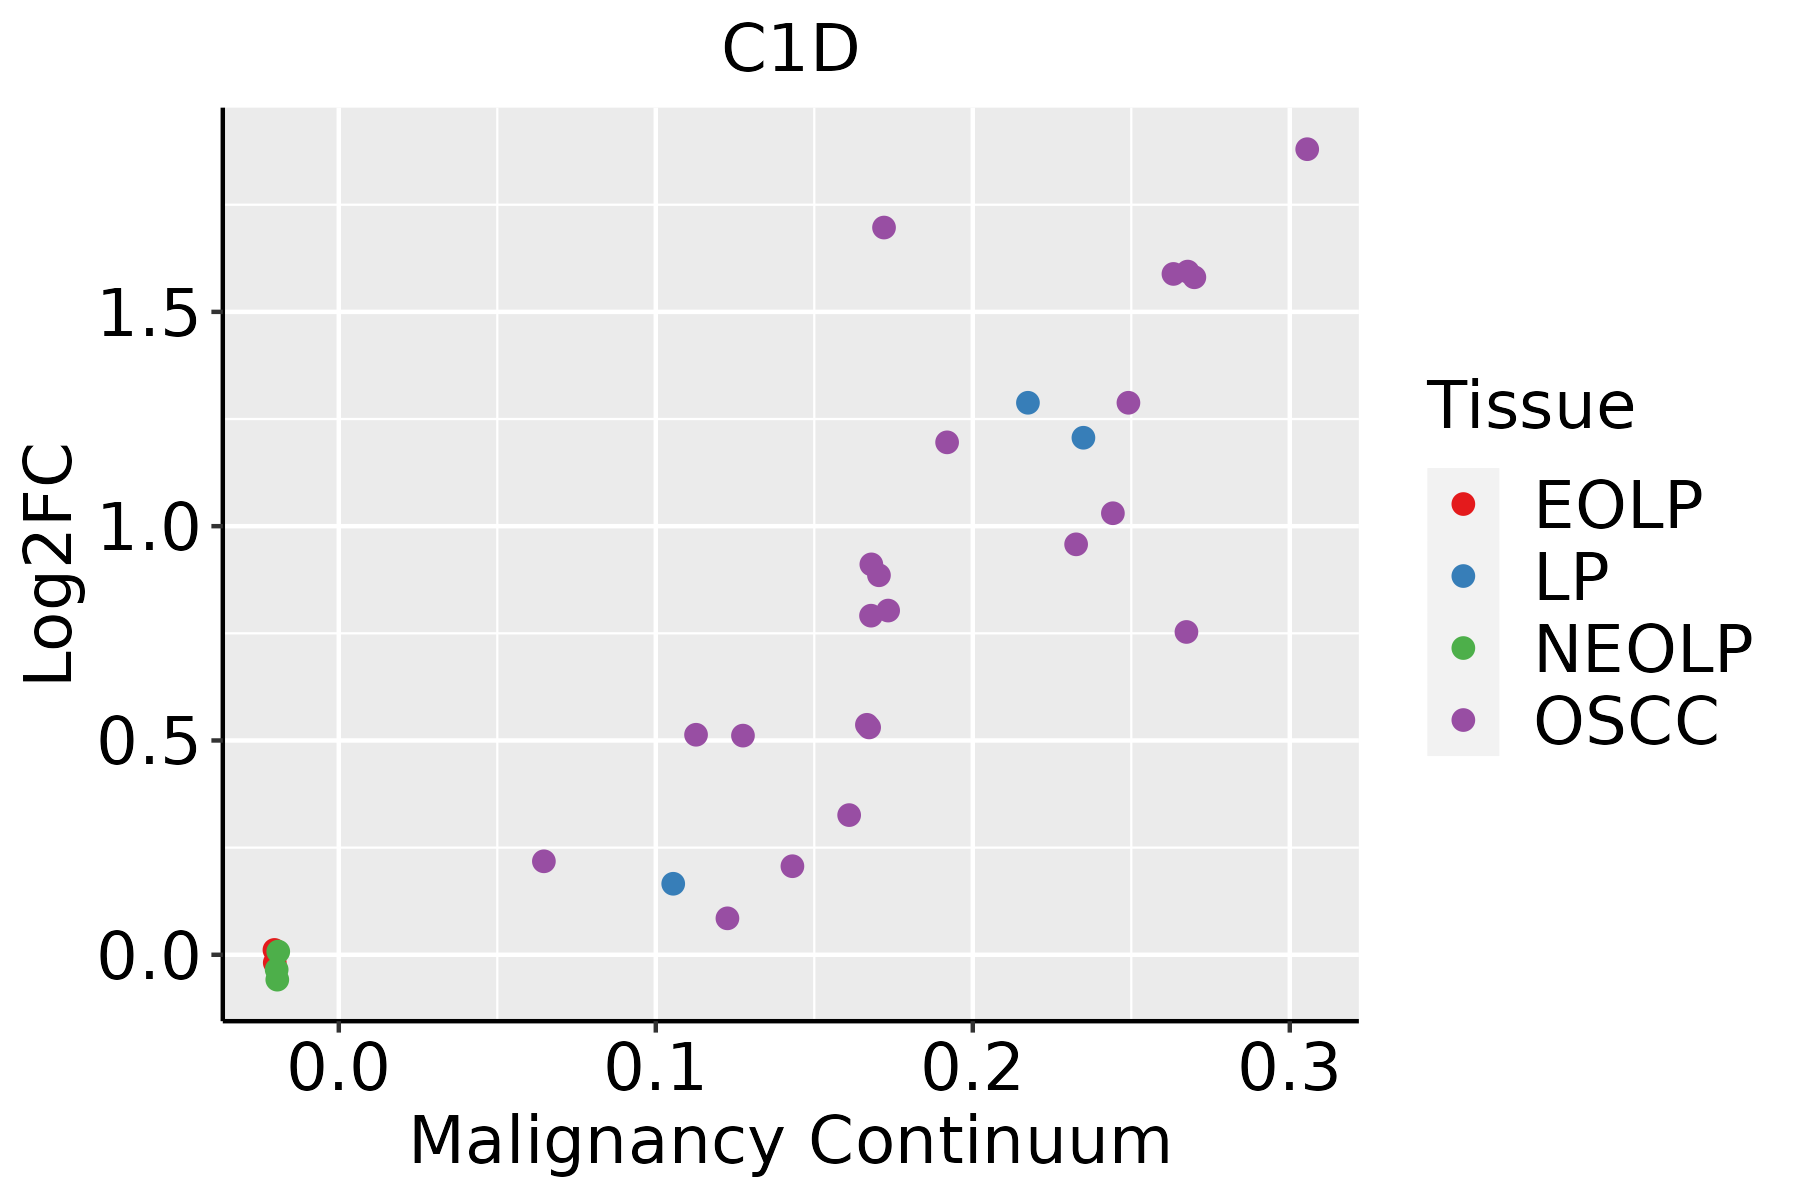 | EOLP: Erosive Oral lichen planus |
| LP: leukoplakia | ||
| NEOLP: Non-erosive oral lichen planus | ||
| OSCC: Oral squamous cell carcinoma | ||
| Skin |  | AK: Actinic keratosis |
| cSCC: Cutaneous squamous cell carcinoma | ||
| SCCIS:squamous cell carcinoma in situ | ||
| Thyroid | 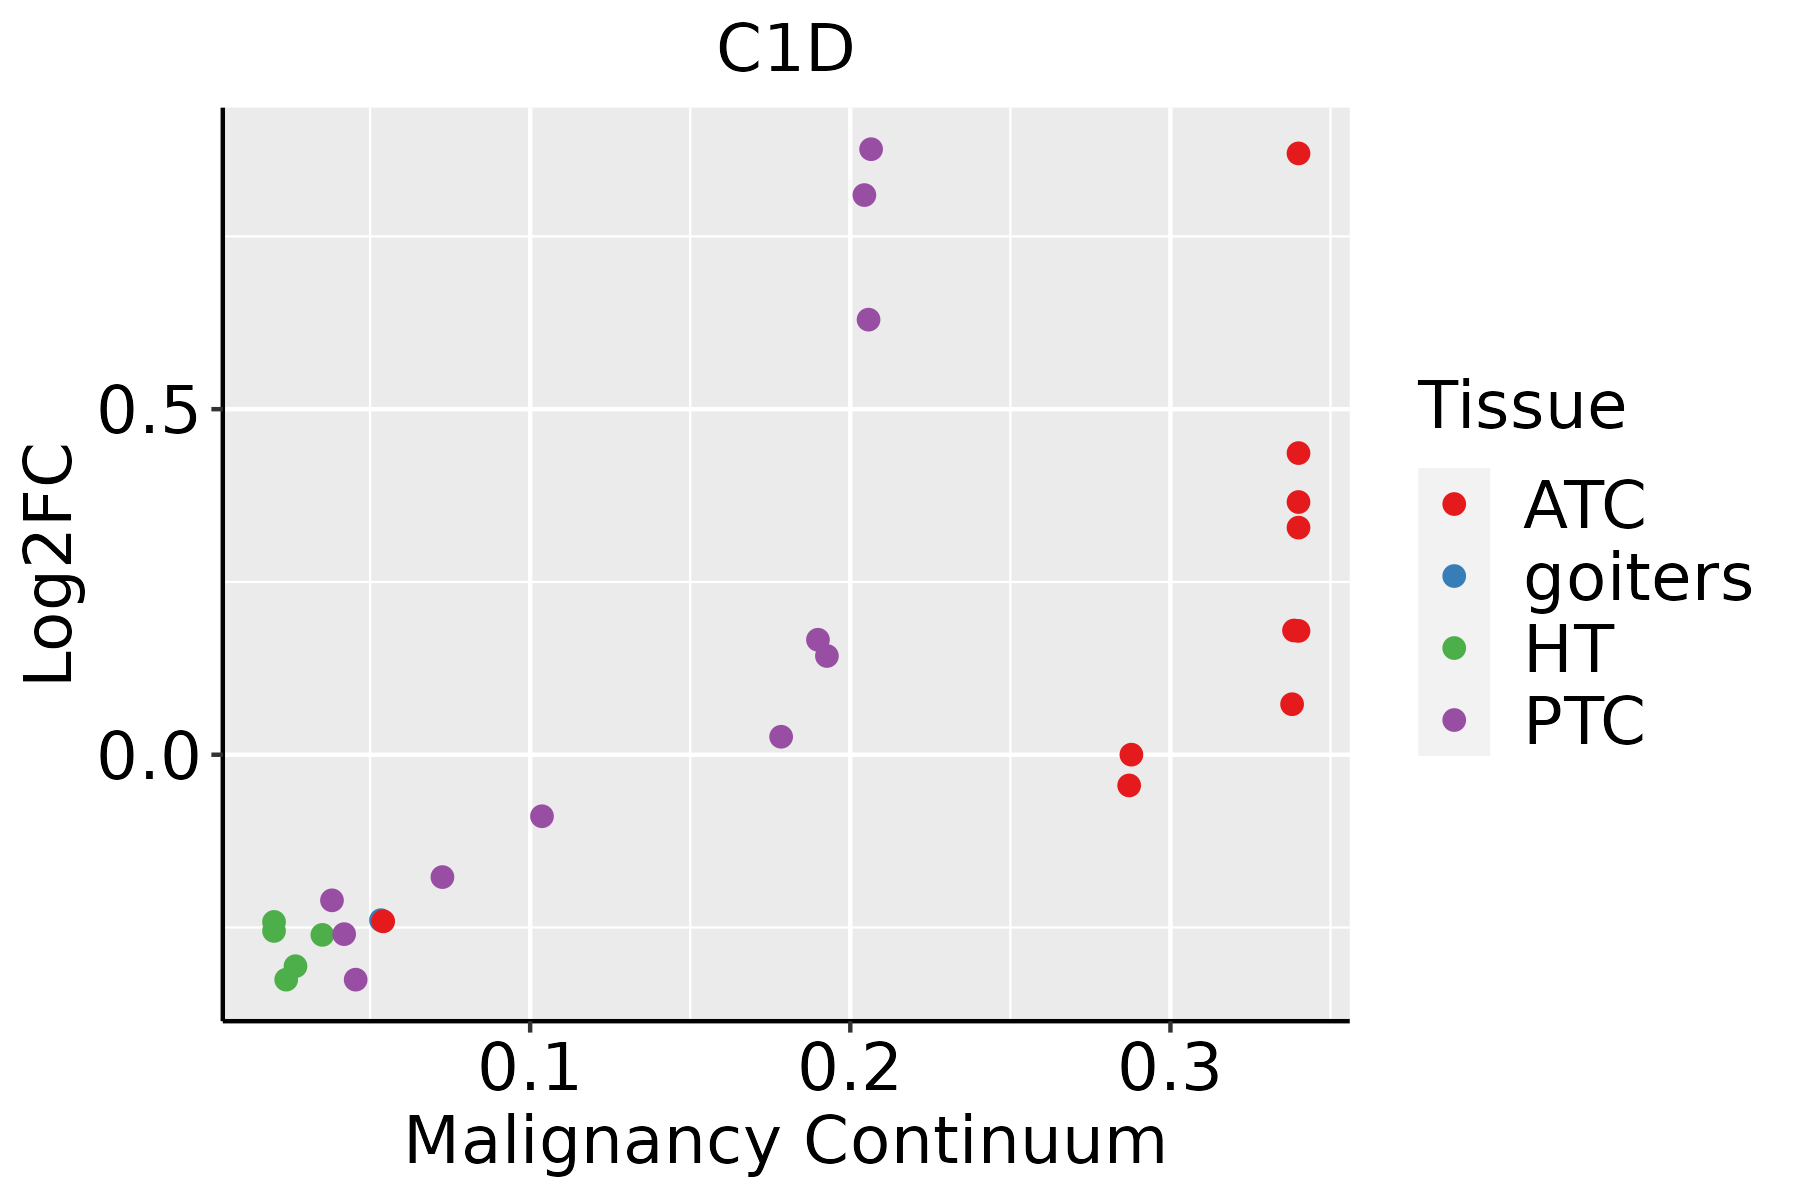 | ATC: Anaplastic thyroid cancer |
| HT: Hashimoto's thyroiditis | ||
| PTC: Papillary thyroid cancer |
| ∗log2FC in expression of this searched gene in stem-like cells from each diseased tissue sample relative to stem-like cells in normal samples in each tissue plotted against the malignancy continuum. Samples are colored based on if they are from different disease stage. |
Top |
Malignant transformation related pathway analysis |
| Find out the enriched GO biological processes and KEGG pathways involved in transition from healthy to precancer to cancer |
| Tissue | Disease Stage | Enriched GO biological Processes |
| Colorectum | AD |  |
| Colorectum | SER |  |
| Colorectum | MSS |  |
| Colorectum | MSI-H |  |
| Colorectum | FAP |  |
| ∗Top 15 enriched GO BP terms are showed in the bar plot of each disease state in each tissue. Each row represents a significant GO biological process which is colored according to the -log10(p.adjust). |
| Page: 1 2 3 4 5 6 7 8 9 |
| GO ID | Tissue | Disease Stage | Description | Gene Ratio | Bg Ratio | pvalue | p.adjust | Count |
| GO:00430877 | Cervix | CC | regulation of GTPase activity | 79/2311 | 348/18723 | 4.21e-08 | 2.60e-06 | 79 |
| GO:003166710 | Cervix | CC | response to nutrient levels | 92/2311 | 474/18723 | 5.80e-06 | 1.42e-04 | 92 |
| GO:00425948 | Cervix | CC | response to starvation | 46/2311 | 197/18723 | 1.24e-05 | 2.59e-04 | 46 |
| GO:00068987 | Cervix | CC | receptor-mediated endocytosis | 53/2311 | 244/18723 | 2.52e-05 | 4.29e-04 | 53 |
| GO:00301008 | Cervix | CC | regulation of endocytosis | 47/2311 | 211/18723 | 3.65e-05 | 5.82e-04 | 47 |
| GO:00458077 | Cervix | CC | positive regulation of endocytosis | 27/2311 | 100/18723 | 5.55e-05 | 8.10e-04 | 27 |
| GO:00435476 | Cervix | CC | positive regulation of GTPase activity | 53/2311 | 255/18723 | 8.72e-05 | 1.16e-03 | 53 |
| GO:00162367 | Cervix | CC | macroautophagy | 58/2311 | 291/18723 | 1.40e-04 | 1.70e-03 | 58 |
| GO:00161977 | Cervix | CC | endosomal transport | 48/2311 | 230/18723 | 1.65e-04 | 1.97e-03 | 48 |
| GO:00431127 | Cervix | CC | receptor metabolic process | 37/2311 | 166/18723 | 2.31e-04 | 2.58e-03 | 37 |
| GO:00482597 | Cervix | CC | regulation of receptor-mediated endocytosis | 24/2311 | 110/18723 | 3.62e-03 | 2.31e-02 | 24 |
| GO:00164827 | Cervix | CC | cytosolic transport | 33/2311 | 168/18723 | 4.43e-03 | 2.70e-02 | 33 |
| GO:00316236 | Cervix | CC | receptor internalization | 24/2311 | 113/18723 | 5.18e-03 | 3.05e-02 | 24 |
| GO:0009895 | Colorectum | AD | negative regulation of catabolic process | 124/3918 | 320/18723 | 1.66e-13 | 3.35e-11 | 124 |
| GO:0031330 | Colorectum | AD | negative regulation of cellular catabolic process | 104/3918 | 262/18723 | 2.66e-12 | 3.96e-10 | 104 |
| GO:0048193 | Colorectum | AD | Golgi vesicle transport | 109/3918 | 296/18723 | 1.80e-10 | 1.68e-08 | 109 |
| GO:0016197 | Colorectum | AD | endosomal transport | 90/3918 | 230/18723 | 1.88e-10 | 1.73e-08 | 90 |
| GO:0010506 | Colorectum | AD | regulation of autophagy | 111/3918 | 317/18723 | 3.57e-09 | 2.35e-07 | 111 |
| GO:0016482 | Colorectum | AD | cytosolic transport | 68/3918 | 168/18723 | 6.00e-09 | 3.72e-07 | 68 |
| GO:0016236 | Colorectum | AD | macroautophagy | 103/3918 | 291/18723 | 6.76e-09 | 4.15e-07 | 103 |
| Page: 1 2 3 4 5 6 7 8 9 10 11 12 13 14 15 16 17 18 19 20 21 22 23 24 25 26 27 28 29 30 31 32 33 34 35 36 37 38 39 40 41 42 43 44 |
| Pathway ID | Tissue | Disease Stage | Description | Gene Ratio | Bg Ratio | pvalue | p.adjust | qvalue | Count |
| hsa0301810 | Esophagus | HGIN | RNA degradation | 27/1383 | 79/8465 | 7.73e-05 | 9.00e-04 | 7.15e-04 | 27 |
| hsa0301815 | Esophagus | HGIN | RNA degradation | 27/1383 | 79/8465 | 7.73e-05 | 9.00e-04 | 7.15e-04 | 27 |
| hsa03018 | Liver | Cirrhotic | RNA degradation | 44/2530 | 79/8465 | 1.43e-06 | 1.65e-05 | 1.02e-05 | 44 |
| hsa030181 | Liver | Cirrhotic | RNA degradation | 44/2530 | 79/8465 | 1.43e-06 | 1.65e-05 | 1.02e-05 | 44 |
| hsa030182 | Liver | HCC | RNA degradation | 58/4020 | 79/8465 | 2.29e-06 | 2.19e-05 | 1.22e-05 | 58 |
| hsa030183 | Liver | HCC | RNA degradation | 58/4020 | 79/8465 | 2.29e-06 | 2.19e-05 | 1.22e-05 | 58 |
| hsa030189 | Oral cavity | OSCC | RNA degradation | 59/3704 | 79/8465 | 2.05e-08 | 1.91e-07 | 9.70e-08 | 59 |
| hsa0301814 | Oral cavity | OSCC | RNA degradation | 59/3704 | 79/8465 | 2.05e-08 | 1.91e-07 | 9.70e-08 | 59 |
| hsa0301823 | Oral cavity | LP | RNA degradation | 39/2418 | 79/8465 | 6.98e-05 | 4.38e-04 | 2.83e-04 | 39 |
| hsa0301833 | Oral cavity | LP | RNA degradation | 39/2418 | 79/8465 | 6.98e-05 | 4.38e-04 | 2.83e-04 | 39 |
| Page: 1 |
Top |
Cell-cell communication analysis |
| Identification of potential cell-cell interactions between two cell types and their ligand-receptor pairs for different disease states |
| Ligand | Receptor | LRpair | Pathway | Tissue | Disease Stage |
| Page: 1 |
Top |
Single-cell gene regulatory network inference analysis |
| Find out the significant the regulons (TFs) and the target genes of each regulon across cell types for different disease states |
| TF | Cell Type | Tissue | Disease Stage | Target Gene | RSS | Regulon Activity |
| ∗The dot plots of a searched regulon are shown for all cell subpopulations in each disease state of each tissue based on the regulon specific score inferred using pySCENIC and by calculating the average expression. |
| Page: 1 |
Top |
Somatic mutation of malignant transformation related genes |
| Annotation of somatic variants for genes involved in malignant transformation |
| Hugo Symbol | Variant Class | Variant Classification | dbSNP RS | HGVSc | HGVSp | HGVSp Short | SWISSPROT | BIOTYPE | SIFT | PolyPhen | Tumor Sample Barcode | Tissue | Histology | Sex | Age | Stage | Therapy Types | Drugs | Outcome |
| C1D | SNV | Missense_Mutation | c.109T>C | p.Ser37Pro | p.S37P | Q13901 | protein_coding | deleterious(0.02) | possibly_damaging(0.798) | TCGA-AA-3510-01 | Colorectum | colon adenocarcinoma | Male | >=65 | I/II | Unknown | Unknown | SD | |
| C1D | SNV | Missense_Mutation | c.7N>A | p.Gly3Ser | p.G3S | Q13901 | protein_coding | tolerated(0.9) | benign(0) | TCGA-AZ-6607-01 | Colorectum | colon adenocarcinoma | Male | >=65 | III/IV | Unknown | Unknown | PD | |
| C1D | SNV | Missense_Mutation | c.32N>T | p.Pro11Leu | p.P11L | Q13901 | protein_coding | deleterious(0) | possibly_damaging(0.661) | TCGA-DM-A28F-01 | Colorectum | colon adenocarcinoma | Male | >=65 | III/IV | Unknown | Unknown | SD | |
| C1D | SNV | Missense_Mutation | novel | c.4N>A | p.Ala2Thr | p.A2T | Q13901 | protein_coding | deleterious(0.04) | probably_damaging(0.976) | TCGA-A5-A0G2-01 | Endometrium | uterine corpus endometrioid carcinoma | Female | <65 | III/IV | Unknown | Unknown | SD |
| C1D | SNV | Missense_Mutation | c.192N>G | p.Asn64Lys | p.N64K | Q13901 | protein_coding | deleterious(0) | probably_damaging(0.927) | TCGA-AP-A0LM-01 | Endometrium | uterine corpus endometrioid carcinoma | Female | <65 | III/IV | Chemotherapy | cisplatin | SD | |
| C1D | SNV | Missense_Mutation | novel | c.305A>T | p.Asp102Val | p.D102V | Q13901 | protein_coding | deleterious(0) | benign(0.17) | TCGA-B5-A1MX-01 | Endometrium | uterine corpus endometrioid carcinoma | Female | <65 | I/II | Hormone Therapy | megace | SD |
| C1D | insertion | Frame_Shift_Ins | novel | c.222dupA | p.Gly75ArgfsTer3 | p.G75Rfs*3 | Q13901 | protein_coding | TCGA-B5-A1MX-01 | Endometrium | uterine corpus endometrioid carcinoma | Female | <65 | I/II | Hormone Therapy | megace | SD | ||
| C1D | insertion | Frame_Shift_Ins | rs776000138 | c.359_360insA | p.Asn120LysfsTer17 | p.N120Kfs*17 | Q13901 | protein_coding | TCGA-BK-A13B-01 | Endometrium | uterine corpus endometrioid carcinoma | Female | <65 | I/II | Unknown | Unknown | PD | ||
| C1D | SNV | Missense_Mutation | novel | c.403N>G | p.Asn135Asp | p.N135D | Q13901 | protein_coding | tolerated(0.3) | benign(0) | TCGA-L4-A4E5-01 | Lung | lung adenocarcinoma | Female | <65 | I/II | Unknown | Unknown | SD |
| C1D | SNV | Missense_Mutation | rs775915228 | c.27N>A | p.Asp9Glu | p.D9E | Q13901 | protein_coding | tolerated(0.37) | benign(0.017) | TCGA-CV-5979-01 | Oral cavity | head & neck squamous cell carcinoma | Male | <65 | I/II | Unknown | Unknown | SD |
| Page: 1 2 |
Top |
Related drugs of malignant transformation related genes |
| Identification of chemicals and drugs interact with genes involved in malignant transfromation |
| (DGIdb 4.0) |
| Entrez ID | Symbol | Category | Interaction Types | Drug Claim Name | Drug Name | PMIDs |
| Page: 1 |

Copyright 2023-Present -The University of Texas Health Science Center at Houston |