
|
|||||
|
 | |
| |
| |
| |
| |
| |
|
Gene: C19orf60 |
Gene summary for C19ORF60 |
| Gene information | Species | Human | Gene symbol | C19orf60 | Gene ID | 55049 |
| Gene name | required for excision 1-B domain containing | |
| Gene Alias | C19orf60 | |
| Cytomap | 19p13.11 | |
| Gene Type | protein-coding | GO ID | GO:0003674 | UniProtAcc | Q96EN9 |
Top |
Malignant transformation analysis |
| Identification of the aberrant gene expression in precancerous and cancerous lesions by comparing the gene expression of stem-like cells in diseased tissues with normal stem cells |
| Entrez ID | Symbol | Replicates | Species | Organ | Tissue | Adj P-value | Log2FC | Malignancy |
| 55049 | C19orf60 | LZE24T | Human | Esophagus | ESCC | 2.55e-02 | -1.85e-01 | 0.0596 |
| 55049 | C19orf60 | P1T-E | Human | Esophagus | ESCC | 1.07e-11 | 9.99e-01 | 0.0875 |
| 55049 | C19orf60 | P2T-E | Human | Esophagus | ESCC | 1.61e-38 | 7.90e-01 | 0.1177 |
| 55049 | C19orf60 | P4T-E | Human | Esophagus | ESCC | 5.53e-42 | 1.31e+00 | 0.1323 |
| 55049 | C19orf60 | P5T-E | Human | Esophagus | ESCC | 1.87e-71 | 1.56e+00 | 0.1327 |
| 55049 | C19orf60 | P8T-E | Human | Esophagus | ESCC | 6.35e-66 | 1.29e+00 | 0.0889 |
| 55049 | C19orf60 | P9T-E | Human | Esophagus | ESCC | 6.16e-52 | 1.49e+00 | 0.1131 |
| 55049 | C19orf60 | P10T-E | Human | Esophagus | ESCC | 3.70e-52 | 1.10e+00 | 0.116 |
| 55049 | C19orf60 | P11T-E | Human | Esophagus | ESCC | 4.29e-35 | 1.81e+00 | 0.1426 |
| 55049 | C19orf60 | P12T-E | Human | Esophagus | ESCC | 5.05e-32 | 5.86e-01 | 0.1122 |
| 55049 | C19orf60 | P15T-E | Human | Esophagus | ESCC | 9.42e-37 | 1.05e+00 | 0.1149 |
| 55049 | C19orf60 | P16T-E | Human | Esophagus | ESCC | 9.85e-33 | 7.05e-01 | 0.1153 |
| 55049 | C19orf60 | P17T-E | Human | Esophagus | ESCC | 8.40e-28 | 1.48e+00 | 0.1278 |
| 55049 | C19orf60 | P19T-E | Human | Esophagus | ESCC | 7.01e-13 | 1.72e+00 | 0.1662 |
| 55049 | C19orf60 | P20T-E | Human | Esophagus | ESCC | 6.43e-34 | 9.77e-01 | 0.1124 |
| 55049 | C19orf60 | P21T-E | Human | Esophagus | ESCC | 3.43e-69 | 1.36e+00 | 0.1617 |
| 55049 | C19orf60 | P22T-E | Human | Esophagus | ESCC | 3.77e-82 | 1.43e+00 | 0.1236 |
| 55049 | C19orf60 | P23T-E | Human | Esophagus | ESCC | 4.44e-59 | 1.68e+00 | 0.108 |
| 55049 | C19orf60 | P24T-E | Human | Esophagus | ESCC | 8.15e-43 | 9.77e-01 | 0.1287 |
| 55049 | C19orf60 | P26T-E | Human | Esophagus | ESCC | 2.30e-59 | 1.34e+00 | 0.1276 |
| Page: 1 2 3 4 5 6 7 |
| Tissue | Expression Dynamics | Abbreviation |
| Esophagus | 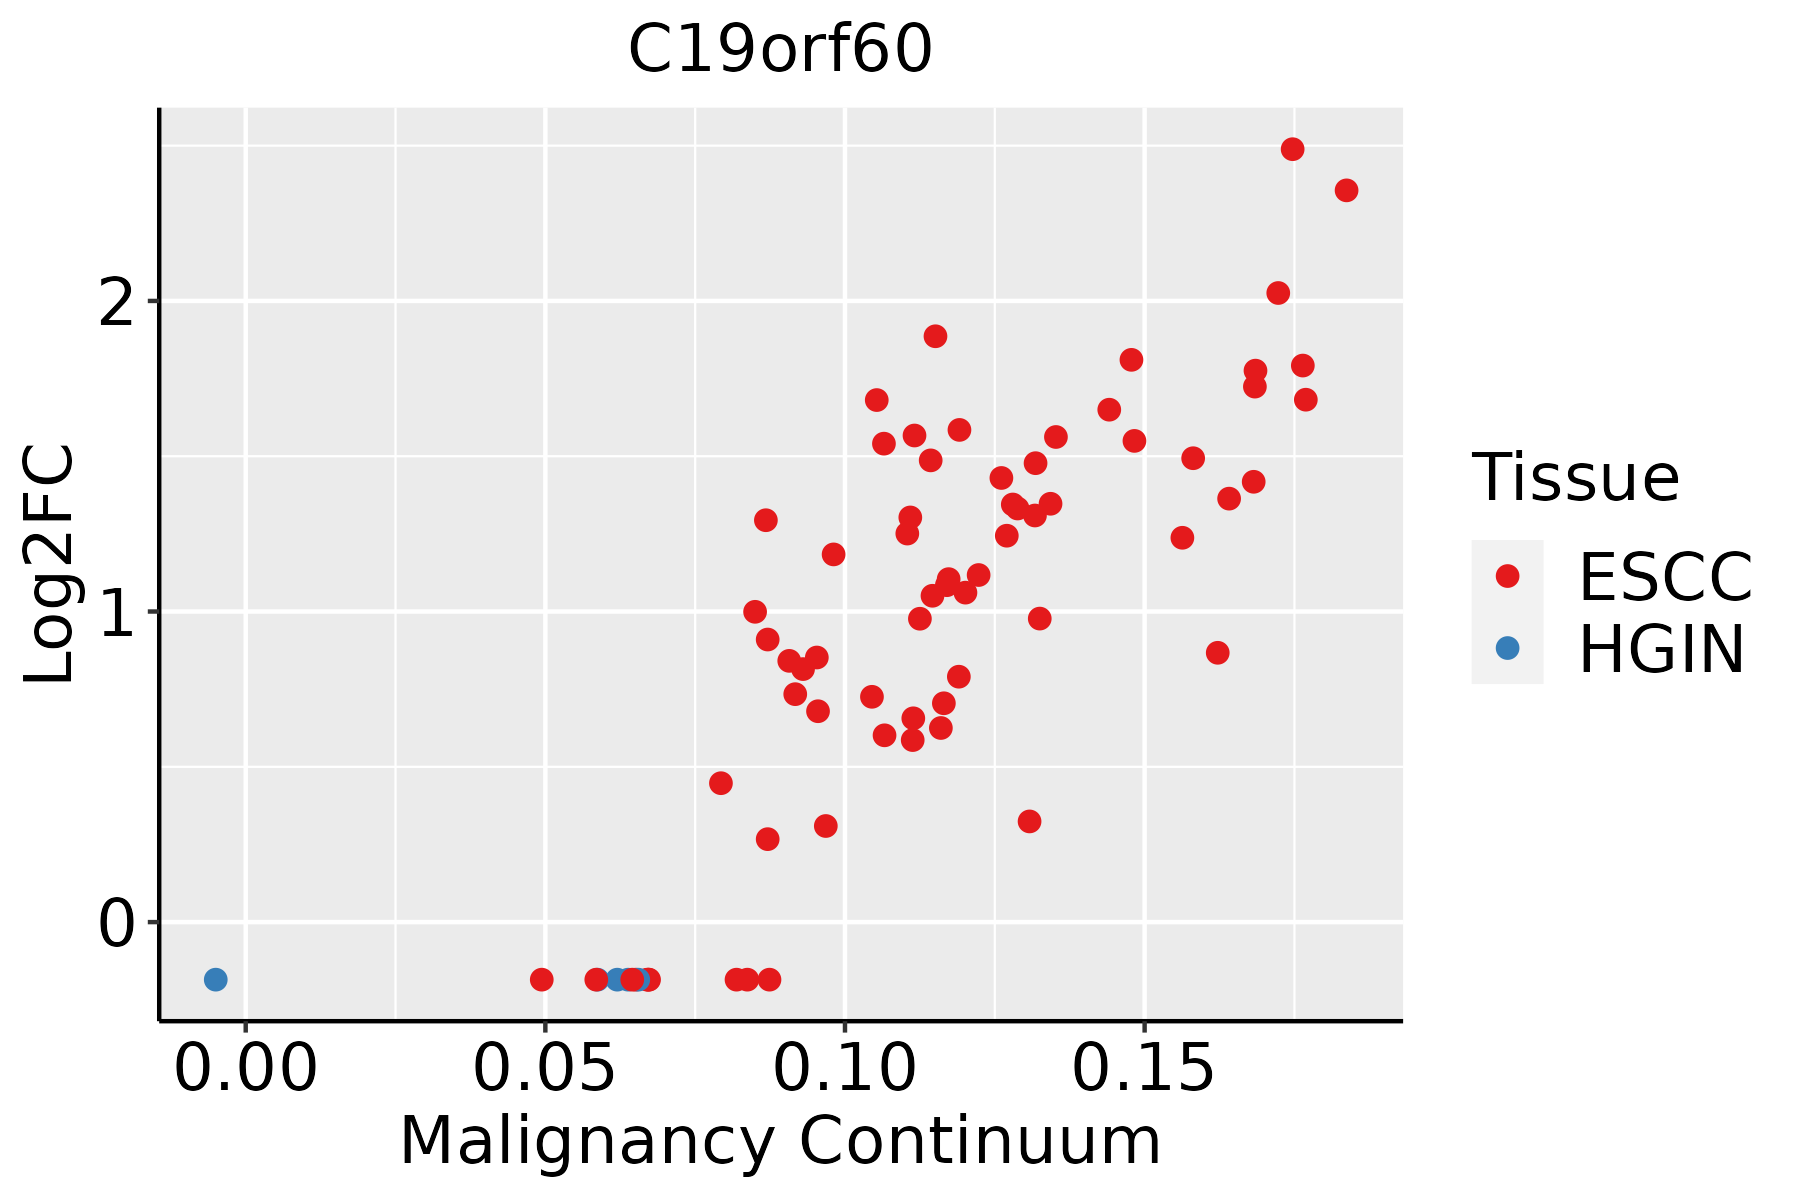 | ESCC: Esophageal squamous cell carcinoma |
| HGIN: High-grade intraepithelial neoplasias | ||
| LGIN: Low-grade intraepithelial neoplasias | ||
| Oral Cavity | 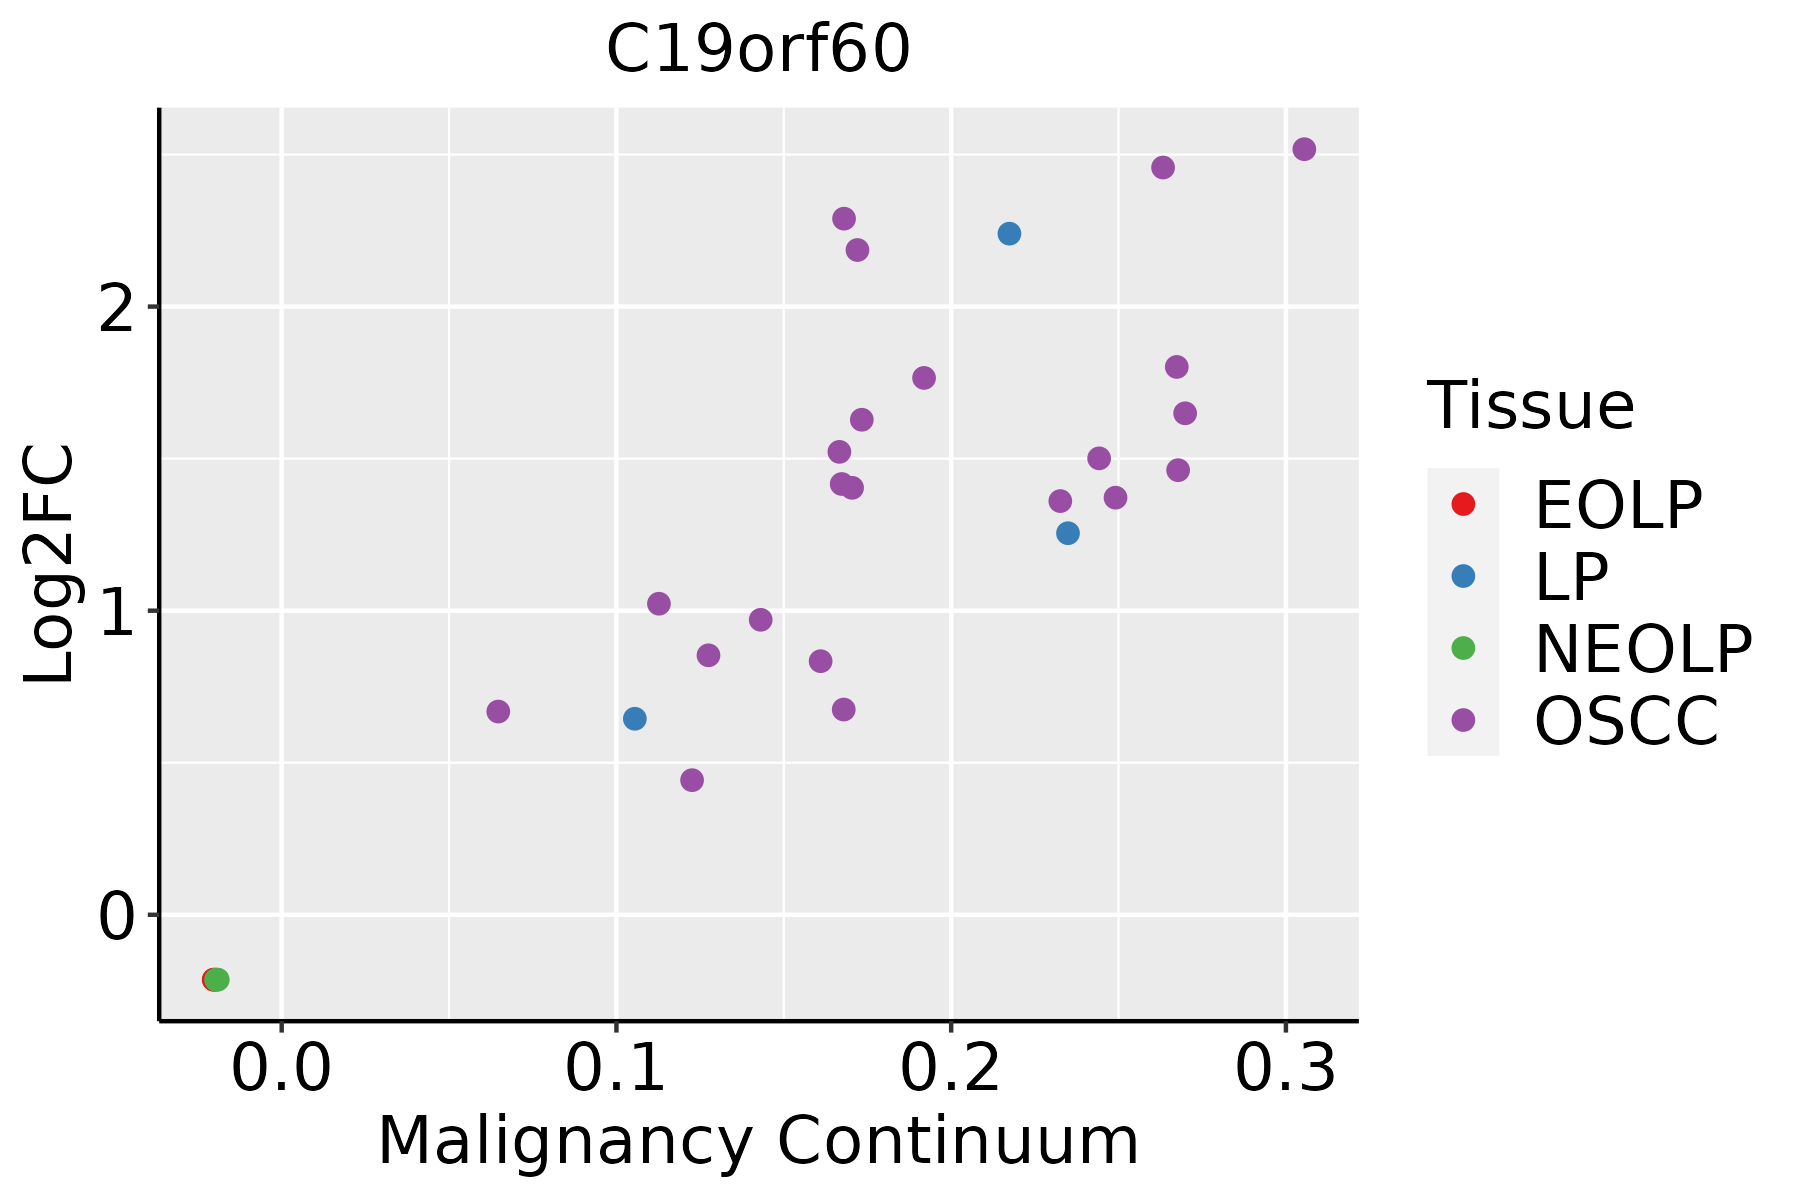 | EOLP: Erosive Oral lichen planus |
| LP: leukoplakia | ||
| NEOLP: Non-erosive oral lichen planus | ||
| OSCC: Oral squamous cell carcinoma | ||
| Prostate | 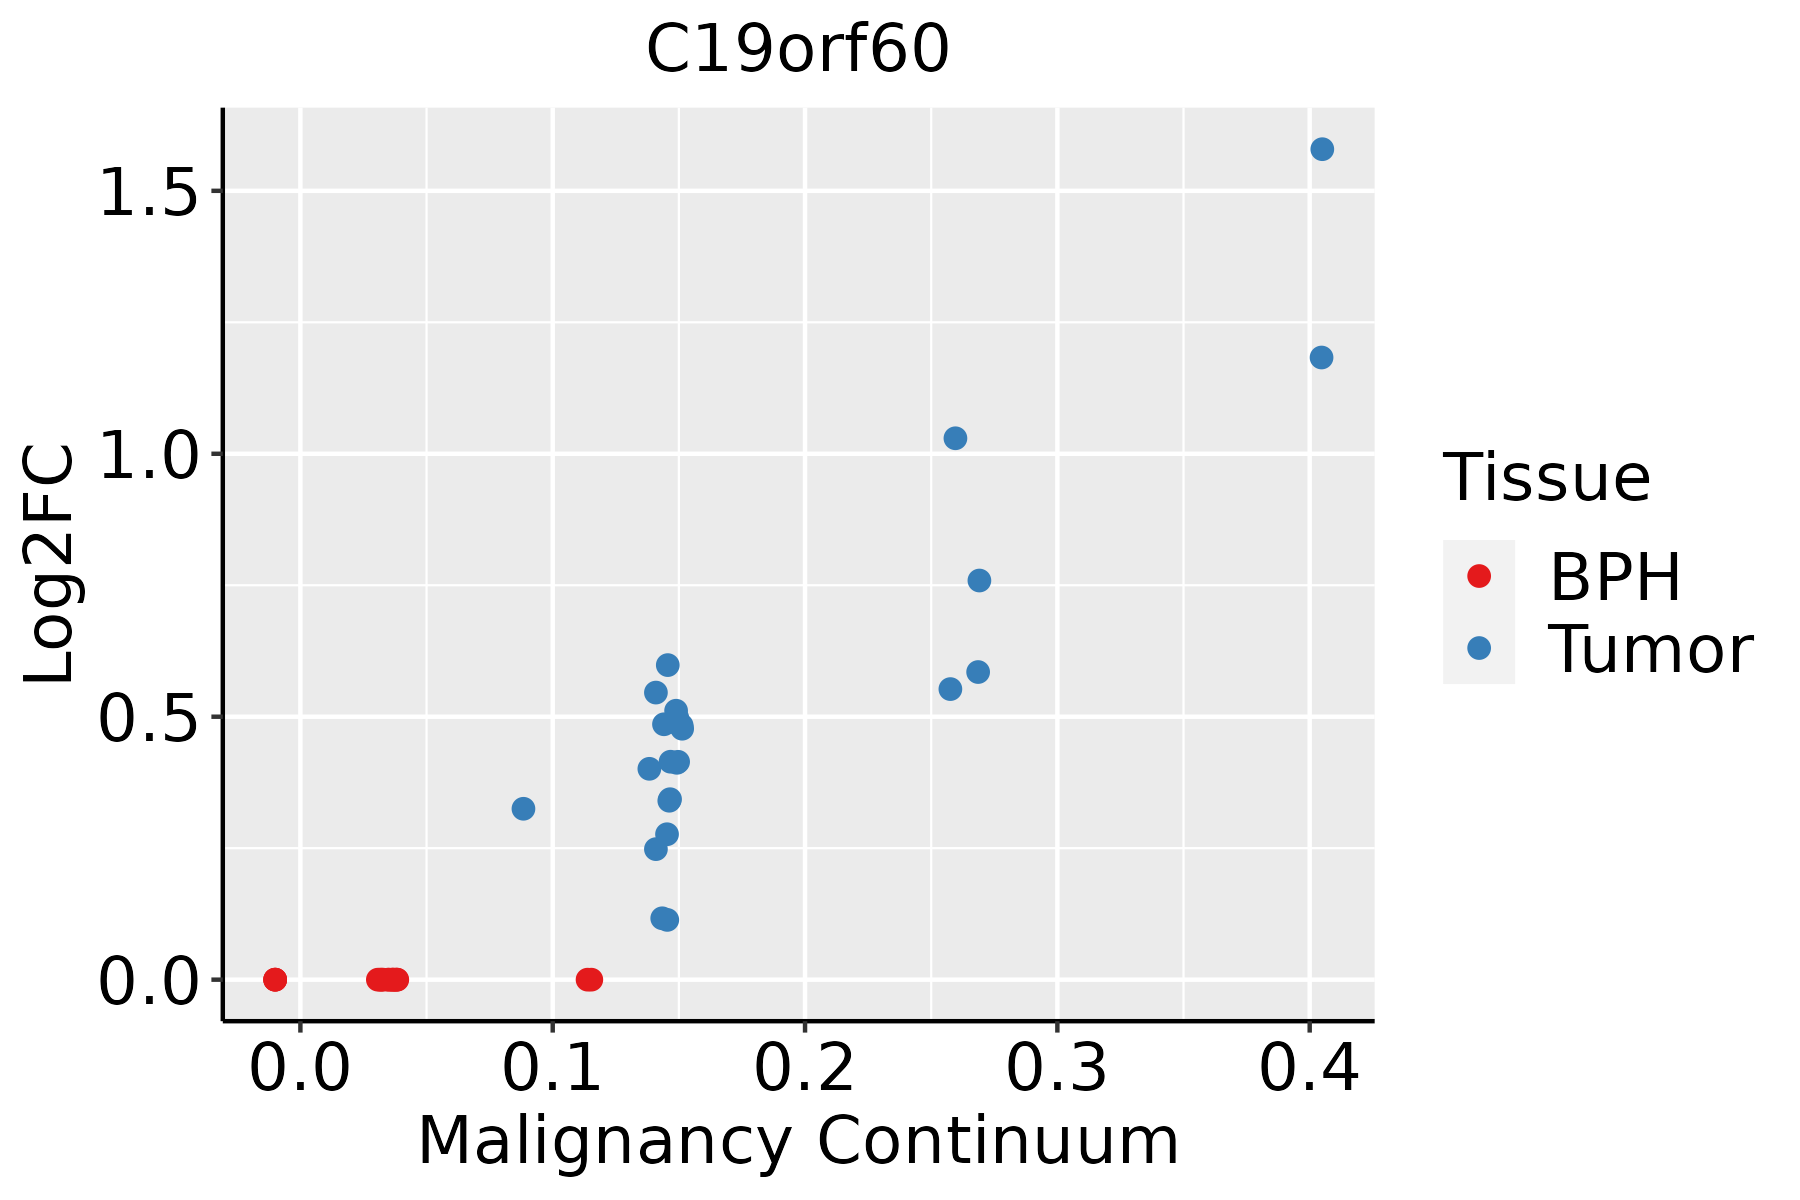 | BPH: Benign Prostatic Hyperplasia |
| Skin | 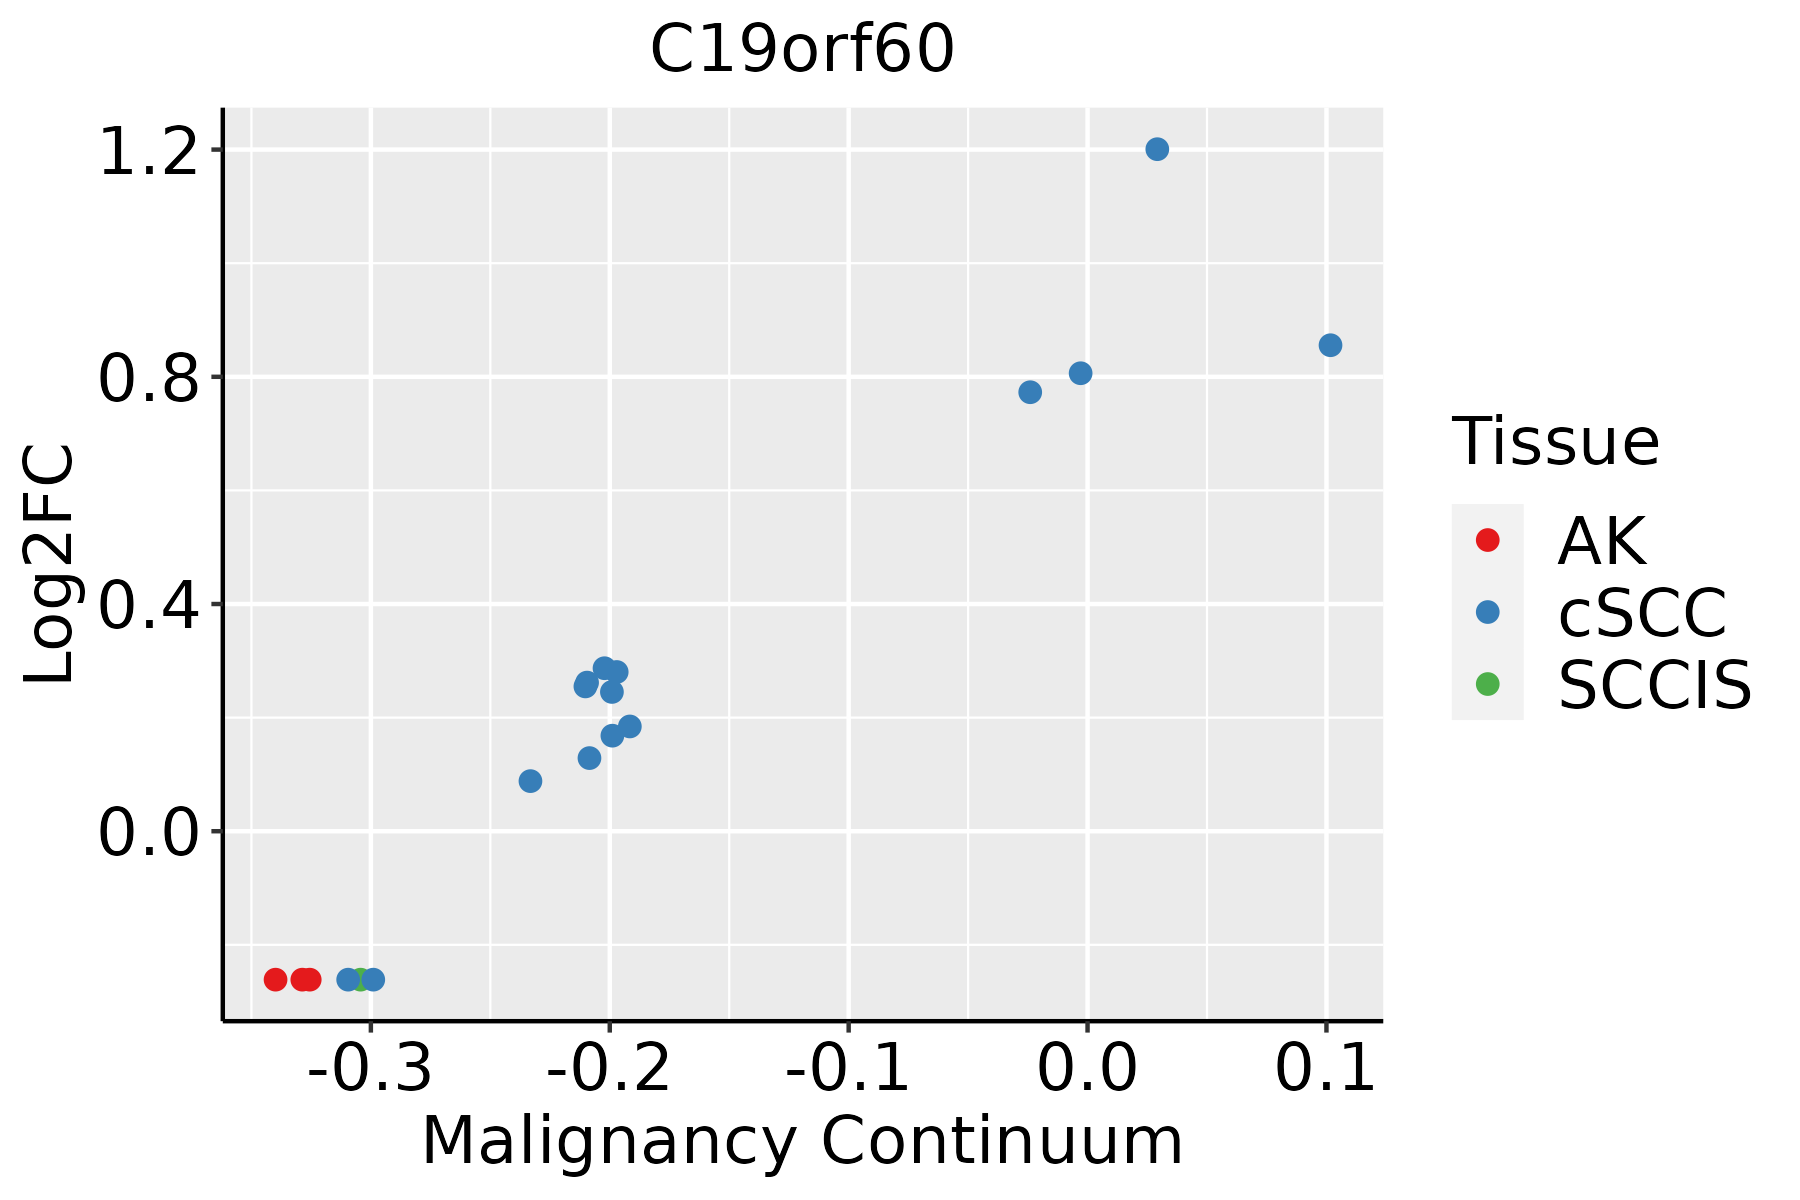 | AK: Actinic keratosis |
| cSCC: Cutaneous squamous cell carcinoma | ||
| SCCIS:squamous cell carcinoma in situ |
| ∗log2FC in expression of this searched gene in stem-like cells from each diseased tissue sample relative to stem-like cells in normal samples in each tissue plotted against the malignancy continuum. Samples are colored based on if they are from different disease stage. |
Top |
Malignant transformation related pathway analysis |
| Find out the enriched GO biological processes and KEGG pathways involved in transition from healthy to precancer to cancer |
| Tissue | Disease Stage | Enriched GO biological Processes |
| Colorectum | AD |  |
| Colorectum | SER |  |
| Colorectum | MSS |  |
| Colorectum | MSI-H |  |
| Colorectum | FAP |  |
| ∗Top 15 enriched GO BP terms are showed in the bar plot of each disease state in each tissue. Each row represents a significant GO biological process which is colored according to the -log10(p.adjust). |
| Page: 1 2 3 4 5 6 7 8 9 |
| GO ID | Tissue | Disease Stage | Description | Gene Ratio | Bg Ratio | pvalue | p.adjust | Count |
| Page: 1 |
| Pathway ID | Tissue | Disease Stage | Description | Gene Ratio | Bg Ratio | pvalue | p.adjust | qvalue | Count |
| Page: 1 |
Top |
Cell-cell communication analysis |
| Identification of potential cell-cell interactions between two cell types and their ligand-receptor pairs for different disease states |
| Ligand | Receptor | LRpair | Pathway | Tissue | Disease Stage |
| Page: 1 |
Top |
Single-cell gene regulatory network inference analysis |
| Find out the significant the regulons (TFs) and the target genes of each regulon across cell types for different disease states |
| TF | Cell Type | Tissue | Disease Stage | Target Gene | RSS | Regulon Activity |
| ∗The dot plots of a searched regulon are shown for all cell subpopulations in each disease state of each tissue based on the regulon specific score inferred using pySCENIC and by calculating the average expression. |
| Page: 1 |
Top |
Somatic mutation of malignant transformation related genes |
| Annotation of somatic variants for genes involved in malignant transformation |
| Hugo Symbol | Variant Class | Variant Classification | dbSNP RS | HGVSc | HGVSp | HGVSp Short | SWISSPROT | BIOTYPE | SIFT | PolyPhen | Tumor Sample Barcode | Tissue | Histology | Sex | Age | Stage | Therapy Types | Drugs | Outcome |
| C19orf60 | SNV | Missense_Mutation | novel | c.344N>G | p.Ser115Trp | p.S115W | Q96EN9 | protein_coding | deleterious(0) | probably_damaging(0.999) | TCGA-A2-A4RW-01 | Breast | breast invasive carcinoma | Female | <65 | III/IV | Unknown | Unknown | SD |
| C19orf60 | SNV | Missense_Mutation | c.203N>A | p.Gly68Asp | p.G68D | Q96EN9 | protein_coding | deleterious_low_confidence(0) | benign(0.001) | TCGA-CK-5916-01 | Colorectum | colon adenocarcinoma | Female | >=65 | I/II | Unknown | Unknown | PD | |
| C19orf60 | SNV | Missense_Mutation | novel | c.223N>T | p.Gly75Cys | p.G75C | Q96EN9 | protein_coding | tolerated_low_confidence(0.08) | benign(0.01) | TCGA-D1-A1NY-01 | Endometrium | uterine corpus endometrioid carcinoma | Female | >=65 | I/II | Chemotherapy | carboplatin | SD |
| C19orf60 | deletion | Frame_Shift_Del | novel | c.219delG | p.Arg74AlafsTer34 | p.R74Afs*34 | Q96EN9 | protein_coding | TCGA-AJ-A3BH-01 | Endometrium | uterine corpus endometrioid carcinoma | Female | Unknown | I/II | Unknown | Unknown | SD | ||
| C19orf60 | SNV | Missense_Mutation | novel | c.594N>T | p.Glu198Asp | p.E198D | Q96EN9 | protein_coding | deleterious(0.02) | probably_damaging(0.994) | TCGA-VQ-AA6D-01 | Stomach | stomach adenocarcinoma | Female | <65 | III/IV | Chemotherapy | fluorouracil | CR |
| C19orf60 | SNV | Missense_Mutation | c.511N>T | p.Arg171Trp | p.R171W | Q96EN9 | protein_coding | deleterious(0) | possibly_damaging(0.533) | TCGA-DJ-A2Q3-01 | Thyroid | thyroid carcinoma | Female | <65 | III/IV | Unknown | Unknown | PD |
| Page: 1 |
Top |
Related drugs of malignant transformation related genes |
| Identification of chemicals and drugs interact with genes involved in malignant transfromation |
| (DGIdb 4.0) |
| Entrez ID | Symbol | Category | Interaction Types | Drug Claim Name | Drug Name | PMIDs |
| Page: 1 |

Copyright 2023-Present -The University of Texas Health Science Center at Houston |