
|
|||||
|
 | |
| |
| |
| |
| |
| |
|
Gene: C19orf48 |
Gene summary for C19ORF48 |
| Gene information | Species | Human | Gene symbol | C19orf48 | Gene ID | 84798 |
| Gene name | multidrug resistance-related protein | |
| Gene Alias | CA916798 | |
| Cytomap | 19q13.33 | |
| Gene Type | pseudo | GO ID | NA | UniProtAcc | NA |
Top |
Malignant transformation analysis |
| Identification of the aberrant gene expression in precancerous and cancerous lesions by comparing the gene expression of stem-like cells in diseased tissues with normal stem cells |
| Entrez ID | Symbol | Replicates | Species | Organ | Tissue | Adj P-value | Log2FC | Malignancy |
| 84798 | C19orf48 | AEH-subject1 | Human | Endometrium | AEH | 2.12e-03 | -2.05e-01 | -0.3059 |
| 84798 | C19orf48 | AEH-subject2 | Human | Endometrium | AEH | 9.04e-04 | -1.89e-01 | -0.2525 |
| 84798 | C19orf48 | AEH-subject3 | Human | Endometrium | AEH | 1.85e-02 | -1.81e-01 | -0.2576 |
| 84798 | C19orf48 | AEH-subject4 | Human | Endometrium | AEH | 3.20e-04 | -2.53e-01 | -0.2657 |
| 84798 | C19orf48 | AEH-subject5 | Human | Endometrium | AEH | 1.10e-13 | -4.32e-01 | -0.2953 |
| 84798 | C19orf48 | EEC-subject1 | Human | Endometrium | EEC | 7.04e-06 | -2.53e-01 | -0.2682 |
| 84798 | C19orf48 | EEC-subject3 | Human | Endometrium | EEC | 1.61e-13 | -3.88e-01 | -0.2525 |
| 84798 | C19orf48 | EEC-subject4 | Human | Endometrium | EEC | 1.76e-10 | -3.92e-01 | -0.2571 |
| 84798 | C19orf48 | EEC-subject5 | Human | Endometrium | EEC | 8.60e-03 | -2.18e-01 | -0.249 |
| 84798 | C19orf48 | GSM5276934 | Human | Endometrium | EEC | 6.46e-09 | -3.44e-01 | -0.0913 |
| 84798 | C19orf48 | GSM5276935 | Human | Endometrium | EEC | 6.76e-05 | -3.18e-01 | -0.123 |
| 84798 | C19orf48 | GSM6177620_NYU_UCEC1_lib1_lib1 | Human | Endometrium | EEC | 3.29e-20 | -2.76e-01 | -0.1869 |
| 84798 | C19orf48 | GSM6177620_NYU_UCEC1_lib2_lib2 | Human | Endometrium | EEC | 2.12e-22 | -3.46e-01 | -0.1875 |
| 84798 | C19orf48 | GSM6177620_NYU_UCEC1_lib3_lib3 | Human | Endometrium | EEC | 1.05e-20 | -3.03e-01 | -0.1883 |
| 84798 | C19orf48 | GSM6177621_NYU_UCEC2_lib1_lib1 | Human | Endometrium | EEC | 6.70e-22 | -4.20e-01 | -0.1934 |
| 84798 | C19orf48 | GSM6177622_NYU_UCEC3_lib1_lib1 | Human | Endometrium | EEC | 4.32e-24 | -3.47e-01 | -0.1917 |
| 84798 | C19orf48 | GSM6177622_NYU_UCEC3_lib2_lib2 | Human | Endometrium | EEC | 5.49e-28 | -3.44e-01 | -0.1916 |
| 84798 | C19orf48 | LZE2T | Human | Esophagus | ESCC | 4.38e-04 | 3.08e-01 | 0.082 |
| 84798 | C19orf48 | LZE4T | Human | Esophagus | ESCC | 7.98e-08 | 1.47e-01 | 0.0811 |
| 84798 | C19orf48 | LZE7T | Human | Esophagus | ESCC | 5.48e-09 | 4.67e-01 | 0.0667 |
| Page: 1 2 3 4 5 6 7 |
| Tissue | Expression Dynamics | Abbreviation |
| Endometrium |  | AEH: Atypical endometrial hyperplasia |
| EEC: Endometrioid Cancer | ||
| Esophagus | 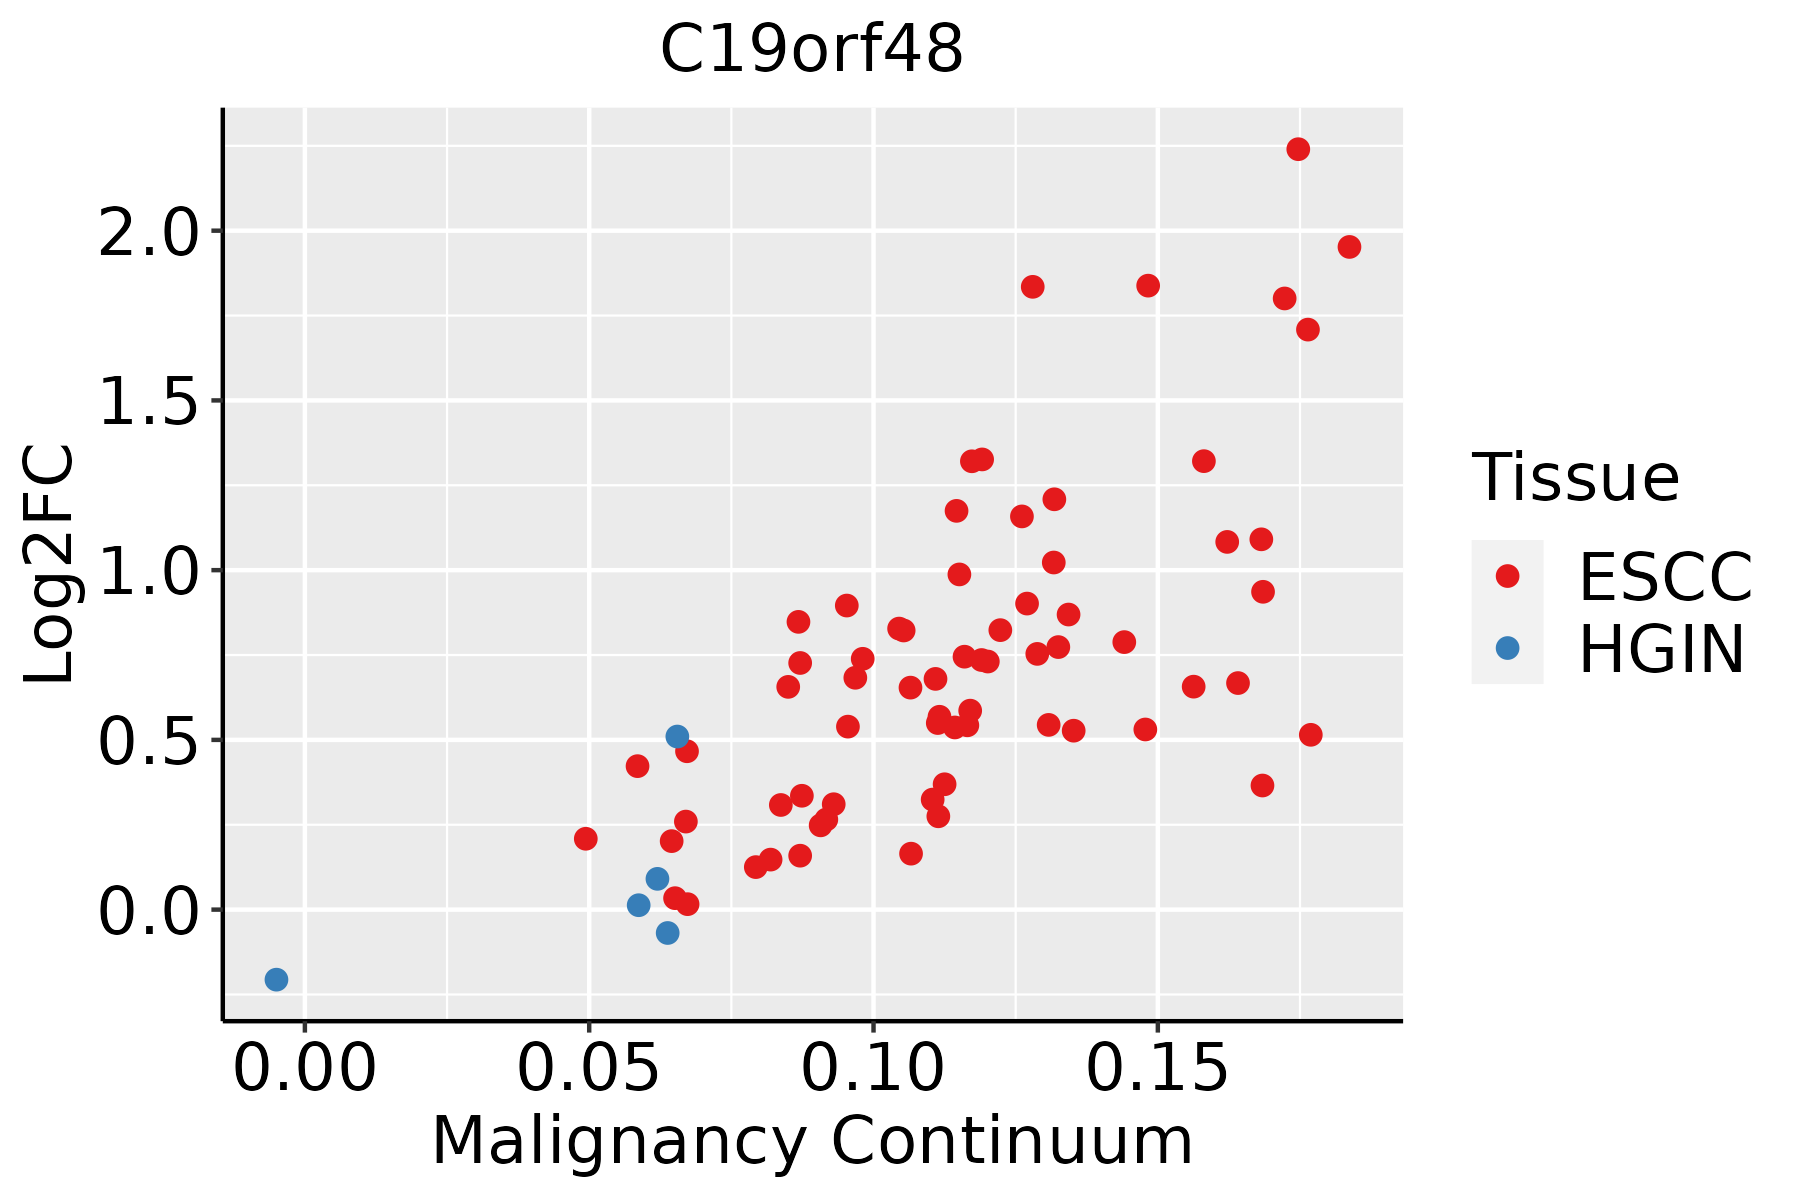 | ESCC: Esophageal squamous cell carcinoma |
| HGIN: High-grade intraepithelial neoplasias | ||
| LGIN: Low-grade intraepithelial neoplasias | ||
| Liver | 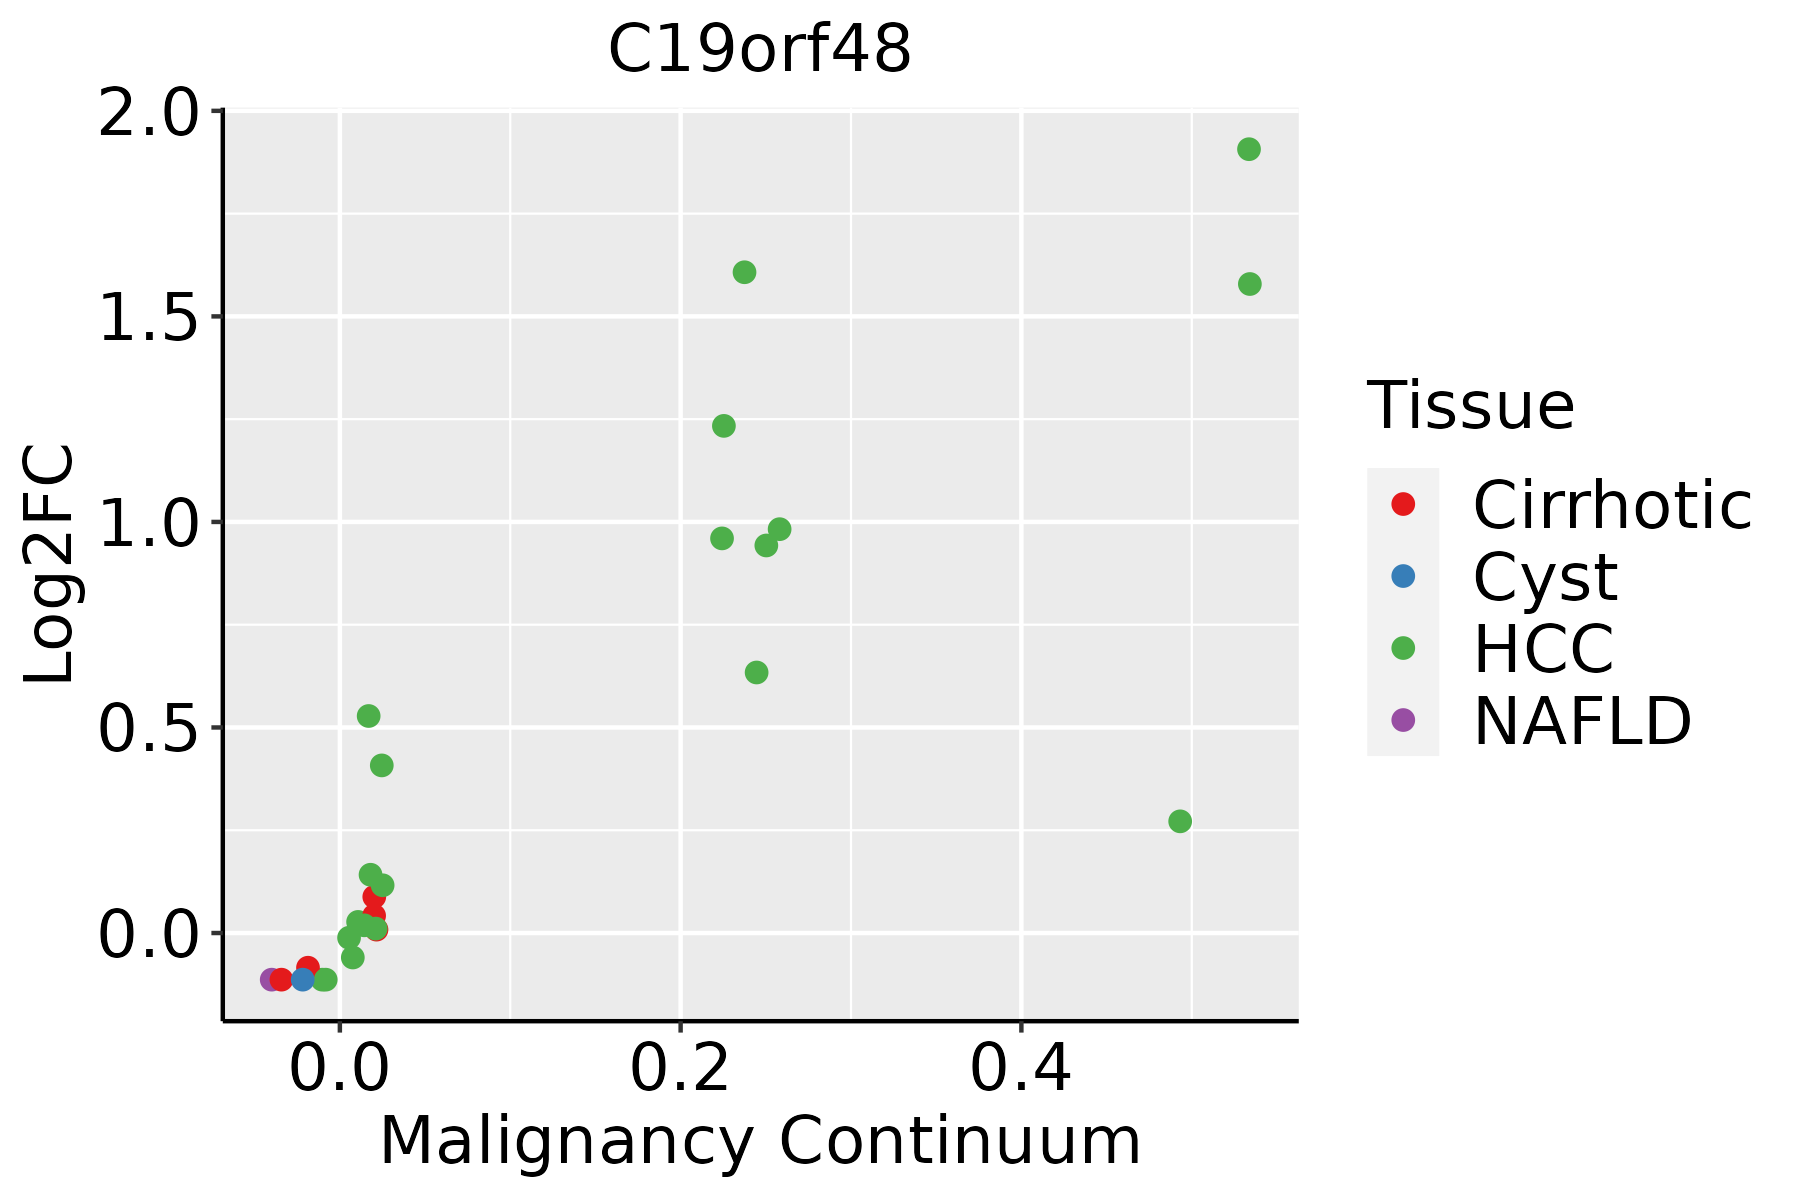 | HCC: Hepatocellular carcinoma |
| NAFLD: Non-alcoholic fatty liver disease | ||
| Lung | 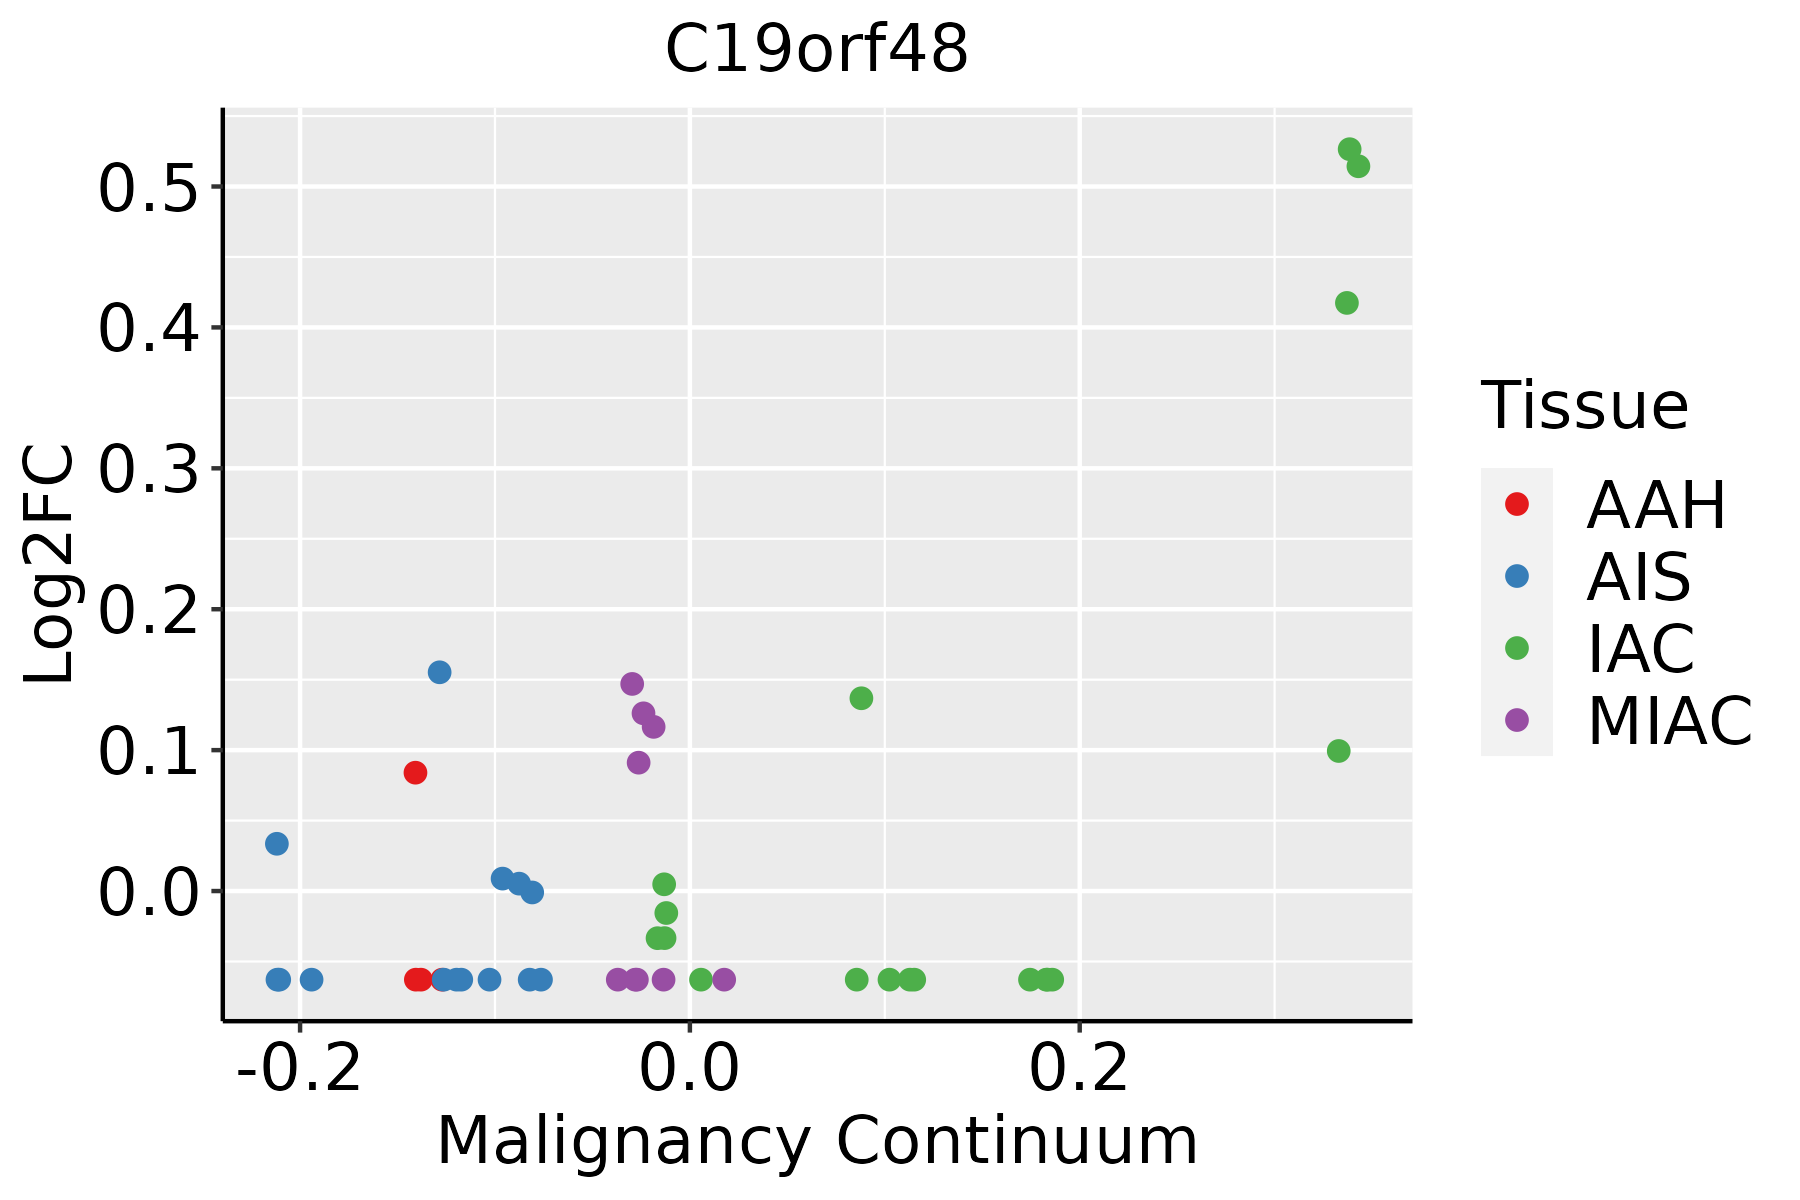 | AAH: Atypical adenomatous hyperplasia |
| AIS: Adenocarcinoma in situ | ||
| IAC: Invasive lung adenocarcinoma | ||
| MIA: Minimally invasive adenocarcinoma | ||
| Oral Cavity | 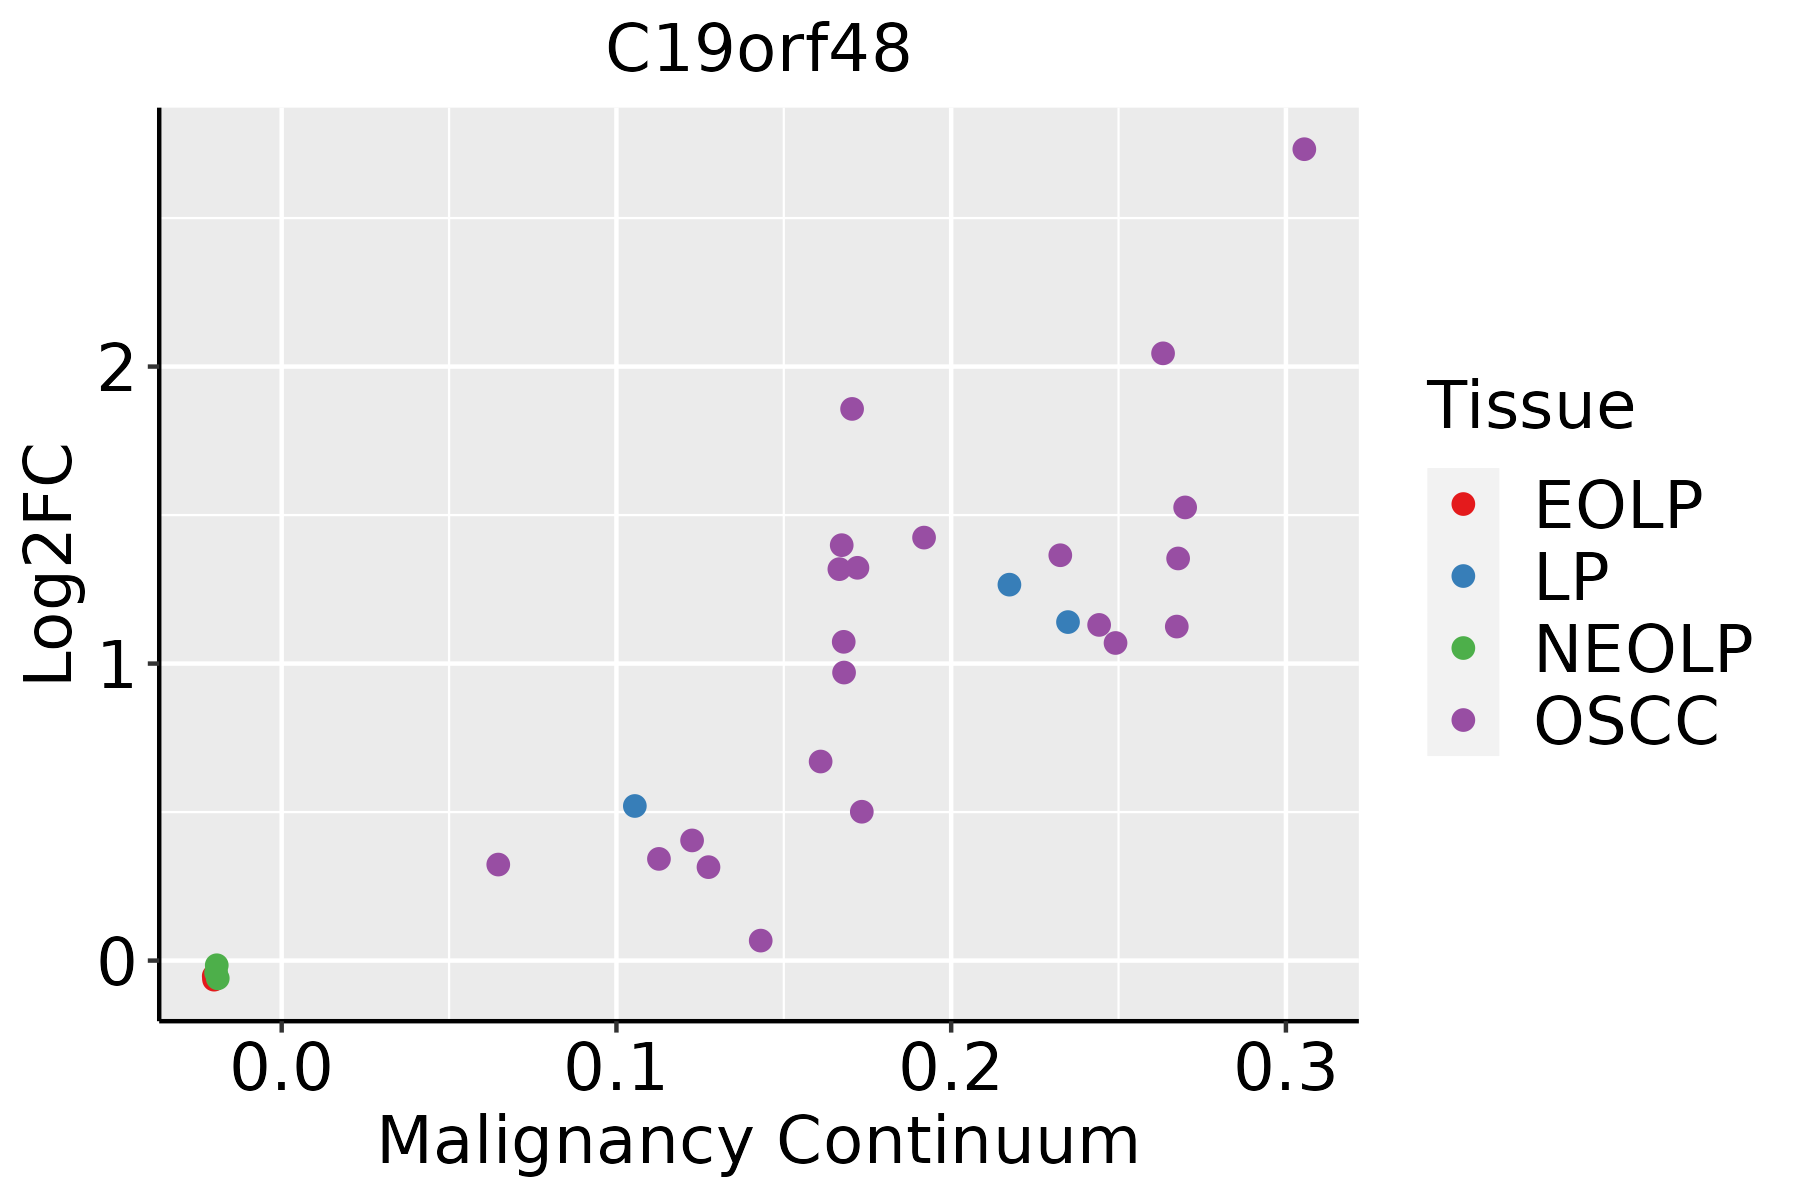 | EOLP: Erosive Oral lichen planus |
| LP: leukoplakia | ||
| NEOLP: Non-erosive oral lichen planus | ||
| OSCC: Oral squamous cell carcinoma | ||
| Prostate | 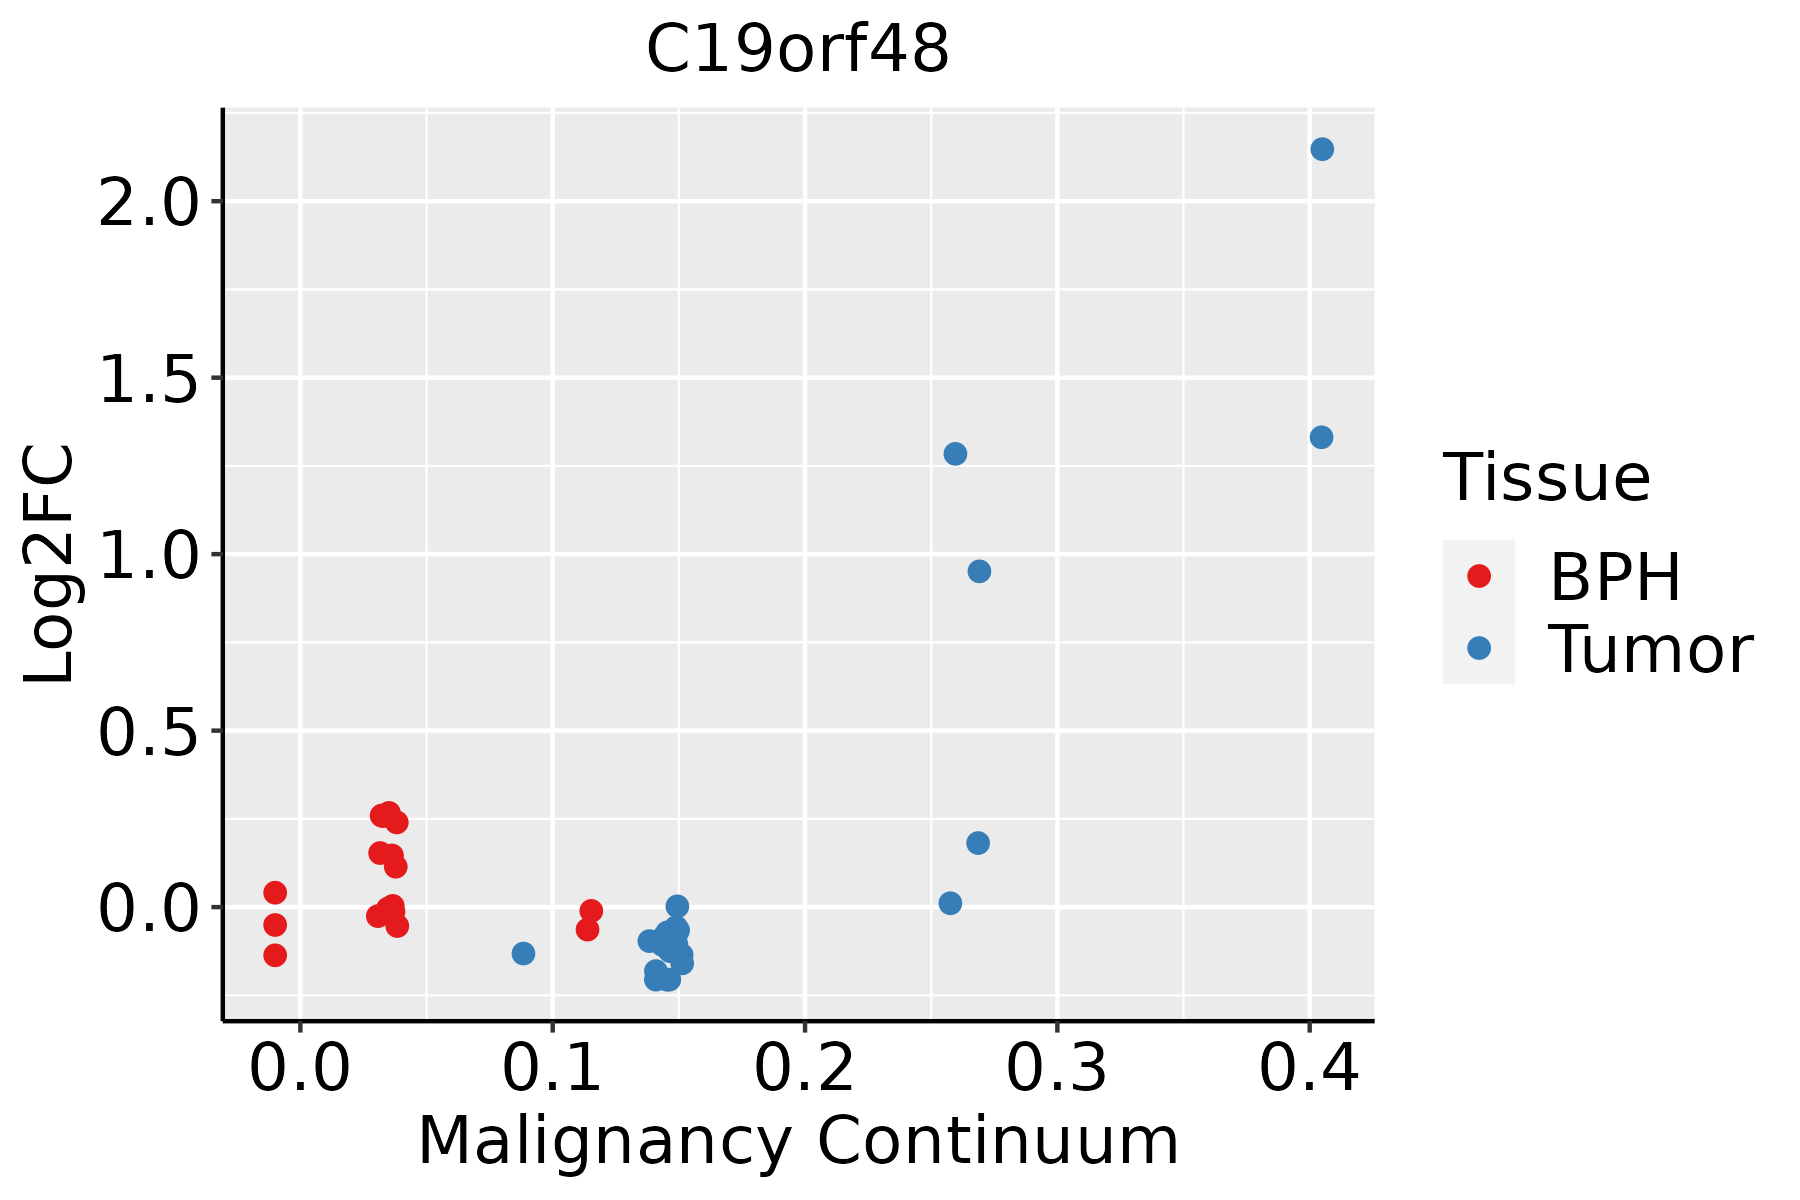 | BPH: Benign Prostatic Hyperplasia |
| Skin | 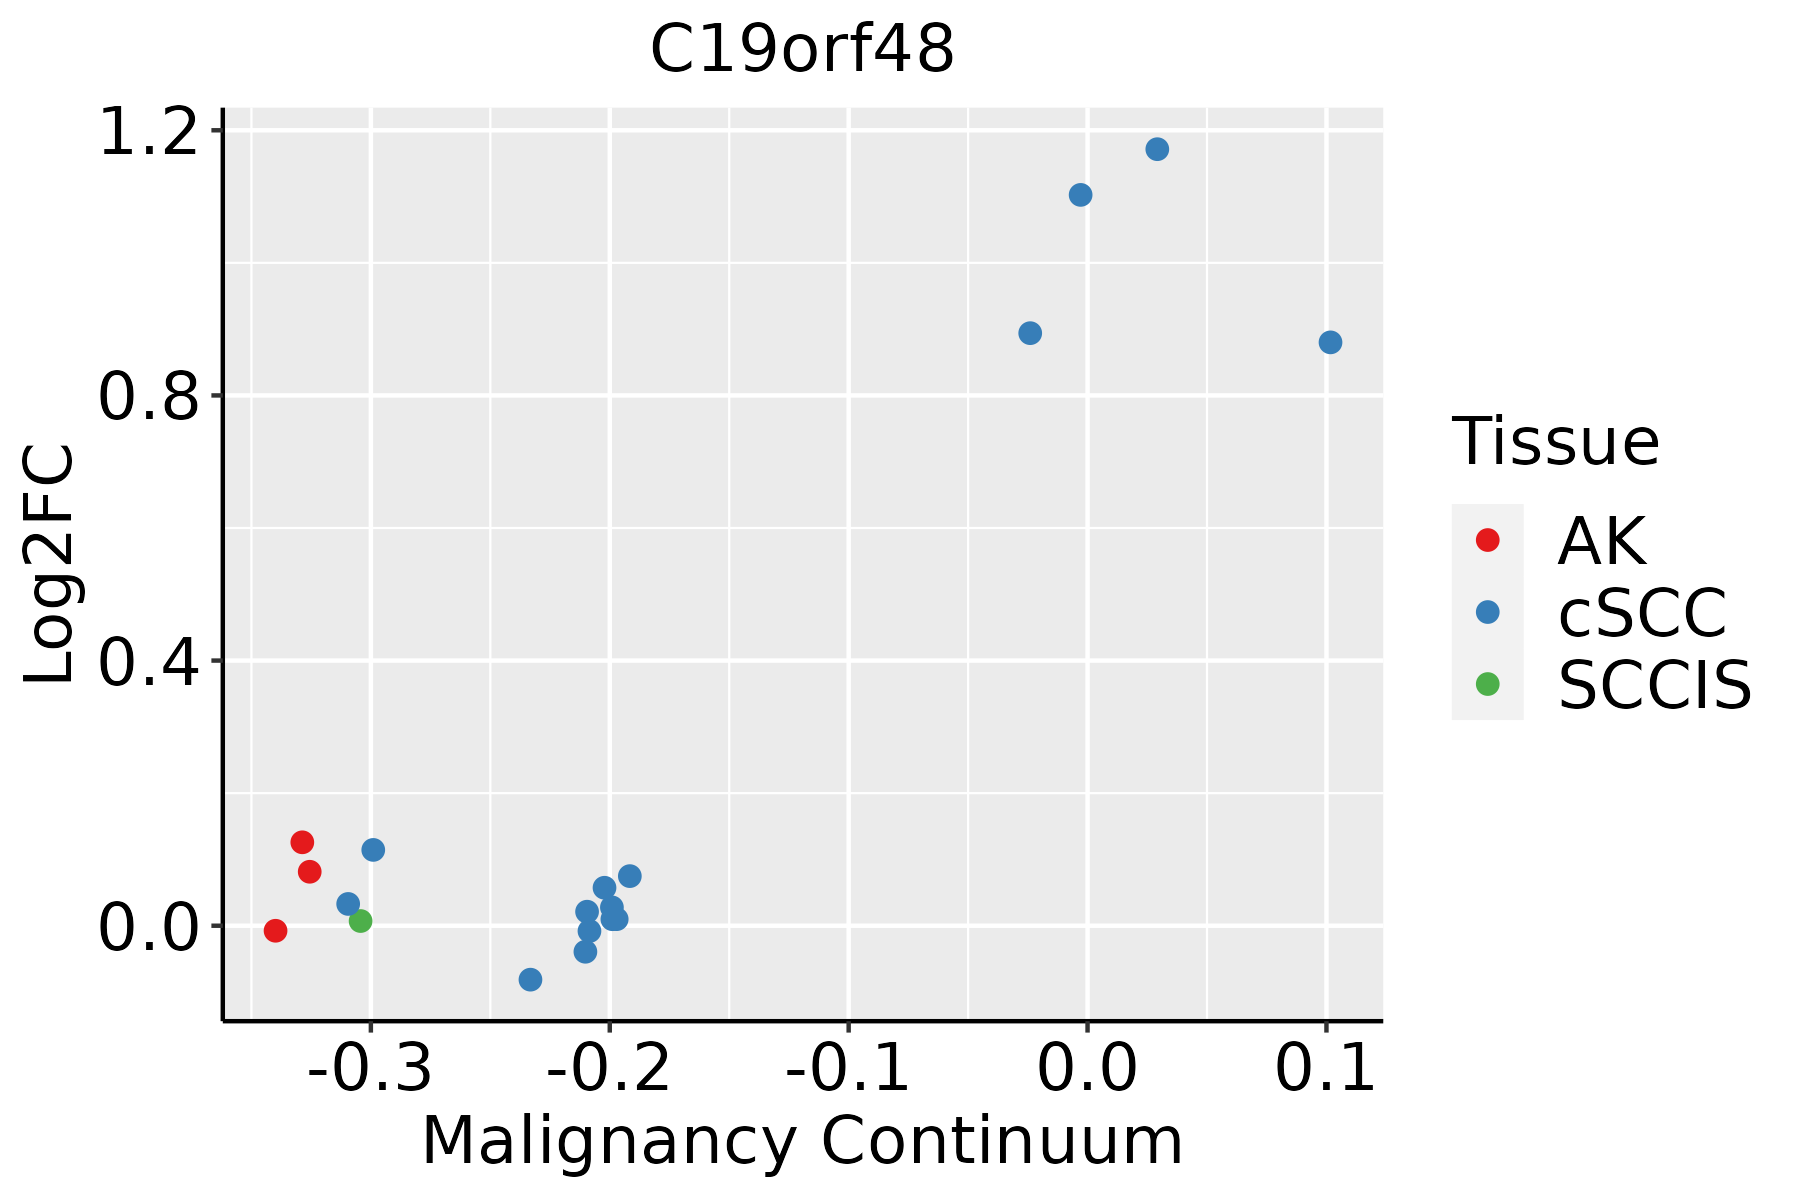 | AK: Actinic keratosis |
| cSCC: Cutaneous squamous cell carcinoma | ||
| SCCIS:squamous cell carcinoma in situ | ||
| Thyroid | 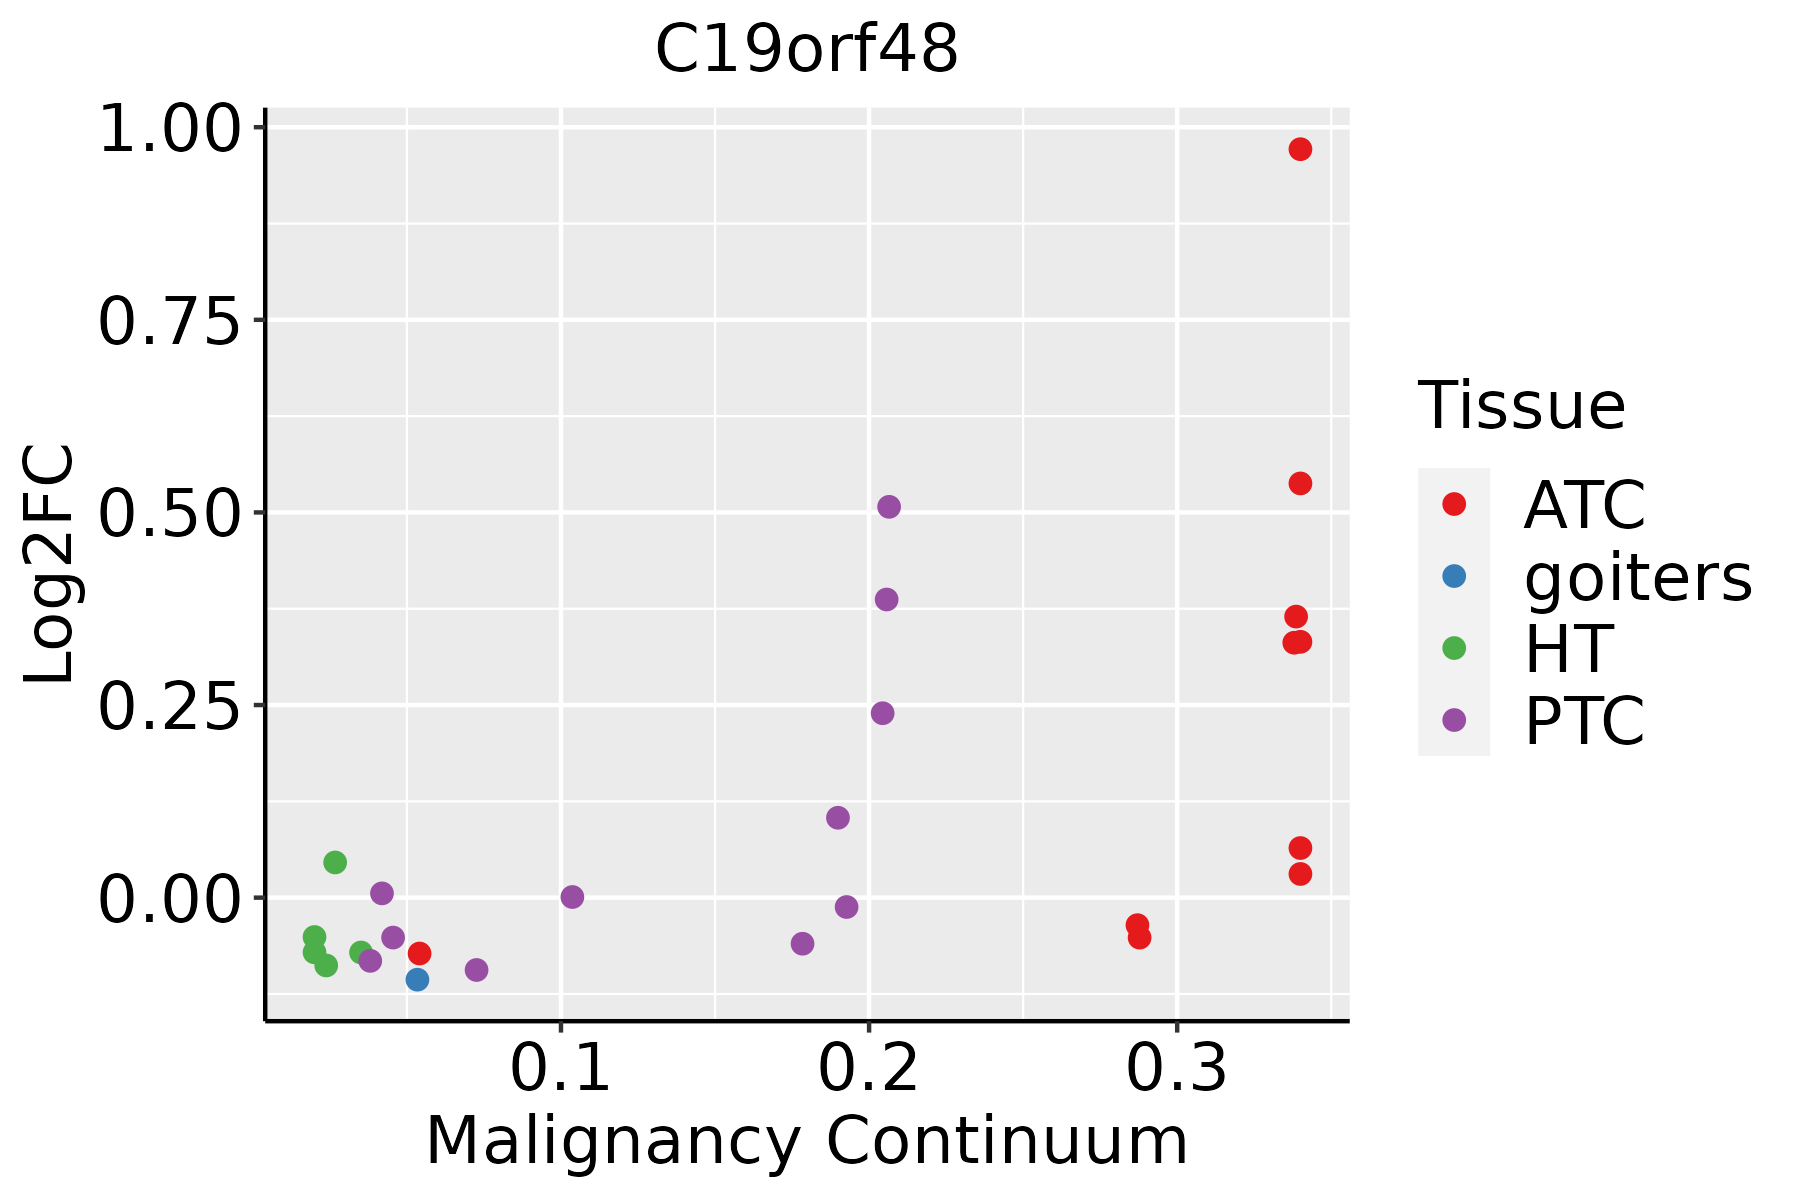 | ATC: Anaplastic thyroid cancer |
| HT: Hashimoto's thyroiditis | ||
| PTC: Papillary thyroid cancer |
| ∗log2FC in expression of this searched gene in stem-like cells from each diseased tissue sample relative to stem-like cells in normal samples in each tissue plotted against the malignancy continuum. Samples are colored based on if they are from different disease stage. |
Top |
Malignant transformation related pathway analysis |
| Find out the enriched GO biological processes and KEGG pathways involved in transition from healthy to precancer to cancer |
| Tissue | Disease Stage | Enriched GO biological Processes |
| Colorectum | AD |  |
| Colorectum | SER |  |
| Colorectum | MSS |  |
| Colorectum | MSI-H |  |
| Colorectum | FAP |  |
| ∗Top 15 enriched GO BP terms are showed in the bar plot of each disease state in each tissue. Each row represents a significant GO biological process which is colored according to the -log10(p.adjust). |
| Page: 1 2 3 4 5 6 7 8 9 |
| GO ID | Tissue | Disease Stage | Description | Gene Ratio | Bg Ratio | pvalue | p.adjust | Count |
| Page: 1 |
| Pathway ID | Tissue | Disease Stage | Description | Gene Ratio | Bg Ratio | pvalue | p.adjust | qvalue | Count |
| Page: 1 |
Top |
Cell-cell communication analysis |
| Identification of potential cell-cell interactions between two cell types and their ligand-receptor pairs for different disease states |
| Ligand | Receptor | LRpair | Pathway | Tissue | Disease Stage |
| Page: 1 |
Top |
Single-cell gene regulatory network inference analysis |
| Find out the significant the regulons (TFs) and the target genes of each regulon across cell types for different disease states |
| TF | Cell Type | Tissue | Disease Stage | Target Gene | RSS | Regulon Activity |
| ∗The dot plots of a searched regulon are shown for all cell subpopulations in each disease state of each tissue based on the regulon specific score inferred using pySCENIC and by calculating the average expression. |
| Page: 1 |
Top |
Somatic mutation of malignant transformation related genes |
| Annotation of somatic variants for genes involved in malignant transformation |
| Hugo Symbol | Variant Class | Variant Classification | dbSNP RS | HGVSc | HGVSp | HGVSp Short | SWISSPROT | BIOTYPE | SIFT | PolyPhen | Tumor Sample Barcode | Tissue | Histology | Sex | Age | Stage | Therapy Types | Drugs | Outcome |
| C19orf48 | SNV | Missense_Mutation | c.259N>C | p.Glu87Gln | p.E87Q | Q6RUI8 | protein_coding | tolerated_low_confidence(0.6) | benign(0.005) | TCGA-E9-A1R4-01 | Breast | breast invasive carcinoma | Female | >=65 | I/II | Chemotherapy | 5-fluorouracil | SD | |
| C19orf48 | insertion | In_Frame_Ins | novel | c.40_41insGGTCAC | p.Thr14delinsArgSerPro | p.T14delinsRSP | Q6RUI8 | protein_coding | TCGA-DS-A1OB-01 | Cervix | cervical & endocervical cancer | Female | <65 | I/II | Chemotherapy | carboplatin | PD | ||
| C19orf48 | SNV | Missense_Mutation | rs752200266 | c.292G>A | p.Ala98Thr | p.A98T | Q6RUI8 | protein_coding | tolerated_low_confidence(1) | benign(0) | TCGA-AP-A0LM-01 | Endometrium | uterine corpus endometrioid carcinoma | Female | <65 | III/IV | Chemotherapy | cisplatin | SD |
| C19orf48 | SNV | Missense_Mutation | c.208C>T | p.Leu70Phe | p.L70F | Q6RUI8 | protein_coding | tolerated_low_confidence(0.17) | possibly_damaging(0.775) | TCGA-D1-A177-01 | Endometrium | uterine corpus endometrioid carcinoma | Female | >=65 | I/II | Unknown | Unknown | PD | |
| C19orf48 | deletion | Frame_Shift_Del | novel | c.352delT | p.Ter118GlufsTer35 | p.*118Efs*35 | Q6RUI8 | protein_coding | TCGA-G3-A7M5-01 | Liver | liver hepatocellular carcinoma | Male | >=65 | I/II | Unknown | Unknown | SD | ||
| C19orf48 | SNV | Missense_Mutation | novel | c.14N>T | p.Glu5Val | p.E5V | Q6RUI8 | protein_coding | deleterious_low_confidence(0) | benign(0.148) | TCGA-52-7622-01 | Lung | lung squamous cell carcinoma | Female | <65 | I/II | Unknown | Unknown | SD |
| C19orf48 | SNV | Missense_Mutation | novel | c.191G>T | p.Gly64Val | p.G64V | Q6RUI8 | protein_coding | deleterious_low_confidence(0) | possibly_damaging(0.783) | TCGA-98-A538-01 | Lung | lung squamous cell carcinoma | Male | >=65 | I/II | Unknown | Unknown | SD |
| C19orf48 | SNV | Missense_Mutation | novel | c.310N>T | p.Gly104Trp | p.G104W | Q6RUI8 | protein_coding | deleterious_low_confidence(0) | possibly_damaging(0.906) | TCGA-NC-A5HF-01 | Lung | lung squamous cell carcinoma | Male | >=65 | III/IV | Unknown | Unknown | PD |
| C19orf48 | SNV | Missense_Mutation | c.314N>C | p.Val105Ala | p.V105A | Q6RUI8 | protein_coding | deleterious_low_confidence(0) | benign(0.006) | TCGA-B7-5816-01 | Stomach | stomach adenocarcinoma | Female | <65 | I/II | Unknown | Unknown | SD | |
| C19orf48 | deletion | Frame_Shift_Del | novel | c.298_334delNNNNNNNNNNNNNNNNNNNNNNNNNNNNNNNNNNNNN | p.Pro100GlyfsTer41 | p.P100Gfs*41 | Q6RUI8 | protein_coding | TCGA-IP-7968-01 | Stomach | stomach adenocarcinoma | Male | >=65 | III/IV | Unknown | Unknown | SD |
| Page: 1 |
Top |
Related drugs of malignant transformation related genes |
| Identification of chemicals and drugs interact with genes involved in malignant transfromation |
| (DGIdb 4.0) |
| Entrez ID | Symbol | Category | Interaction Types | Drug Claim Name | Drug Name | PMIDs |
| Page: 1 |

Copyright 2023-Present -The University of Texas Health Science Center at Houston |