
|
|||||
|
 | |
| |
| |
| |
| |
| |
|
Gene: C19orf33 |
Gene summary for C19ORF33 |
| Gene information | Species | Human | Gene symbol | C19orf33 | Gene ID | 64073 |
| Gene name | chromosome 19 open reading frame 33 | |
| Gene Alias | H2RSP | |
| Cytomap | 19q13.2 | |
| Gene Type | protein-coding | GO ID | GO:0008150 | UniProtAcc | Q9GZP8 |
Top |
Malignant transformation analysis |
| Identification of the aberrant gene expression in precancerous and cancerous lesions by comparing the gene expression of stem-like cells in diseased tissues with normal stem cells |
| Entrez ID | Symbol | Replicates | Species | Organ | Tissue | Adj P-value | Log2FC | Malignancy |
| 64073 | C19orf33 | GSM4909282 | Human | Breast | IDC | 3.56e-14 | 5.05e-01 | -0.0288 |
| 64073 | C19orf33 | GSM4909294 | Human | Breast | IDC | 9.28e-03 | -1.26e-01 | 0.2022 |
| 64073 | C19orf33 | GSM4909301 | Human | Breast | IDC | 7.43e-04 | -1.33e-01 | 0.1577 |
| 64073 | C19orf33 | GSM4909304 | Human | Breast | IDC | 7.74e-10 | 3.56e-01 | 0.1636 |
| 64073 | C19orf33 | GSM4909306 | Human | Breast | IDC | 1.24e-11 | 4.07e-01 | 0.1564 |
| 64073 | C19orf33 | GSM4909307 | Human | Breast | IDC | 3.12e-02 | -1.29e-01 | 0.1569 |
| 64073 | C19orf33 | GSM4909311 | Human | Breast | IDC | 8.38e-45 | 9.82e-01 | 0.1534 |
| 64073 | C19orf33 | GSM4909312 | Human | Breast | IDC | 1.17e-51 | 1.03e+00 | 0.1552 |
| 64073 | C19orf33 | GSM4909317 | Human | Breast | IDC | 1.04e-11 | 3.63e-01 | 0.1355 |
| 64073 | C19orf33 | GSM4909319 | Human | Breast | IDC | 7.01e-03 | -1.29e-01 | 0.1563 |
| 64073 | C19orf33 | M1 | Human | Breast | IDC | 5.53e-08 | 4.69e-01 | 0.1577 |
| 64073 | C19orf33 | NCCBC3 | Human | Breast | DCIS | 2.44e-02 | -1.27e-01 | 0.1198 |
| 64073 | C19orf33 | DCIS2 | Human | Breast | DCIS | 2.26e-11 | -3.10e-02 | 0.0085 |
| 64073 | C19orf33 | CA_HPV_1 | Human | Cervix | CC | 1.80e-20 | -6.03e-01 | 0.0264 |
| 64073 | C19orf33 | CA_HPV_3 | Human | Cervix | CC | 1.66e-06 | -1.30e-02 | 0.0414 |
| 64073 | C19orf33 | HSIL_HPV_1 | Human | Cervix | HSIL_HPV | 1.97e-06 | -2.70e-01 | 0.0116 |
| 64073 | C19orf33 | N_HPV_1 | Human | Cervix | N_HPV | 3.87e-07 | -5.13e-01 | 0.0079 |
| 64073 | C19orf33 | CCI_1 | Human | Cervix | CC | 4.28e-09 | -6.90e-01 | 0.528 |
| 64073 | C19orf33 | CCI_2 | Human | Cervix | CC | 2.64e-08 | -6.90e-01 | 0.5249 |
| 64073 | C19orf33 | CCI_3 | Human | Cervix | CC | 8.82e-10 | -6.74e-01 | 0.516 |
| Page: 1 2 3 4 5 6 7 8 9 10 |
| Tissue | Expression Dynamics | Abbreviation |
| Breast | 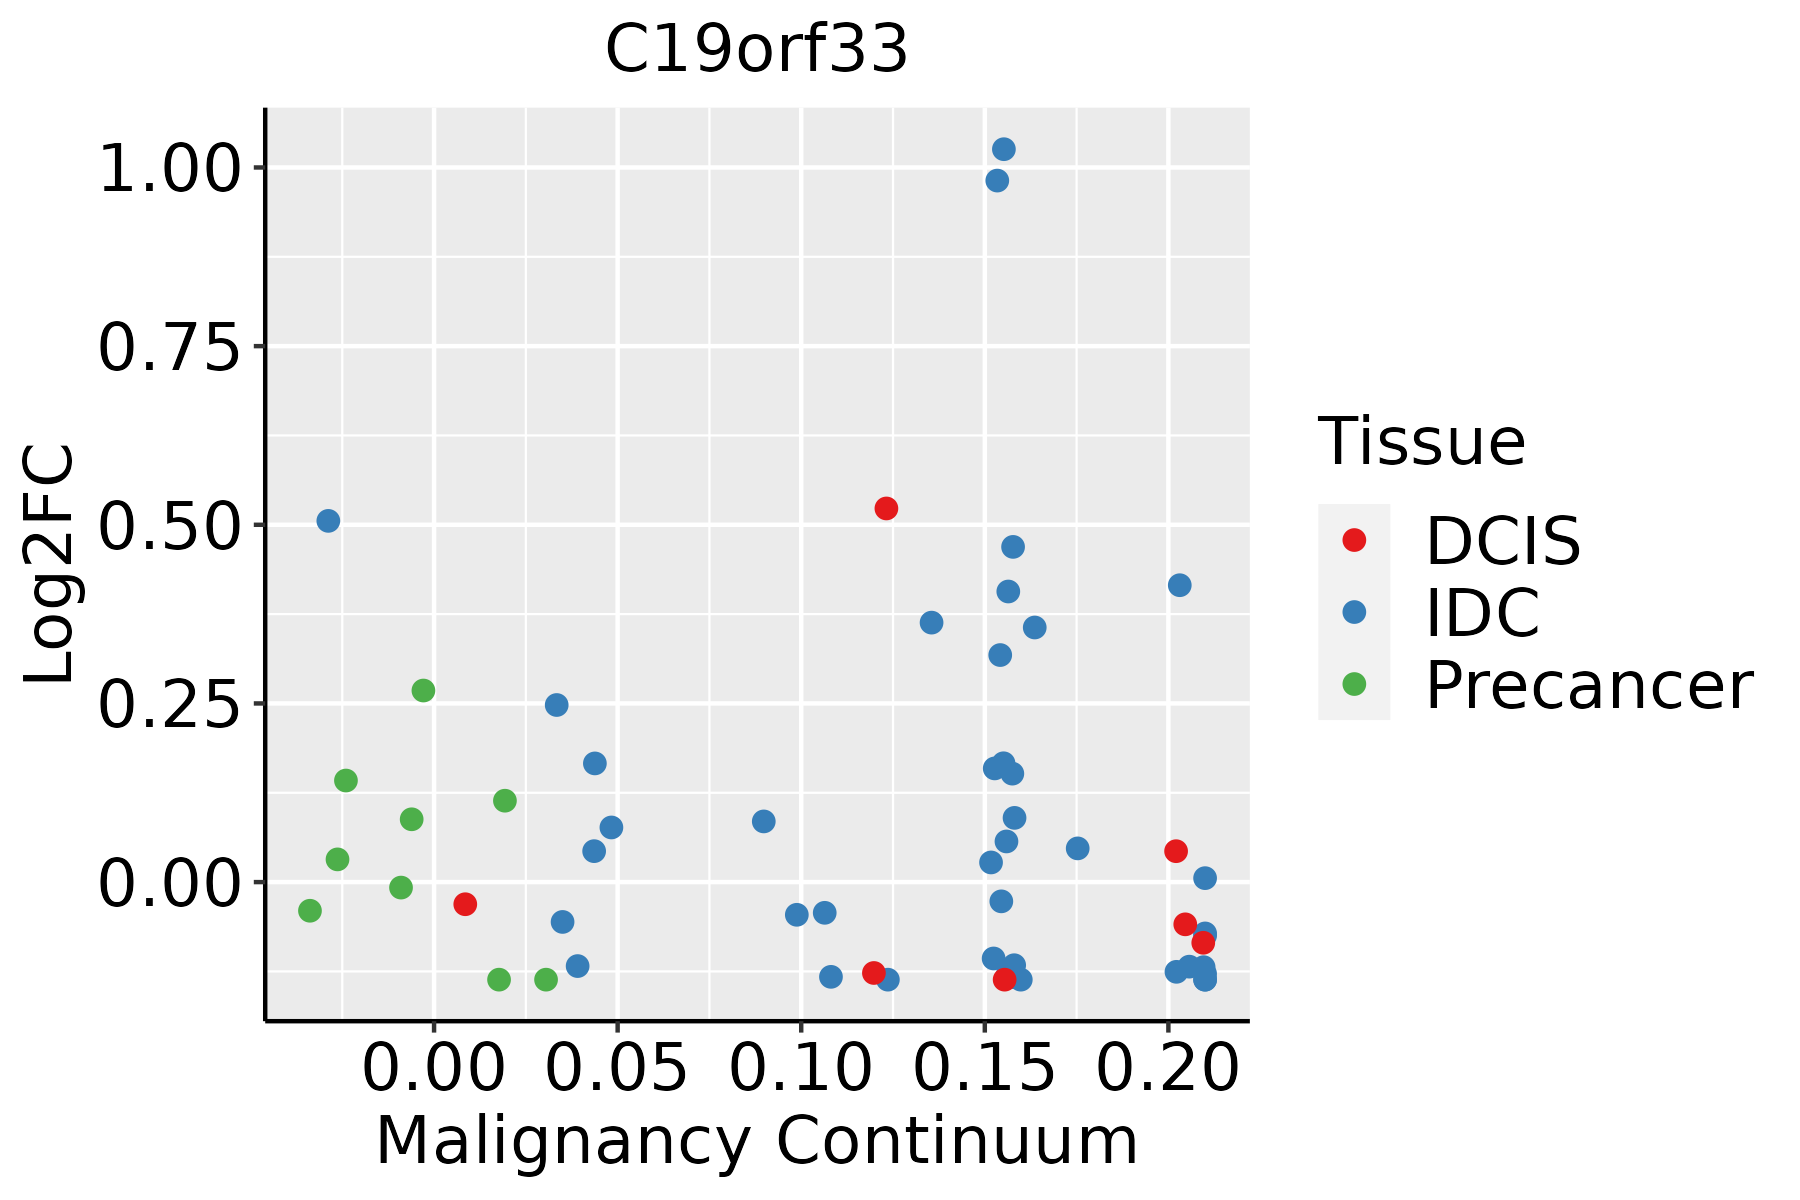 | IDC: Invasive ductal carcinoma |
| DCIS: Ductal carcinoma in situ | ||
| Precancer(BRCA1-mut): Precancerous lesion from BRCA1 mutation carriers | ||
| Cervix | 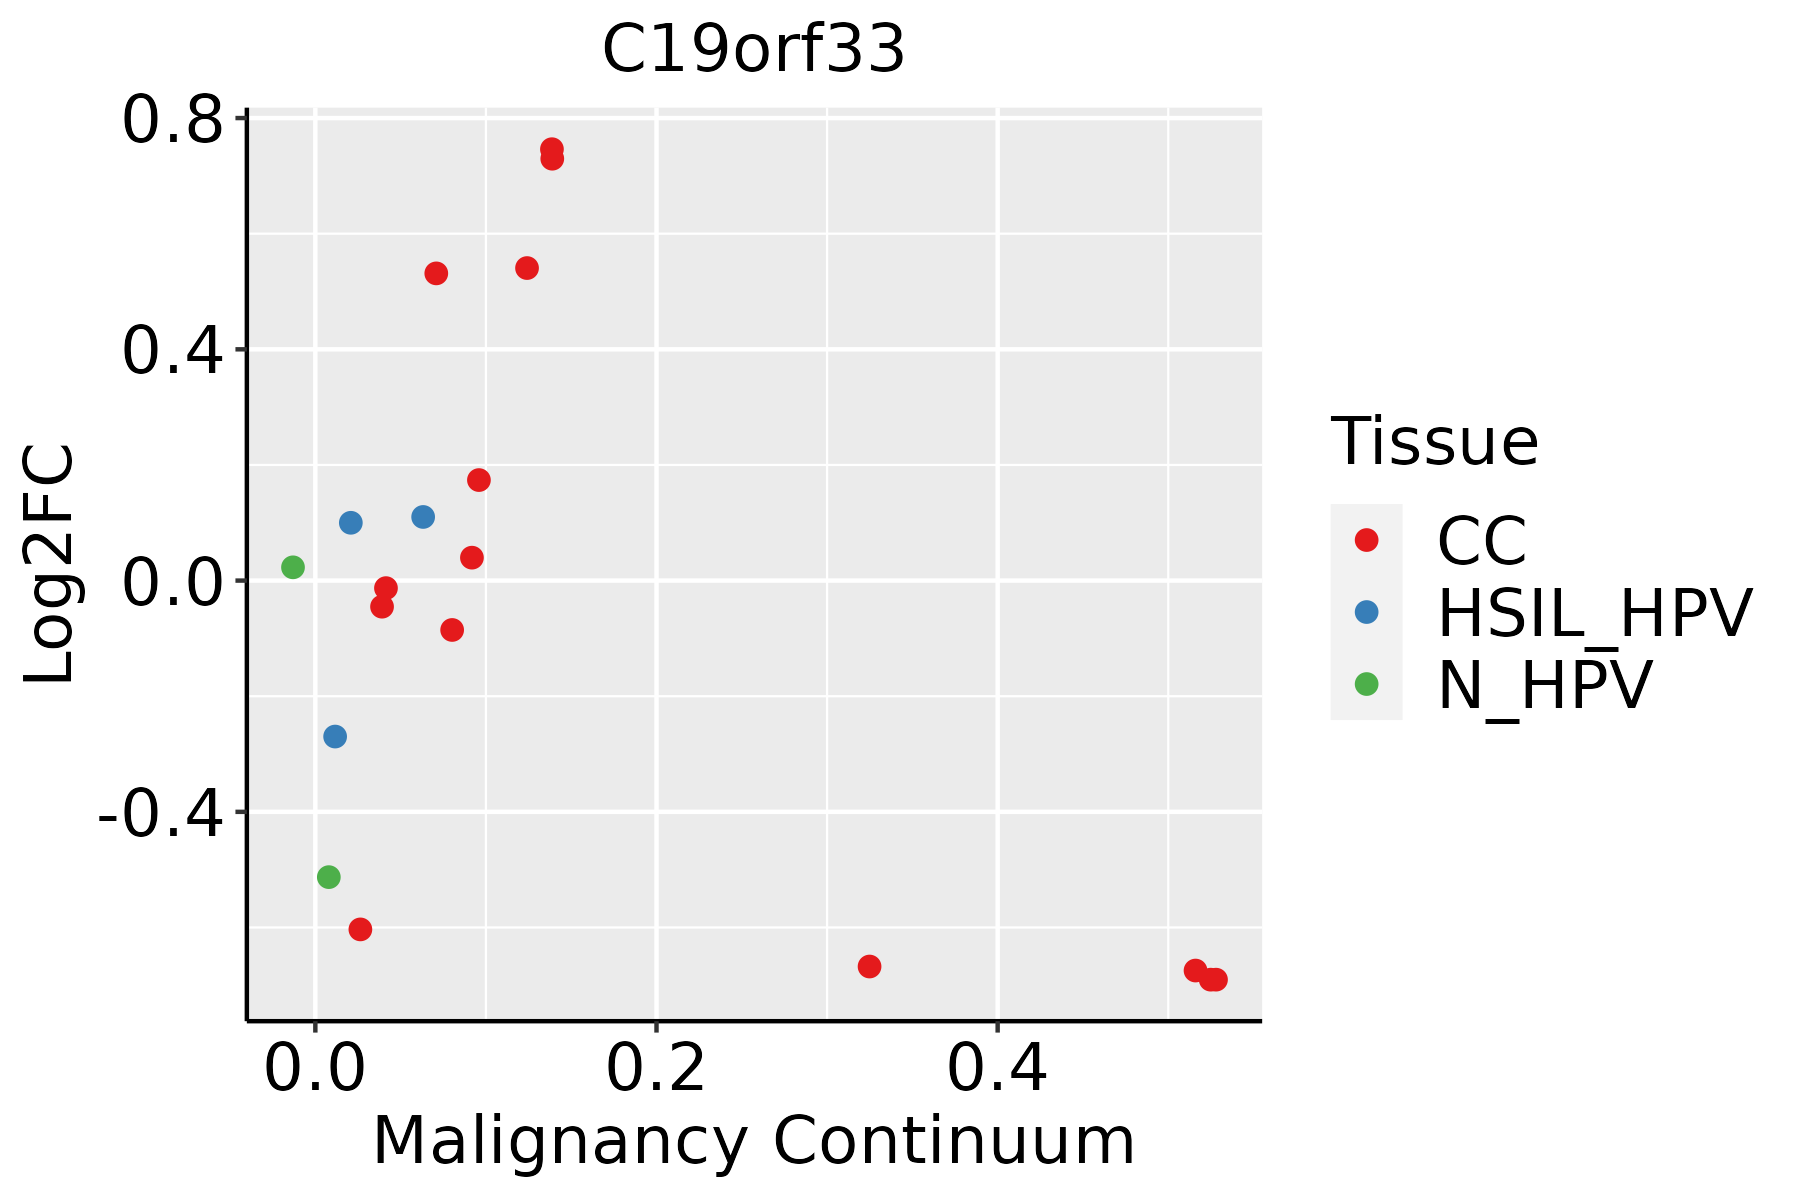 | CC: Cervix cancer |
| HSIL_HPV: HPV-infected high-grade squamous intraepithelial lesions | ||
| N_HPV: HPV-infected normal cervix | ||
| Colorectum (GSE201348) |  | FAP: Familial adenomatous polyposis |
| CRC: Colorectal cancer | ||
| Colorectum (HTA11) |  | AD: Adenomas |
| SER: Sessile serrated lesions | ||
| MSI-H: Microsatellite-high colorectal cancer | ||
| MSS: Microsatellite stable colorectal cancer | ||
| Esophagus | 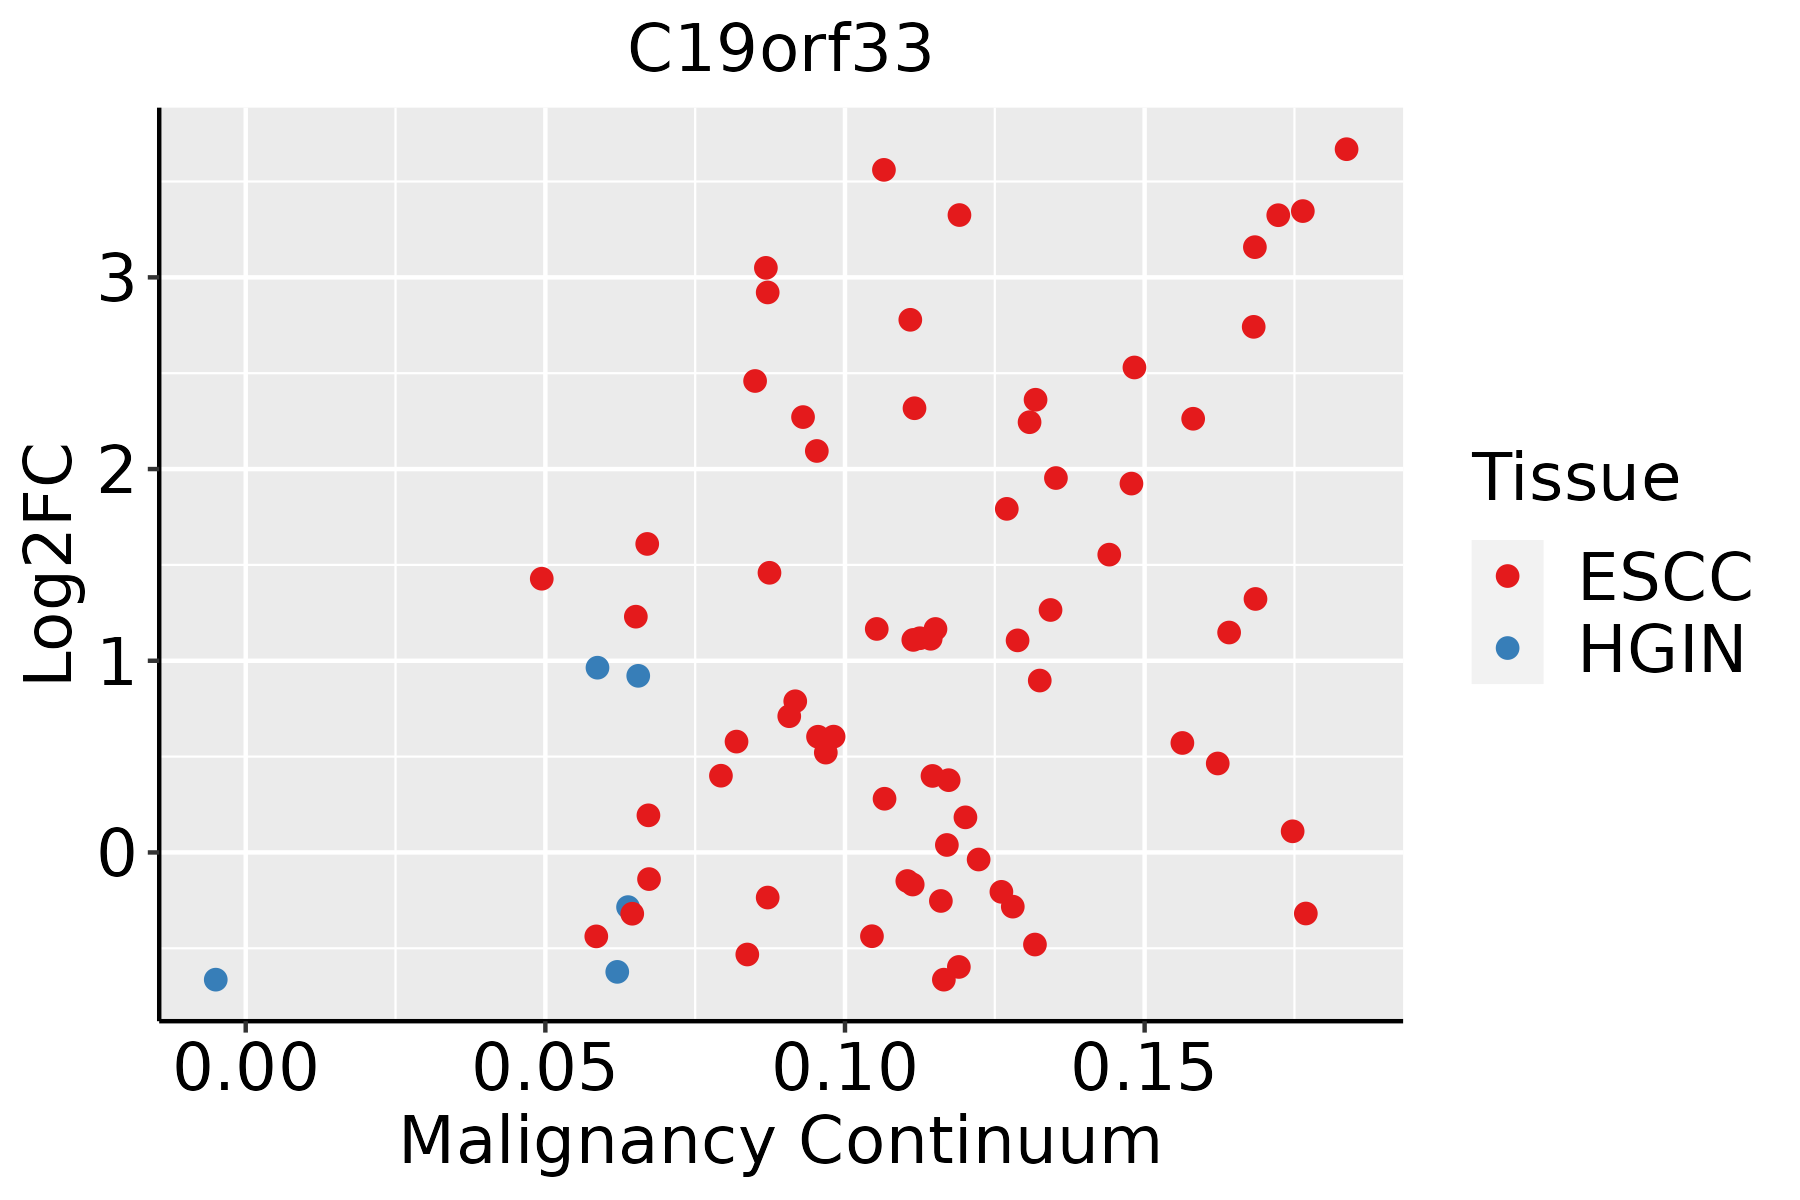 | ESCC: Esophageal squamous cell carcinoma |
| HGIN: High-grade intraepithelial neoplasias | ||
| LGIN: Low-grade intraepithelial neoplasias | ||
| GC | 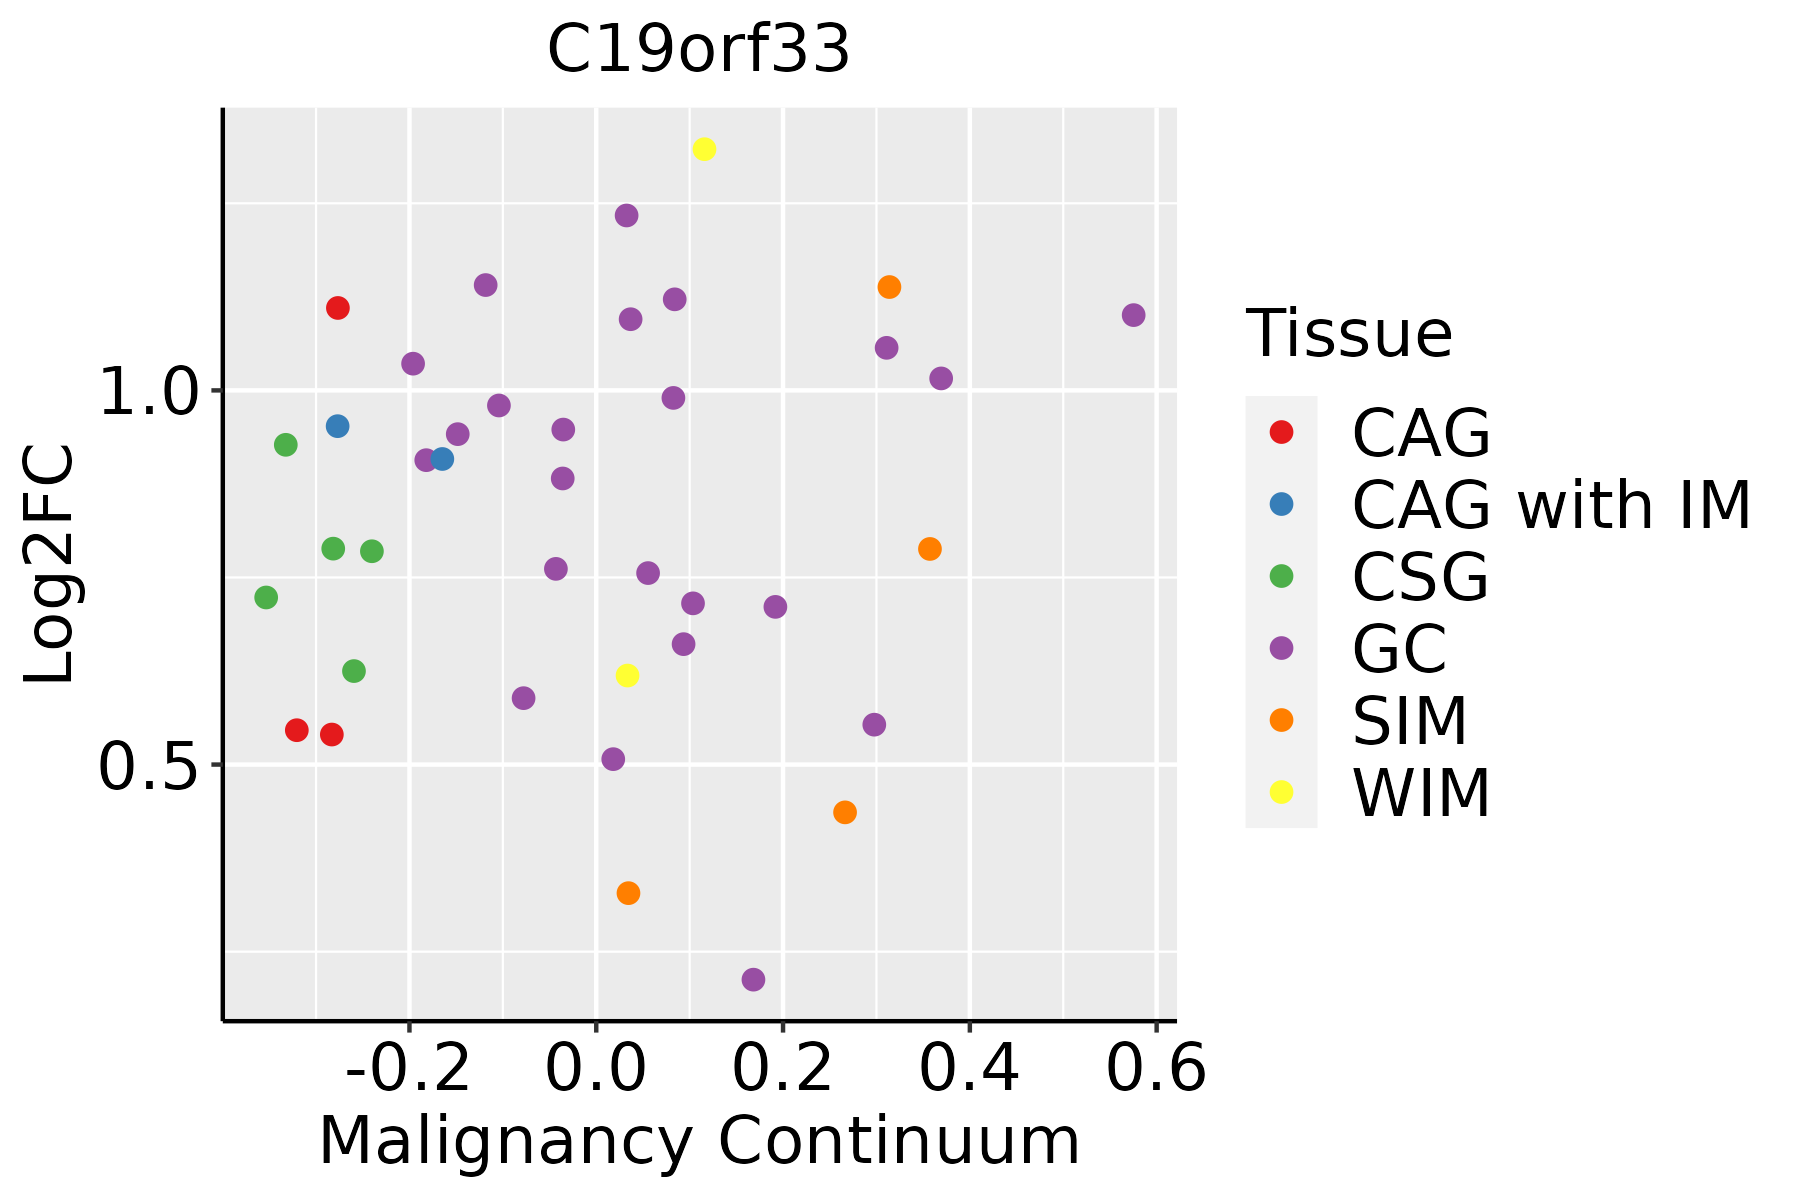 | CAG: Chronic atrophic gastritis |
| CAG with IM: Chronic atrophic gastritis with intestinal metaplasia | ||
| CSG: Chronic superficial gastritis | ||
| GC: Gastric cancer | ||
| SIM: Severe intestinal metaplasia | ||
| WIM: Wild intestinal metaplasia | ||
| Oral Cavity | 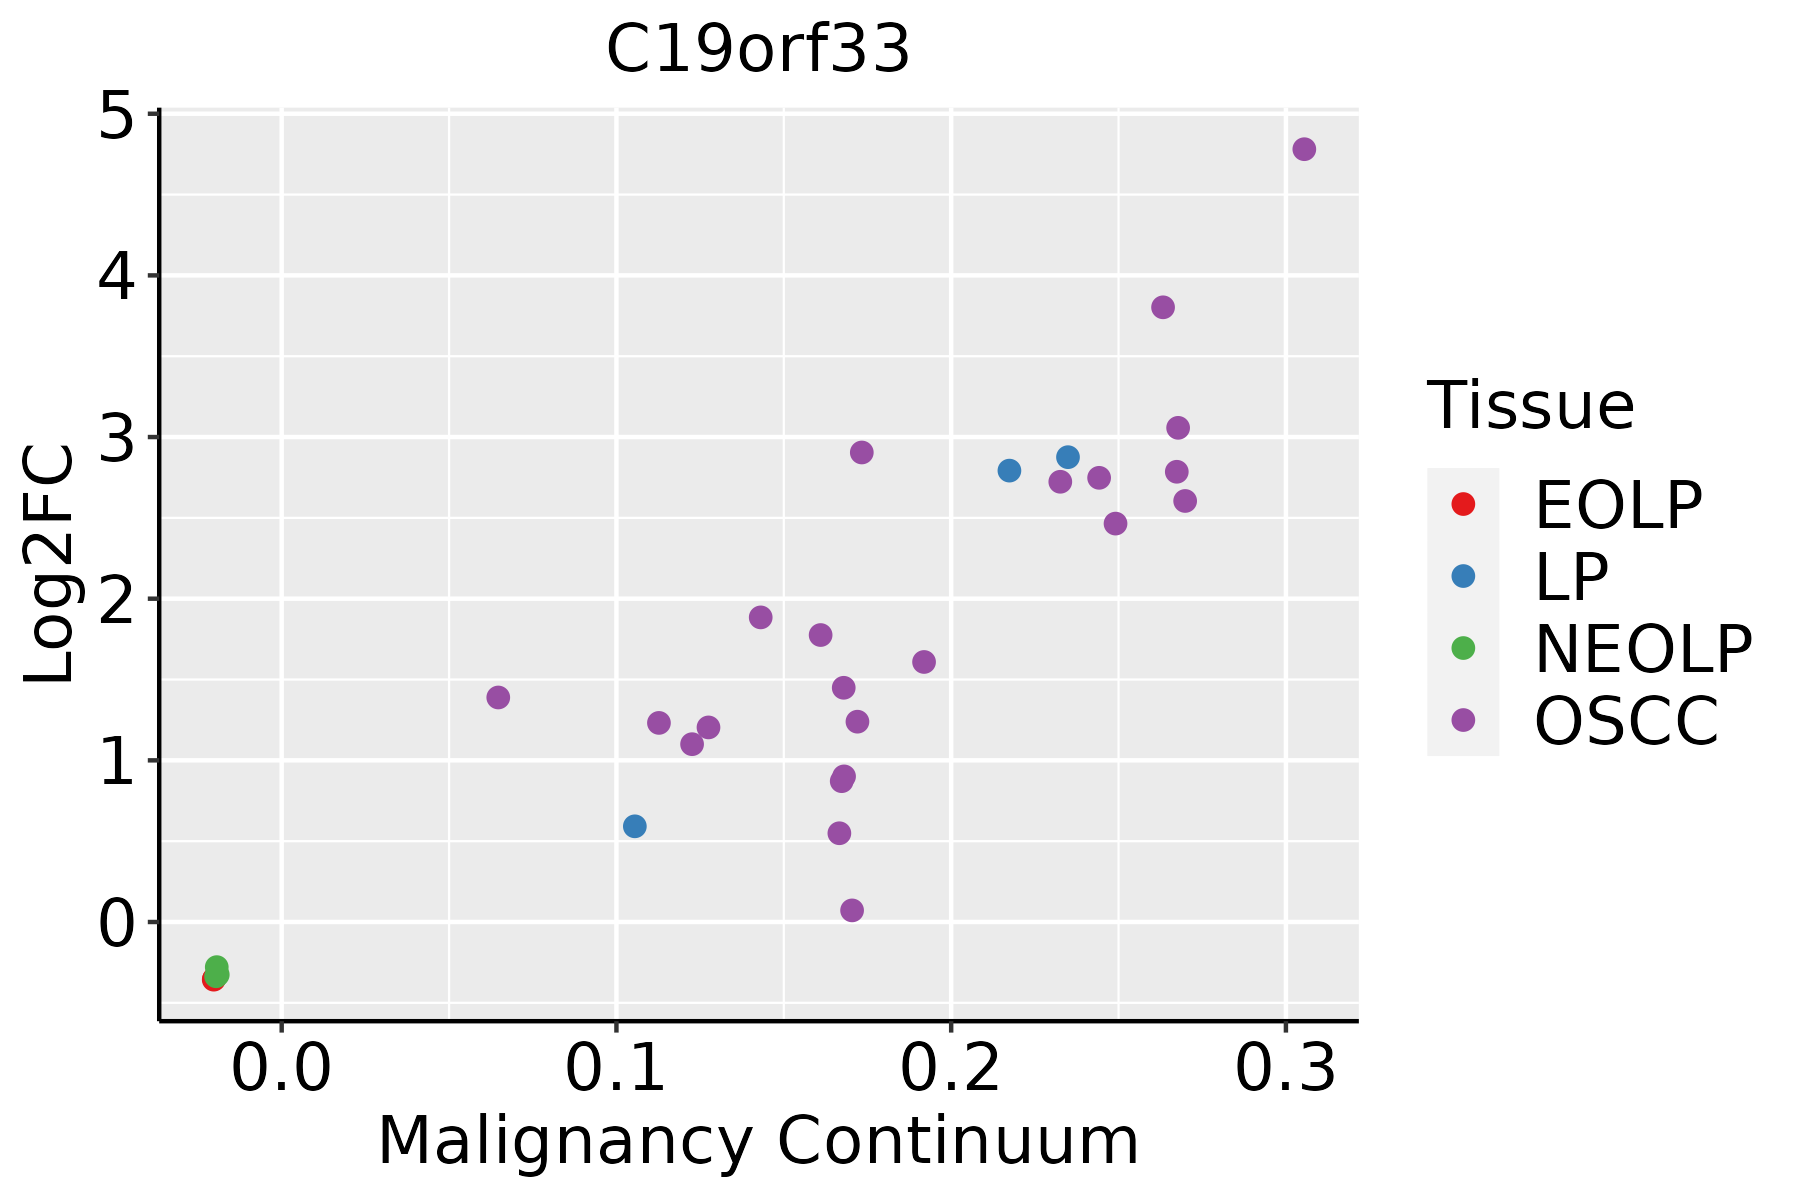 | EOLP: Erosive Oral lichen planus |
| LP: leukoplakia | ||
| NEOLP: Non-erosive oral lichen planus | ||
| OSCC: Oral squamous cell carcinoma | ||
| Skin | 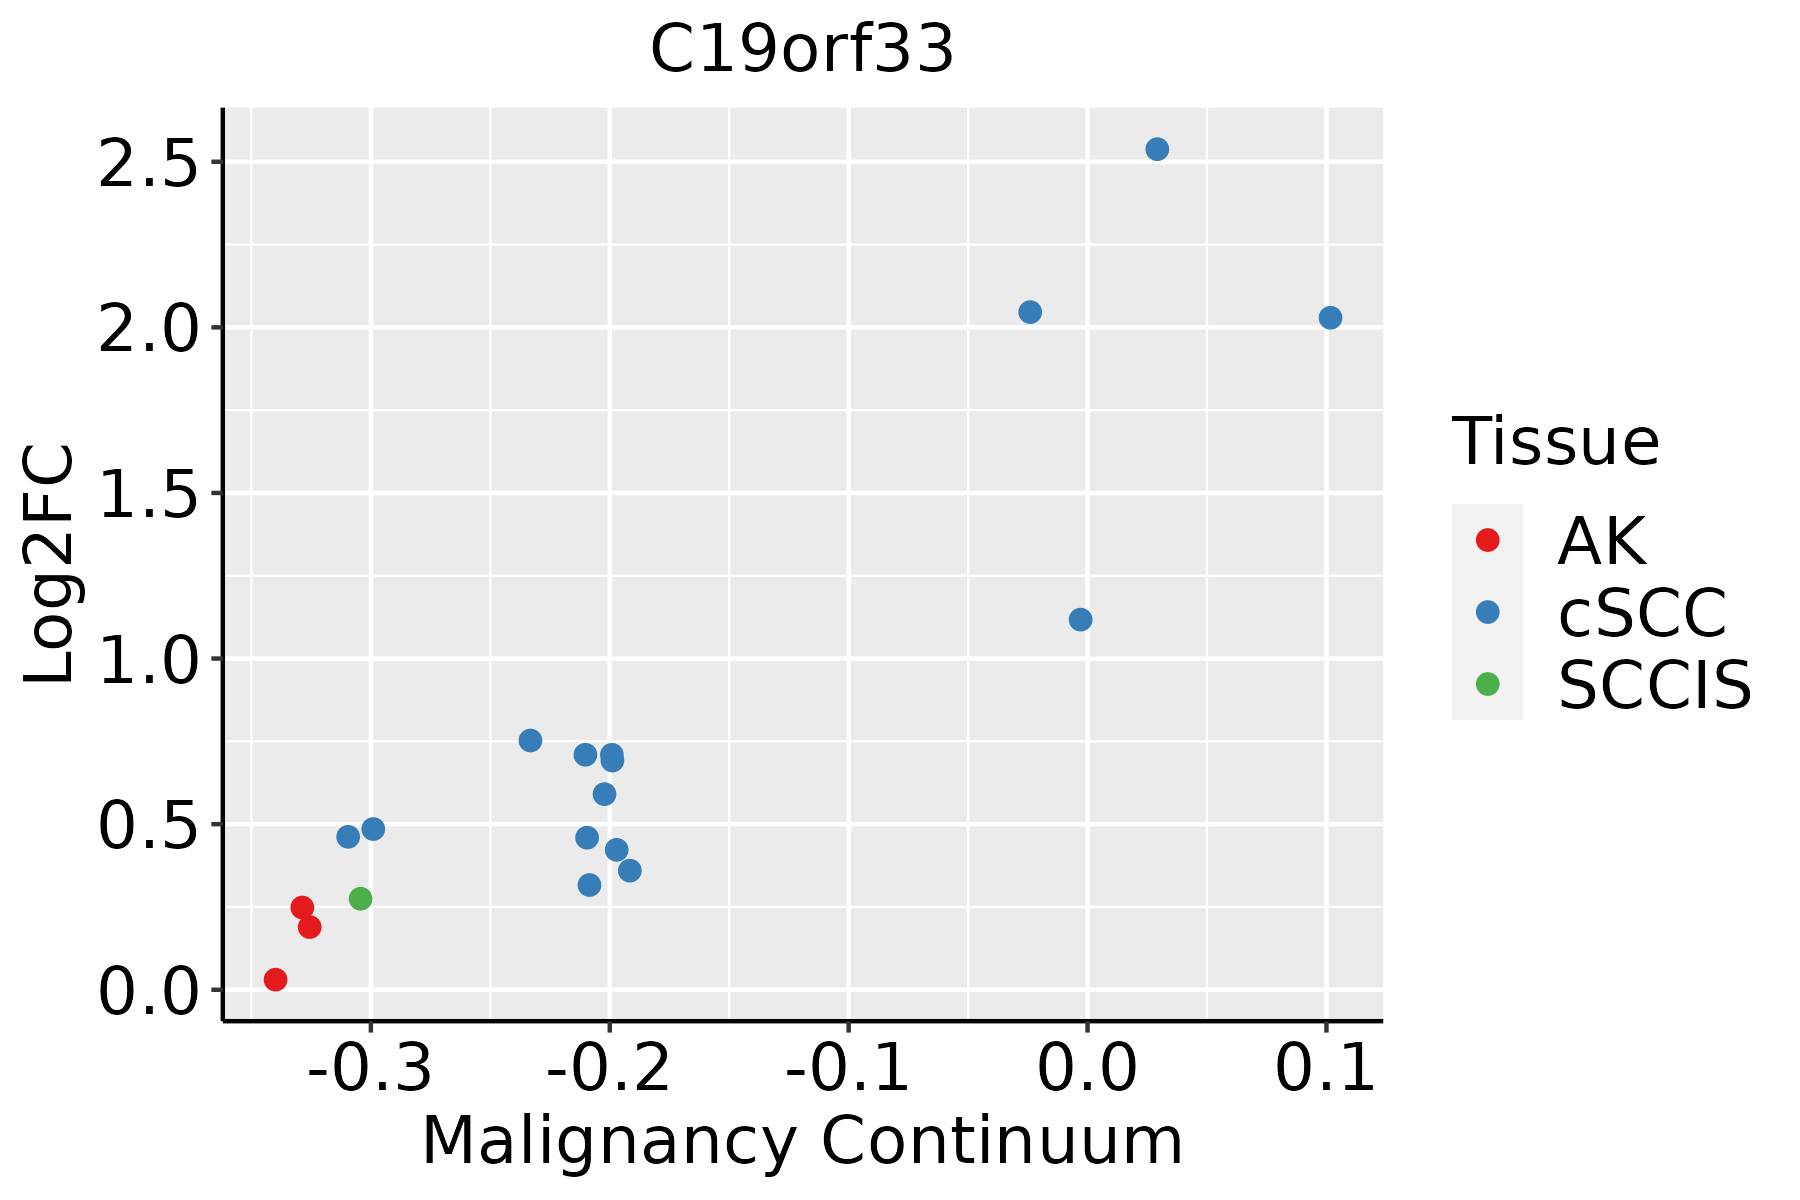 | AK: Actinic keratosis |
| cSCC: Cutaneous squamous cell carcinoma | ||
| SCCIS:squamous cell carcinoma in situ | ||
| Thyroid | 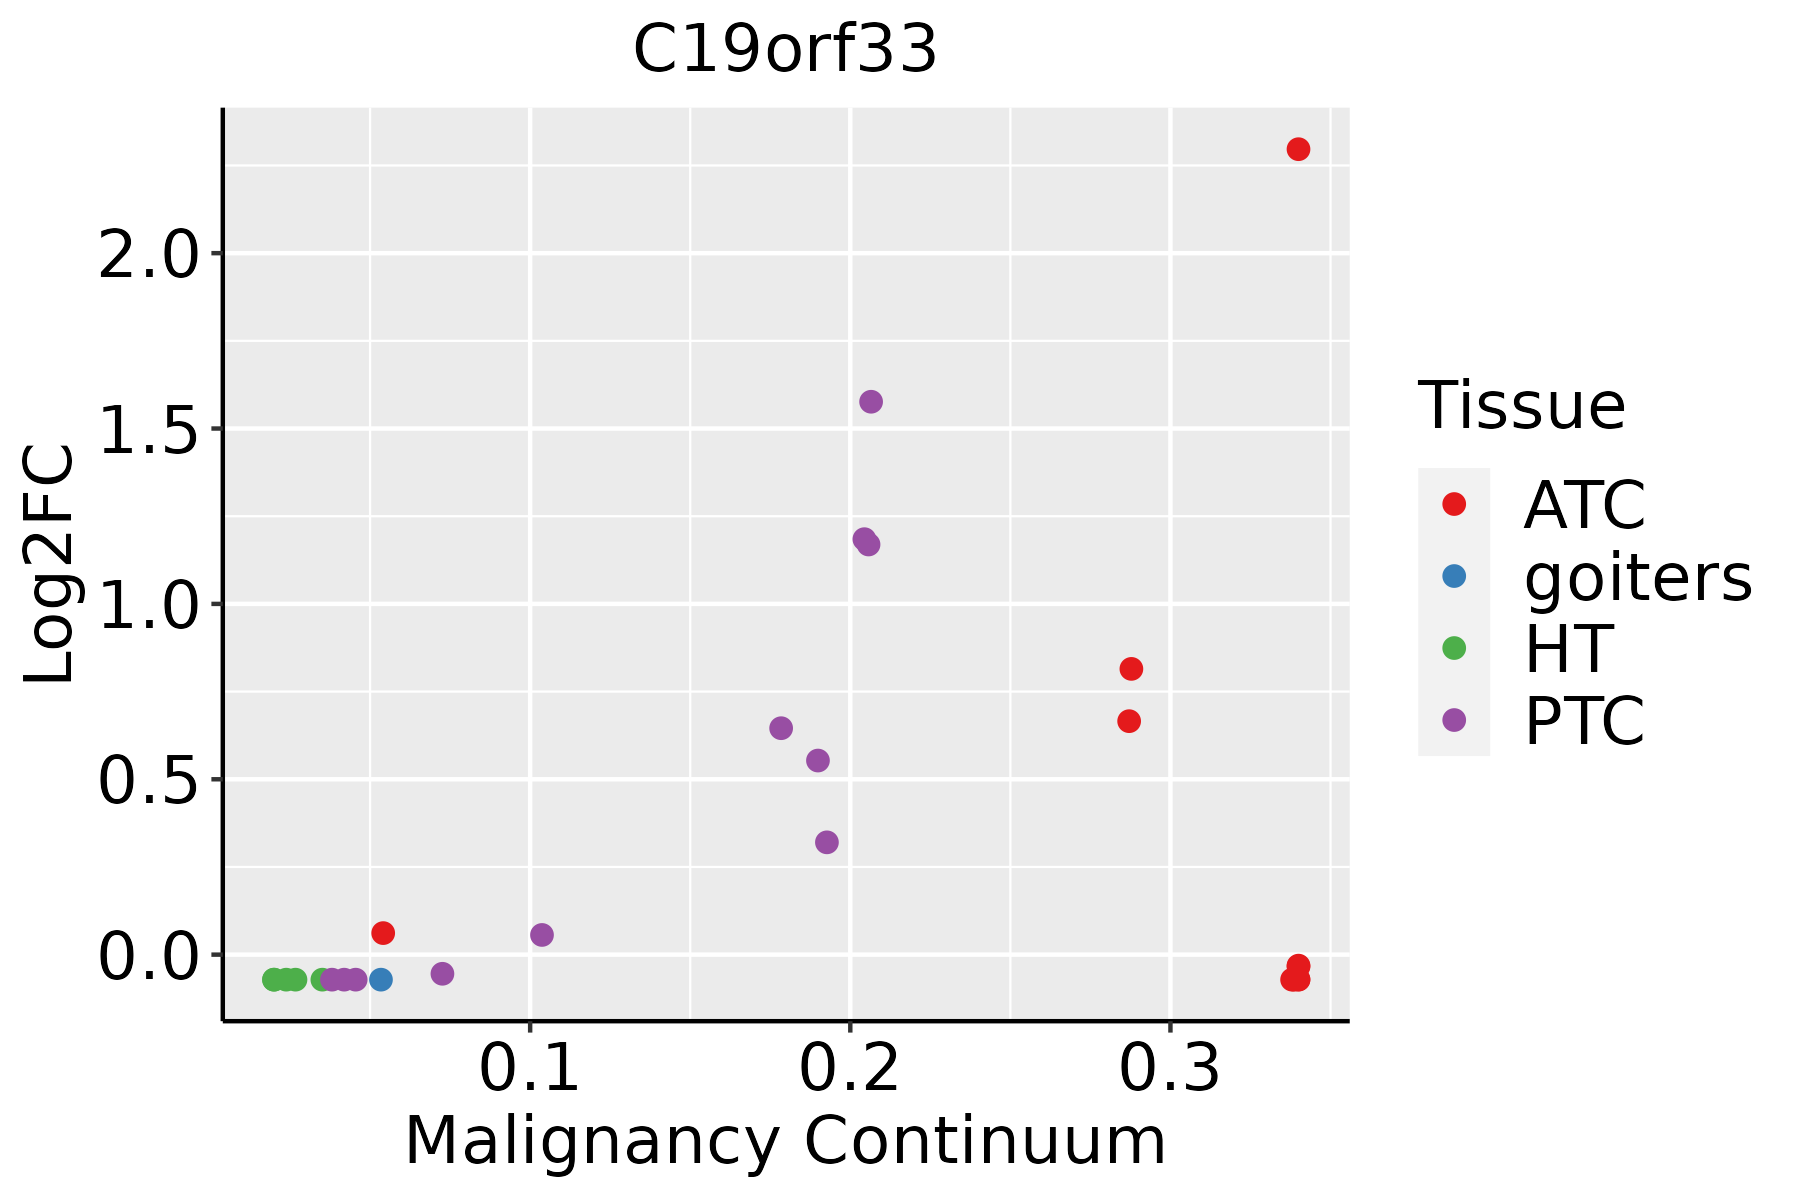 | ATC: Anaplastic thyroid cancer |
| HT: Hashimoto's thyroiditis | ||
| PTC: Papillary thyroid cancer |
| ∗log2FC in expression of this searched gene in stem-like cells from each diseased tissue sample relative to stem-like cells in normal samples in each tissue plotted against the malignancy continuum. Samples are colored based on if they are from different disease stage. |
Top |
Malignant transformation related pathway analysis |
| Find out the enriched GO biological processes and KEGG pathways involved in transition from healthy to precancer to cancer |
| Tissue | Disease Stage | Enriched GO biological Processes |
| Colorectum | AD |  |
| Colorectum | SER |  |
| Colorectum | MSS |  |
| Colorectum | MSI-H |  |
| Colorectum | FAP |  |
| ∗Top 15 enriched GO BP terms are showed in the bar plot of each disease state in each tissue. Each row represents a significant GO biological process which is colored according to the -log10(p.adjust). |
| Page: 1 2 3 4 5 6 7 8 9 |
| GO ID | Tissue | Disease Stage | Description | Gene Ratio | Bg Ratio | pvalue | p.adjust | Count |
| Page: 1 |
| Pathway ID | Tissue | Disease Stage | Description | Gene Ratio | Bg Ratio | pvalue | p.adjust | qvalue | Count |
| Page: 1 |
Top |
Cell-cell communication analysis |
| Identification of potential cell-cell interactions between two cell types and their ligand-receptor pairs for different disease states |
| Ligand | Receptor | LRpair | Pathway | Tissue | Disease Stage |
| Page: 1 |
Top |
Single-cell gene regulatory network inference analysis |
| Find out the significant the regulons (TFs) and the target genes of each regulon across cell types for different disease states |
| TF | Cell Type | Tissue | Disease Stage | Target Gene | RSS | Regulon Activity |
| ∗The dot plots of a searched regulon are shown for all cell subpopulations in each disease state of each tissue based on the regulon specific score inferred using pySCENIC and by calculating the average expression. |
| Page: 1 |
Top |
Somatic mutation of malignant transformation related genes |
| Annotation of somatic variants for genes involved in malignant transformation |
| Hugo Symbol | Variant Class | Variant Classification | dbSNP RS | HGVSc | HGVSp | HGVSp Short | SWISSPROT | BIOTYPE | SIFT | PolyPhen | Tumor Sample Barcode | Tissue | Histology | Sex | Age | Stage | Therapy Types | Drugs | Outcome |
| C19orf33 | SNV | Missense_Mutation | c.17N>A | p.Gly6Glu | p.G6E | Q9GZP8 | protein_coding | deleterious_low_confidence(0.04) | benign(0.092) | TCGA-BH-A18P-01 | Breast | breast invasive carcinoma | Female | <65 | I/II | Unknown | Unknown | PD | |
| C19orf33 | SNV | Missense_Mutation | rs762128437 | c.121G>A | p.Ala41Thr | p.A41T | Q9GZP8 | protein_coding | tolerated_low_confidence(0.14) | possibly_damaging(0.644) | TCGA-S3-AA10-01 | Breast | breast invasive carcinoma | Female | >=65 | I/II | Chemotherapy | cytoxan | CR |
| C19orf33 | SNV | Missense_Mutation | novel | c.167G>A | p.Ser56Asn | p.S56N | Q9GZP8 | protein_coding | deleterious_low_confidence(0) | possibly_damaging(0.799) | TCGA-AP-A1DK-01 | Endometrium | uterine corpus endometrioid carcinoma | Female | <65 | I/II | Unknown | Unknown | SD |
| C19orf33 | SNV | Missense_Mutation | c.296G>A | p.Gly99Asp | p.G99D | Q9GZP8 | protein_coding | deleterious_low_confidence(0) | benign(0.026) | TCGA-B5-A11E-01 | Endometrium | uterine corpus endometrioid carcinoma | Female | <65 | I/II | Unknown | Unknown | SD | |
| C19orf33 | SNV | Missense_Mutation | novel | c.184T>G | p.Ser62Ala | p.S62A | Q9GZP8 | protein_coding | deleterious_low_confidence(0.03) | benign(0.188) | TCGA-EO-A3AY-01 | Endometrium | uterine corpus endometrioid carcinoma | Female | <65 | I/II | Unknown | Unknown | PD |
| C19orf33 | SNV | Missense_Mutation | novel | c.29N>T | p.Glu10Val | p.E10V | Q9GZP8 | protein_coding | deleterious_low_confidence(0.01) | possibly_damaging(0.76) | TCGA-FI-A2D5-01 | Endometrium | uterine corpus endometrioid carcinoma | Female | <65 | III/IV | Chemotherapy | carboplatinum | PD |
| C19orf33 | SNV | Missense_Mutation | novel | c.176N>A | p.Ser59Tyr | p.S59Y | Q9GZP8 | protein_coding | deleterious_low_confidence(0) | possibly_damaging(0.872) | TCGA-CC-A8HS-01 | Liver | liver hepatocellular carcinoma | Male | <65 | III/IV | Unknown | Unknown | PD |
| C19orf33 | SNV | Missense_Mutation | novel | c.56N>T | p.Gly19Val | p.G19V | Q9GZP8 | protein_coding | deleterious_low_confidence(0) | benign(0.067) | TCGA-77-A5G3-01 | Lung | lung squamous cell carcinoma | Male | <65 | I/II | Unknown | Unknown | SD |
| C19orf33 | deletion | In_Frame_Del | novel | c.275_283delNNNNNNNNN | p.Gly94_Lys96del | p.G94_K96del | Q9GZP8 | protein_coding | TCGA-KC-A7F5-01 | Prostate | prostate adenocarcinoma | Male | <65 | 7 | Unknown | Unknown | SD | ||
| C19orf33 | SNV | Missense_Mutation | c.160N>A | p.Asp54Asn | p.D54N | Q9GZP8 | protein_coding | tolerated_low_confidence(0.07) | possibly_damaging(0.447) | TCGA-BR-7723-01 | Stomach | stomach adenocarcinoma | Male | <65 | III/IV | Chemotherapy | etoposide | PD |
| Page: 1 2 |
Top |
Related drugs of malignant transformation related genes |
| Identification of chemicals and drugs interact with genes involved in malignant transfromation |
| (DGIdb 4.0) |
| Entrez ID | Symbol | Category | Interaction Types | Drug Claim Name | Drug Name | PMIDs |
| Page: 1 |

Copyright 2023-Present -The University of Texas Health Science Center at Houston |