
|
|||||
|
 | |
| |
| |
| |
| |
| |
|
Gene: C19orf25 |
Gene summary for C19ORF25 |
| Gene information | Species | Human | Gene symbol | C19orf25 | Gene ID | 148223 |
| Gene name | chromosome 19 open reading frame 25 | |
| Gene Alias | C19orf25 | |
| Cytomap | 19p13.3 | |
| Gene Type | protein-coding | GO ID | GO:0003674 | UniProtAcc | Q9UFG5 |
Top |
Malignant transformation analysis |
| Identification of the aberrant gene expression in precancerous and cancerous lesions by comparing the gene expression of stem-like cells in diseased tissues with normal stem cells |
| Entrez ID | Symbol | Replicates | Species | Organ | Tissue | Adj P-value | Log2FC | Malignancy |
| 148223 | C19orf25 | LZE4T | Human | Esophagus | ESCC | 2.37e-12 | 3.39e-01 | 0.0811 |
| 148223 | C19orf25 | LZE5T | Human | Esophagus | ESCC | 2.03e-02 | 1.73e-01 | 0.0514 |
| 148223 | C19orf25 | LZE7T | Human | Esophagus | ESCC | 2.65e-09 | 3.34e-01 | 0.0667 |
| 148223 | C19orf25 | LZE8T | Human | Esophagus | ESCC | 3.27e-05 | 1.62e-01 | 0.067 |
| 148223 | C19orf25 | LZE20T | Human | Esophagus | ESCC | 1.60e-08 | 2.92e-01 | 0.0662 |
| 148223 | C19orf25 | LZE21D1 | Human | Esophagus | HGIN | 1.12e-04 | 3.76e-01 | 0.0632 |
| 148223 | C19orf25 | LZE22T | Human | Esophagus | ESCC | 1.12e-03 | 3.65e-01 | 0.068 |
| 148223 | C19orf25 | LZE24T | Human | Esophagus | ESCC | 6.60e-16 | 4.23e-01 | 0.0596 |
| 148223 | C19orf25 | LZE21T | Human | Esophagus | ESCC | 1.46e-03 | 4.20e-01 | 0.0655 |
| 148223 | C19orf25 | P1T-E | Human | Esophagus | ESCC | 1.68e-17 | 5.93e-01 | 0.0875 |
| 148223 | C19orf25 | P2T-E | Human | Esophagus | ESCC | 1.43e-19 | 3.08e-01 | 0.1177 |
| 148223 | C19orf25 | P4T-E | Human | Esophagus | ESCC | 1.21e-26 | 5.20e-01 | 0.1323 |
| 148223 | C19orf25 | P5T-E | Human | Esophagus | ESCC | 2.23e-16 | 2.90e-01 | 0.1327 |
| 148223 | C19orf25 | P8T-E | Human | Esophagus | ESCC | 1.38e-08 | 1.62e-01 | 0.0889 |
| 148223 | C19orf25 | P9T-E | Human | Esophagus | ESCC | 2.03e-19 | 4.67e-01 | 0.1131 |
| 148223 | C19orf25 | P10T-E | Human | Esophagus | ESCC | 1.07e-36 | 6.71e-01 | 0.116 |
| 148223 | C19orf25 | P11T-E | Human | Esophagus | ESCC | 3.40e-28 | 8.53e-01 | 0.1426 |
| 148223 | C19orf25 | P12T-E | Human | Esophagus | ESCC | 8.40e-20 | 4.23e-01 | 0.1122 |
| 148223 | C19orf25 | P15T-E | Human | Esophagus | ESCC | 3.73e-22 | 3.17e-01 | 0.1149 |
| 148223 | C19orf25 | P16T-E | Human | Esophagus | ESCC | 7.14e-27 | 3.96e-01 | 0.1153 |
| Page: 1 2 3 4 5 6 |
| Tissue | Expression Dynamics | Abbreviation |
| Esophagus | 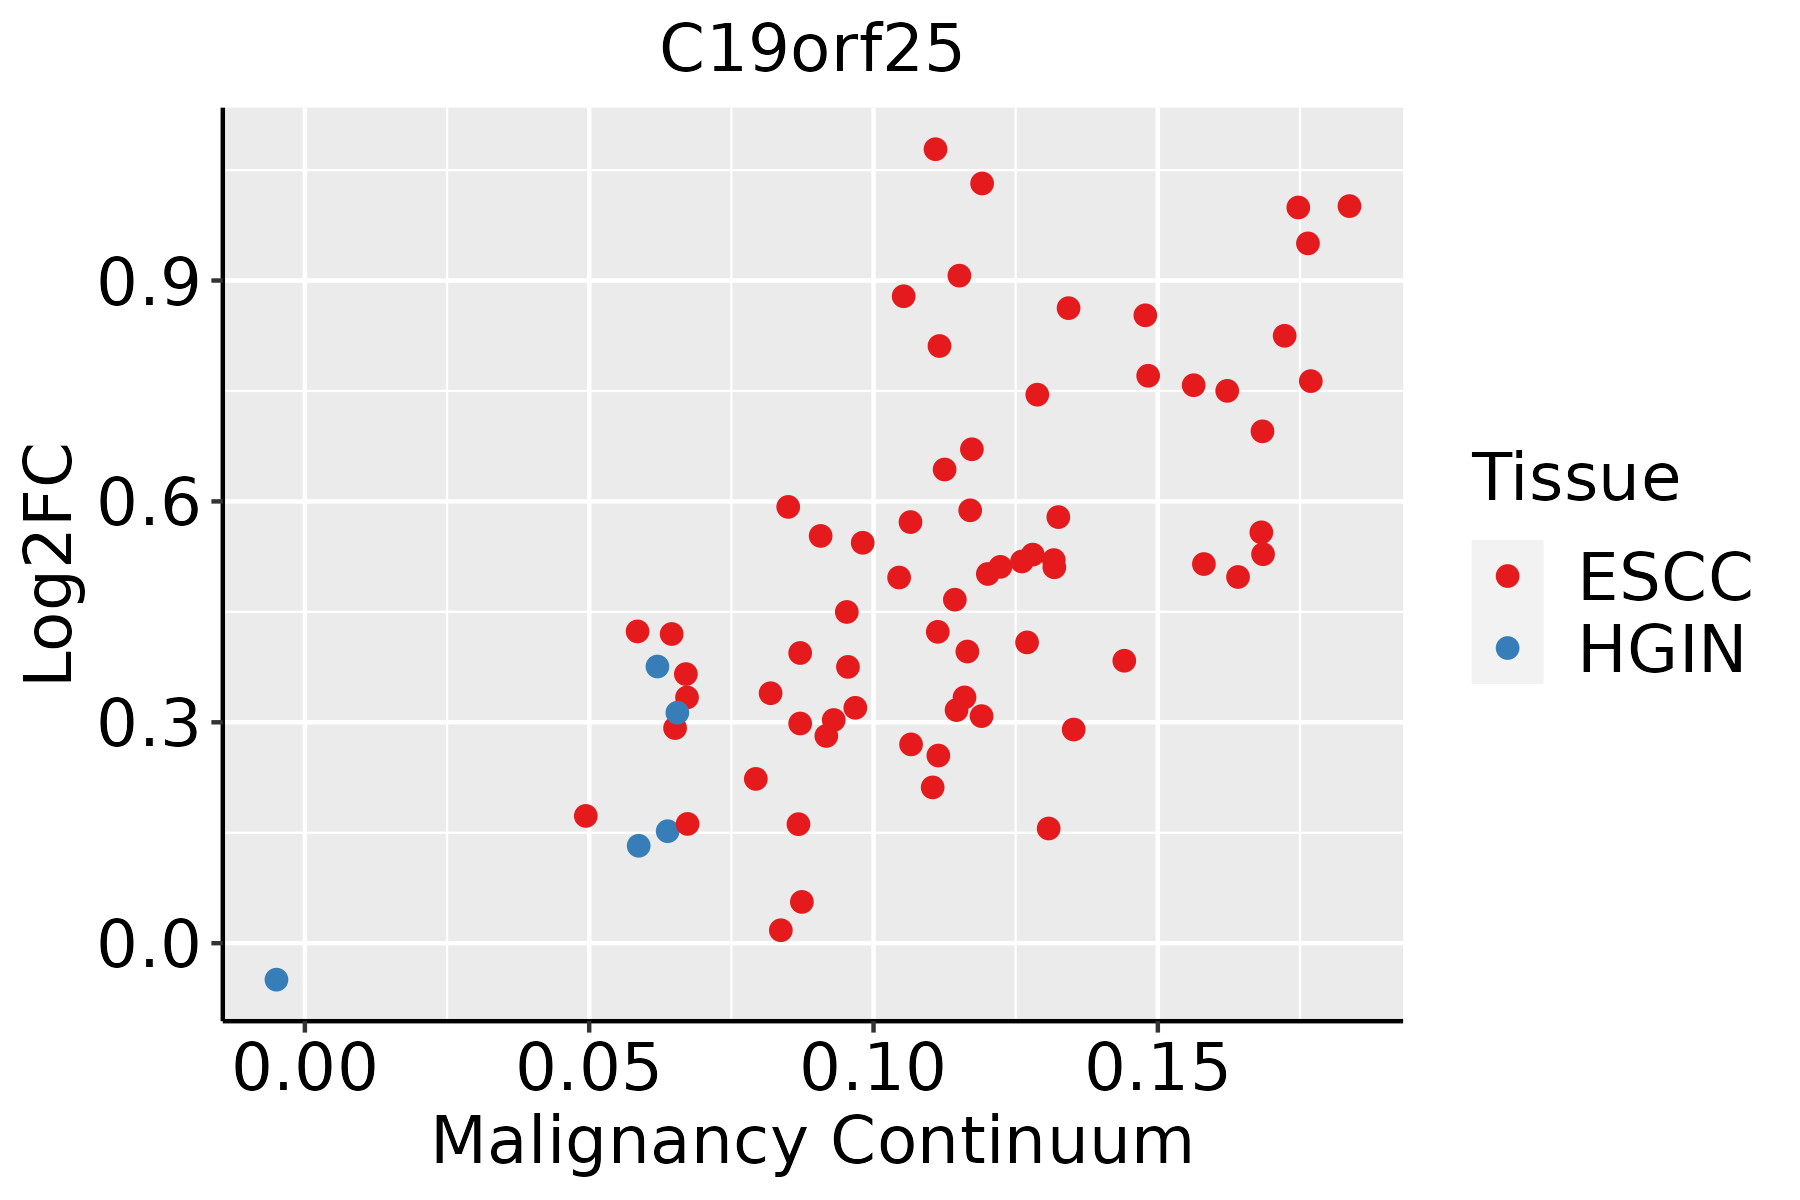 | ESCC: Esophageal squamous cell carcinoma |
| HGIN: High-grade intraepithelial neoplasias | ||
| LGIN: Low-grade intraepithelial neoplasias | ||
| Liver | 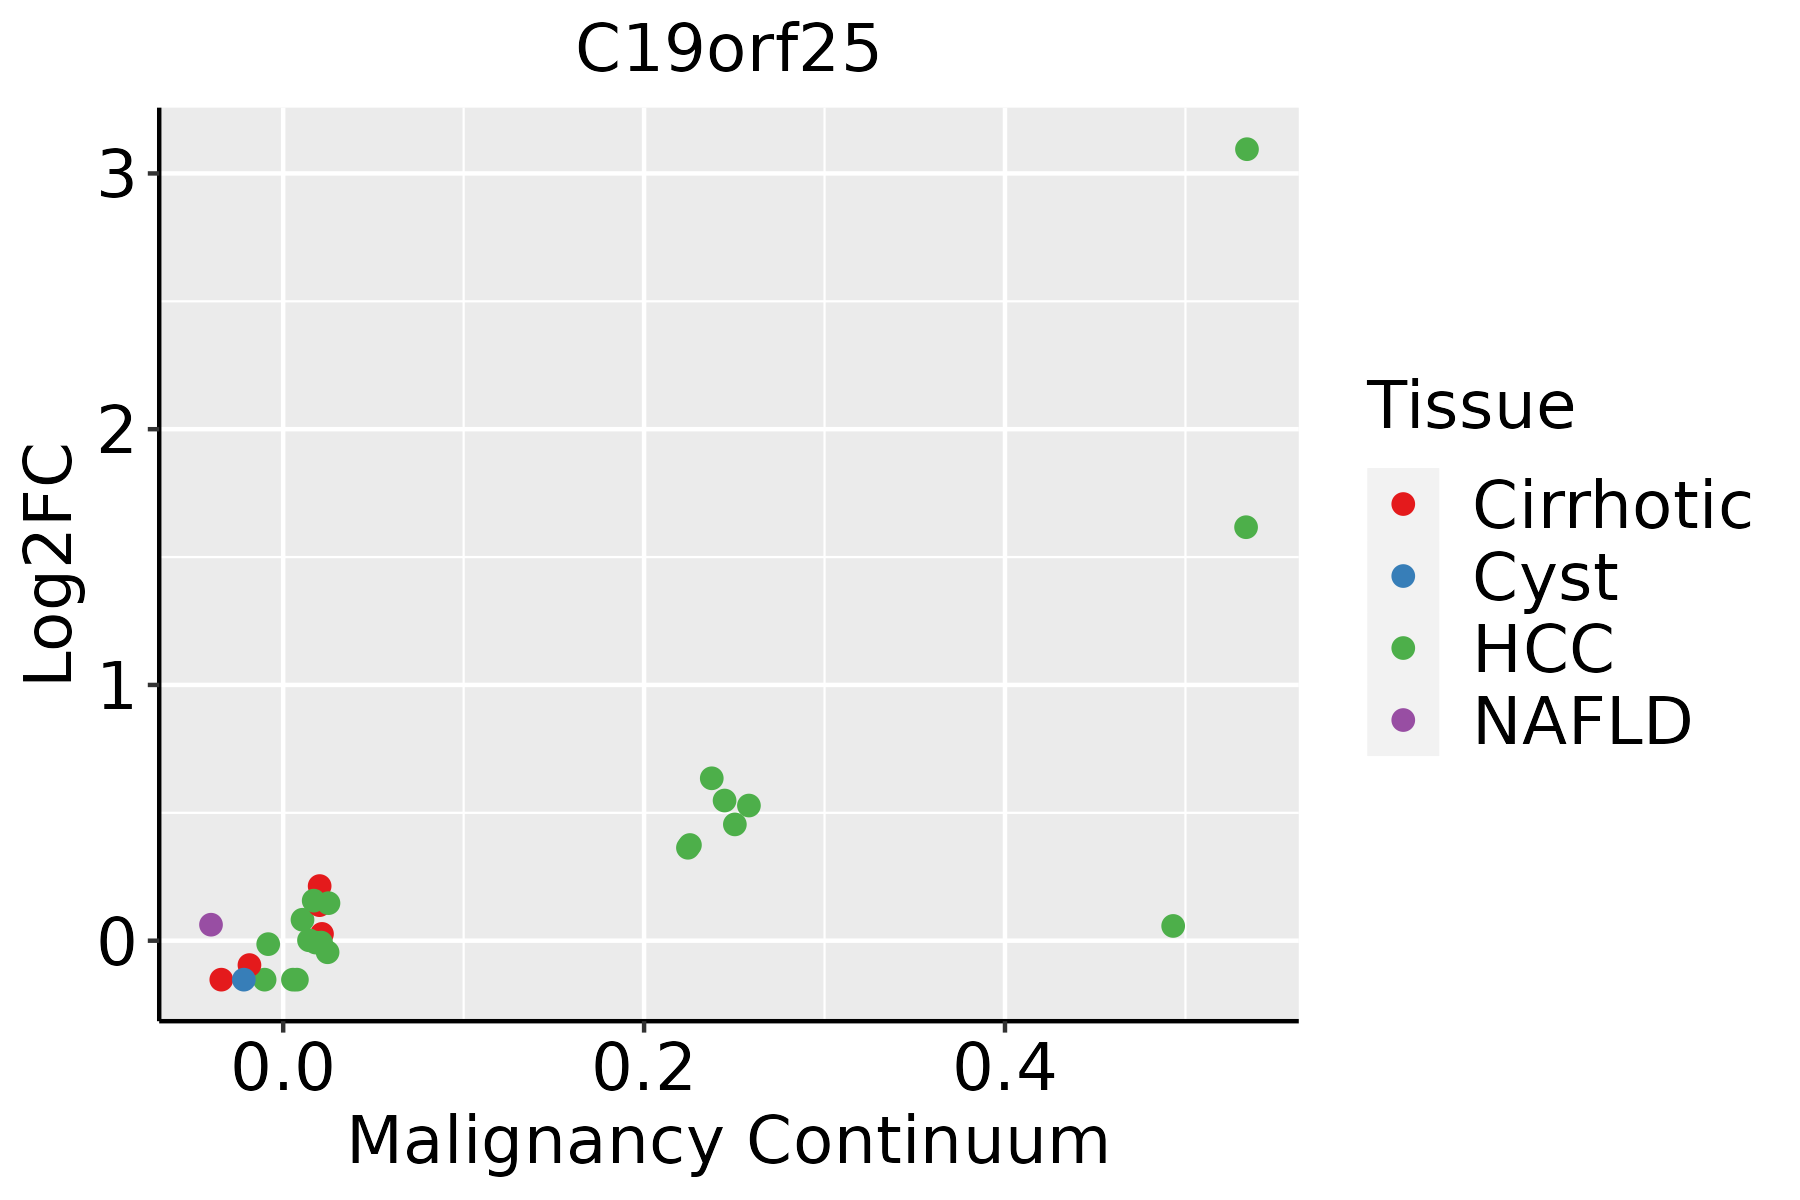 | HCC: Hepatocellular carcinoma |
| NAFLD: Non-alcoholic fatty liver disease | ||
| Oral Cavity |  | EOLP: Erosive Oral lichen planus |
| LP: leukoplakia | ||
| NEOLP: Non-erosive oral lichen planus | ||
| OSCC: Oral squamous cell carcinoma | ||
| Skin | 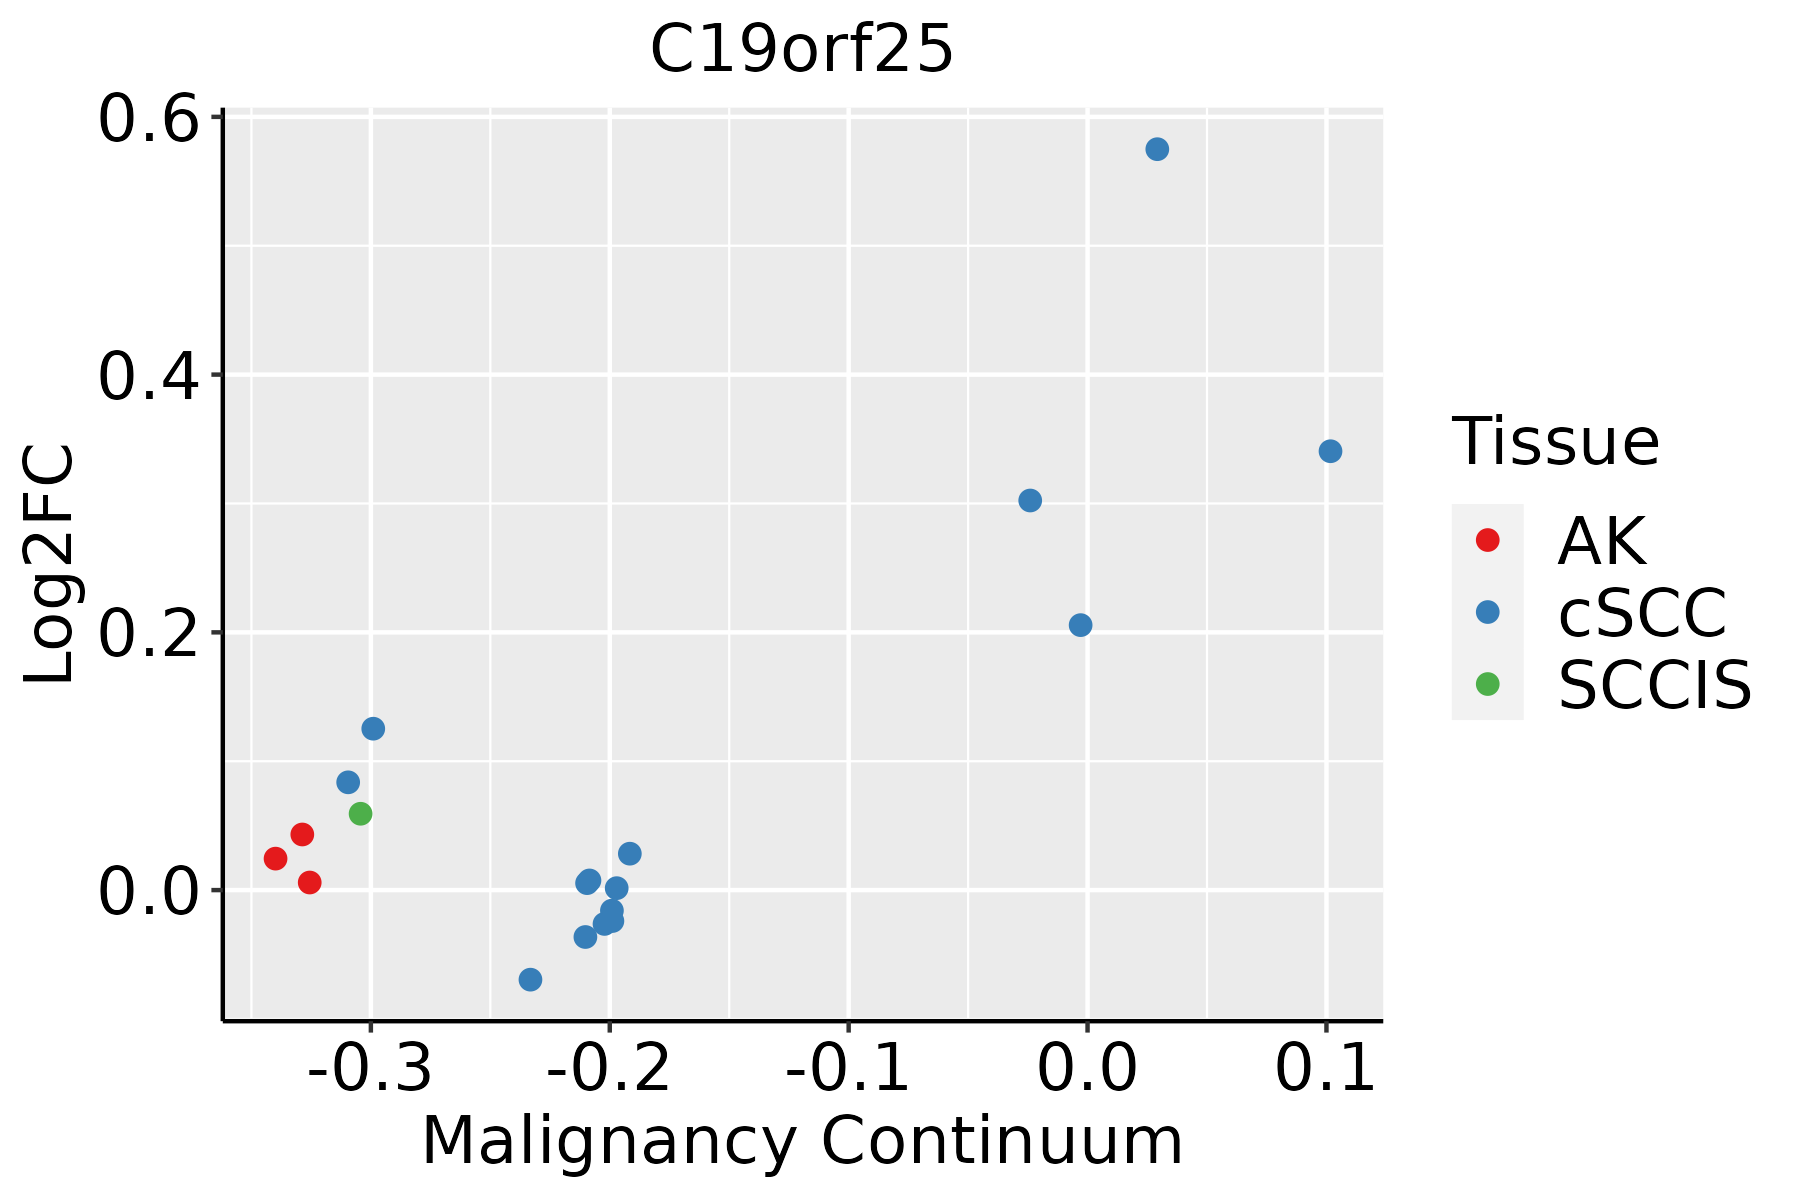 | AK: Actinic keratosis |
| cSCC: Cutaneous squamous cell carcinoma | ||
| SCCIS:squamous cell carcinoma in situ | ||
| Thyroid | 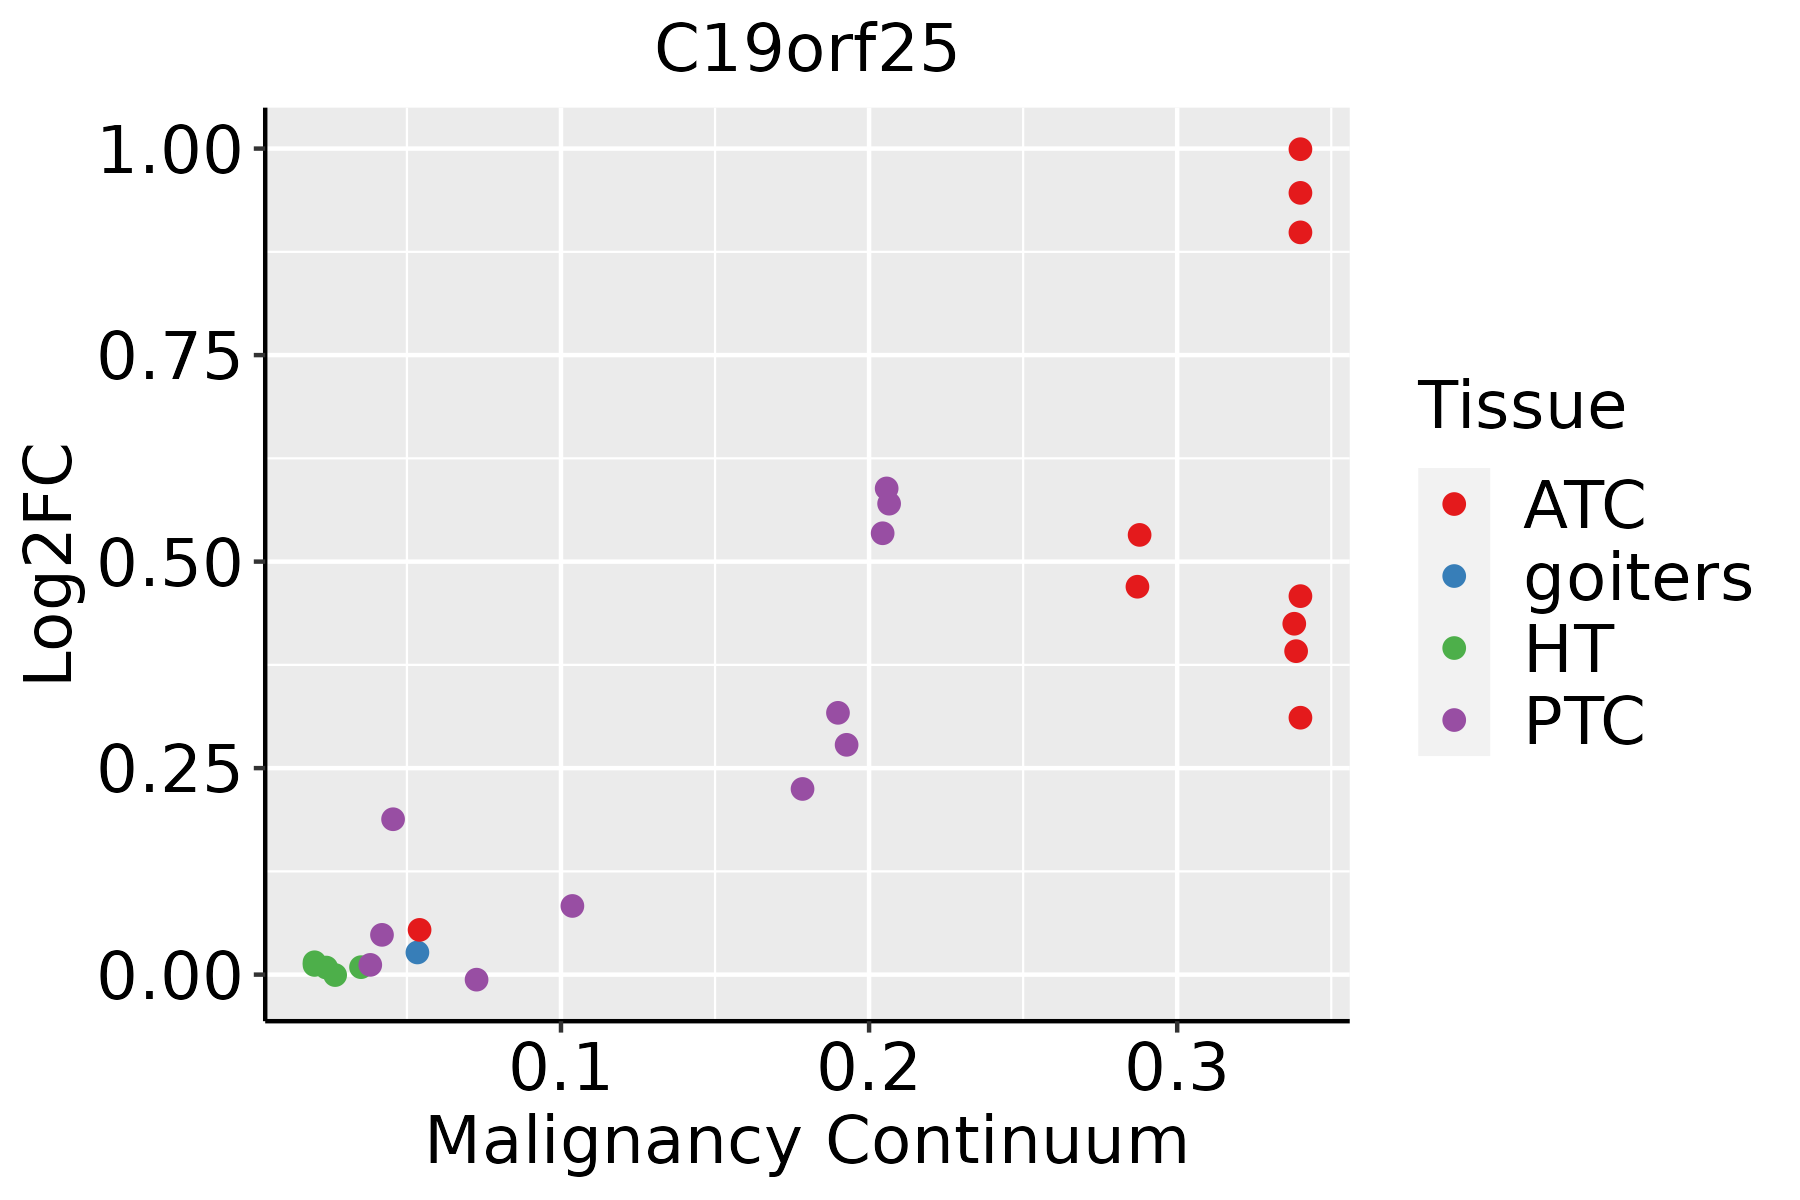 | ATC: Anaplastic thyroid cancer |
| HT: Hashimoto's thyroiditis | ||
| PTC: Papillary thyroid cancer |
| ∗log2FC in expression of this searched gene in stem-like cells from each diseased tissue sample relative to stem-like cells in normal samples in each tissue plotted against the malignancy continuum. Samples are colored based on if they are from different disease stage. |
Top |
Malignant transformation related pathway analysis |
| Find out the enriched GO biological processes and KEGG pathways involved in transition from healthy to precancer to cancer |
| Tissue | Disease Stage | Enriched GO biological Processes |
| Colorectum | AD |  |
| Colorectum | SER |  |
| Colorectum | MSS |  |
| Colorectum | MSI-H |  |
| Colorectum | FAP |  |
| ∗Top 15 enriched GO BP terms are showed in the bar plot of each disease state in each tissue. Each row represents a significant GO biological process which is colored according to the -log10(p.adjust). |
| Page: 1 2 3 4 5 6 7 8 9 |
| GO ID | Tissue | Disease Stage | Description | Gene Ratio | Bg Ratio | pvalue | p.adjust | Count |
| Page: 1 |
| Pathway ID | Tissue | Disease Stage | Description | Gene Ratio | Bg Ratio | pvalue | p.adjust | qvalue | Count |
| Page: 1 |
Top |
Cell-cell communication analysis |
| Identification of potential cell-cell interactions between two cell types and their ligand-receptor pairs for different disease states |
| Ligand | Receptor | LRpair | Pathway | Tissue | Disease Stage |
| Page: 1 |
Top |
Single-cell gene regulatory network inference analysis |
| Find out the significant the regulons (TFs) and the target genes of each regulon across cell types for different disease states |
| TF | Cell Type | Tissue | Disease Stage | Target Gene | RSS | Regulon Activity |
| ∗The dot plots of a searched regulon are shown for all cell subpopulations in each disease state of each tissue based on the regulon specific score inferred using pySCENIC and by calculating the average expression. |
| Page: 1 |
Top |
Somatic mutation of malignant transformation related genes |
| Annotation of somatic variants for genes involved in malignant transformation |
| Hugo Symbol | Variant Class | Variant Classification | dbSNP RS | HGVSc | HGVSp | HGVSp Short | SWISSPROT | BIOTYPE | SIFT | PolyPhen | Tumor Sample Barcode | Tissue | Histology | Sex | Age | Stage | Therapy Types | Drugs | Outcome |
| C19orf25 | SNV | Missense_Mutation | rs768708385 | c.296N>A | p.Arg99Gln | p.R99Q | Q9UFG5 | protein_coding | tolerated(0.8) | benign(0.001) | TCGA-CM-4746-01 | Colorectum | colon adenocarcinoma | Male | <65 | I/II | Unknown | Unknown | SD |
| C19orf25 | SNV | Missense_Mutation | rs748515428 | c.76G>T | p.Asp26Tyr | p.D26Y | Q9UFG5 | protein_coding | deleterious(0) | probably_damaging(0.986) | TCGA-69-7979-01 | Lung | lung adenocarcinoma | Female | >=65 | I/II | Unknown | Unknown | SD |
| C19orf25 | SNV | Missense_Mutation | novel | c.53N>T | p.Pro18Leu | p.P18L | Q9UFG5 | protein_coding | deleterious(0) | probably_damaging(0.999) | TCGA-90-A4ED-01 | Lung | lung squamous cell carcinoma | Male | >=65 | I/II | Unknown | Unknown | SD |
| C19orf25 | SNV | Missense_Mutation | novel | c.52N>T | p.Pro18Ser | p.P18S | Q9UFG5 | protein_coding | deleterious(0) | probably_damaging(0.999) | TCGA-90-A4ED-01 | Lung | lung squamous cell carcinoma | Male | >=65 | I/II | Unknown | Unknown | SD |
| C19orf25 | SNV | Missense_Mutation | novel | c.344N>T | p.Ala115Val | p.A115V | Q9UFG5 | protein_coding | deleterious(0.04) | benign(0.007) | TCGA-SW-A7EA-01 | Stomach | stomach adenocarcinoma | Female | <65 | I/II | Unknown | Unknown | SD |
| Page: 1 |
Top |
Related drugs of malignant transformation related genes |
| Identification of chemicals and drugs interact with genes involved in malignant transfromation |
| (DGIdb 4.0) |
| Entrez ID | Symbol | Category | Interaction Types | Drug Claim Name | Drug Name | PMIDs |
| Page: 1 |

Copyright 2023-Present -The University of Texas Health Science Center at Houston |