
|
|||||
|
 | |
| |
| |
| |
| |
| |
|
Gene: C18orf32 |
Gene summary for C18ORF32 |
| Gene information | Species | Human | Gene symbol | C18orf32 | Gene ID | 497661 |
| Gene name | chromosome 18 open reading frame 32 | |
| Gene Alias | C18orf32 | |
| Cytomap | 18q21.1 | |
| Gene Type | protein-coding | GO ID | GO:0007154 | UniProtAcc | Q8TCD1 |
Top |
Malignant transformation analysis |
| Identification of the aberrant gene expression in precancerous and cancerous lesions by comparing the gene expression of stem-like cells in diseased tissues with normal stem cells |
| Entrez ID | Symbol | Replicates | Species | Organ | Tissue | Adj P-value | Log2FC | Malignancy |
| 497661 | C18orf32 | LZE2T | Human | Esophagus | ESCC | 2.88e-04 | 6.38e-01 | 0.082 |
| 497661 | C18orf32 | LZE4T | Human | Esophagus | ESCC | 1.20e-27 | 6.81e-01 | 0.0811 |
| 497661 | C18orf32 | LZE5T | Human | Esophagus | ESCC | 2.72e-04 | 5.24e-01 | 0.0514 |
| 497661 | C18orf32 | LZE7T | Human | Esophagus | ESCC | 1.88e-21 | 1.22e+00 | 0.0667 |
| 497661 | C18orf32 | LZE8T | Human | Esophagus | ESCC | 5.14e-16 | 4.57e-01 | 0.067 |
| 497661 | C18orf32 | LZE20T | Human | Esophagus | ESCC | 1.68e-17 | 5.37e-01 | 0.0662 |
| 497661 | C18orf32 | LZE22D1 | Human | Esophagus | HGIN | 4.37e-17 | 6.88e-01 | 0.0595 |
| 497661 | C18orf32 | LZE22T | Human | Esophagus | ESCC | 3.51e-09 | 7.23e-01 | 0.068 |
| 497661 | C18orf32 | LZE24T | Human | Esophagus | ESCC | 2.47e-46 | 1.24e+00 | 0.0596 |
| 497661 | C18orf32 | LZE22D3 | Human | Esophagus | HGIN | 4.89e-04 | 5.71e-01 | 0.0653 |
| 497661 | C18orf32 | LZE21T | Human | Esophagus | ESCC | 6.60e-07 | 3.73e-01 | 0.0655 |
| 497661 | C18orf32 | LZE6T | Human | Esophagus | ESCC | 1.42e-19 | 7.48e-01 | 0.0845 |
| 497661 | C18orf32 | P1T-E | Human | Esophagus | ESCC | 2.23e-27 | 1.38e+00 | 0.0875 |
| 497661 | C18orf32 | P2T-E | Human | Esophagus | ESCC | 4.04e-57 | 9.46e-01 | 0.1177 |
| 497661 | C18orf32 | P4T-E | Human | Esophagus | ESCC | 3.35e-74 | 1.44e+00 | 0.1323 |
| 497661 | C18orf32 | P5T-E | Human | Esophagus | ESCC | 1.24e-36 | 6.64e-01 | 0.1327 |
| 497661 | C18orf32 | P8T-E | Human | Esophagus | ESCC | 1.07e-74 | 1.09e+00 | 0.0889 |
| 497661 | C18orf32 | P9T-E | Human | Esophagus | ESCC | 2.32e-66 | 1.33e+00 | 0.1131 |
| 497661 | C18orf32 | P10T-E | Human | Esophagus | ESCC | 2.35e-62 | 9.16e-01 | 0.116 |
| 497661 | C18orf32 | P11T-E | Human | Esophagus | ESCC | 1.03e-28 | 1.01e+00 | 0.1426 |
| Page: 1 2 3 4 5 6 |
| Tissue | Expression Dynamics | Abbreviation |
| Esophagus | 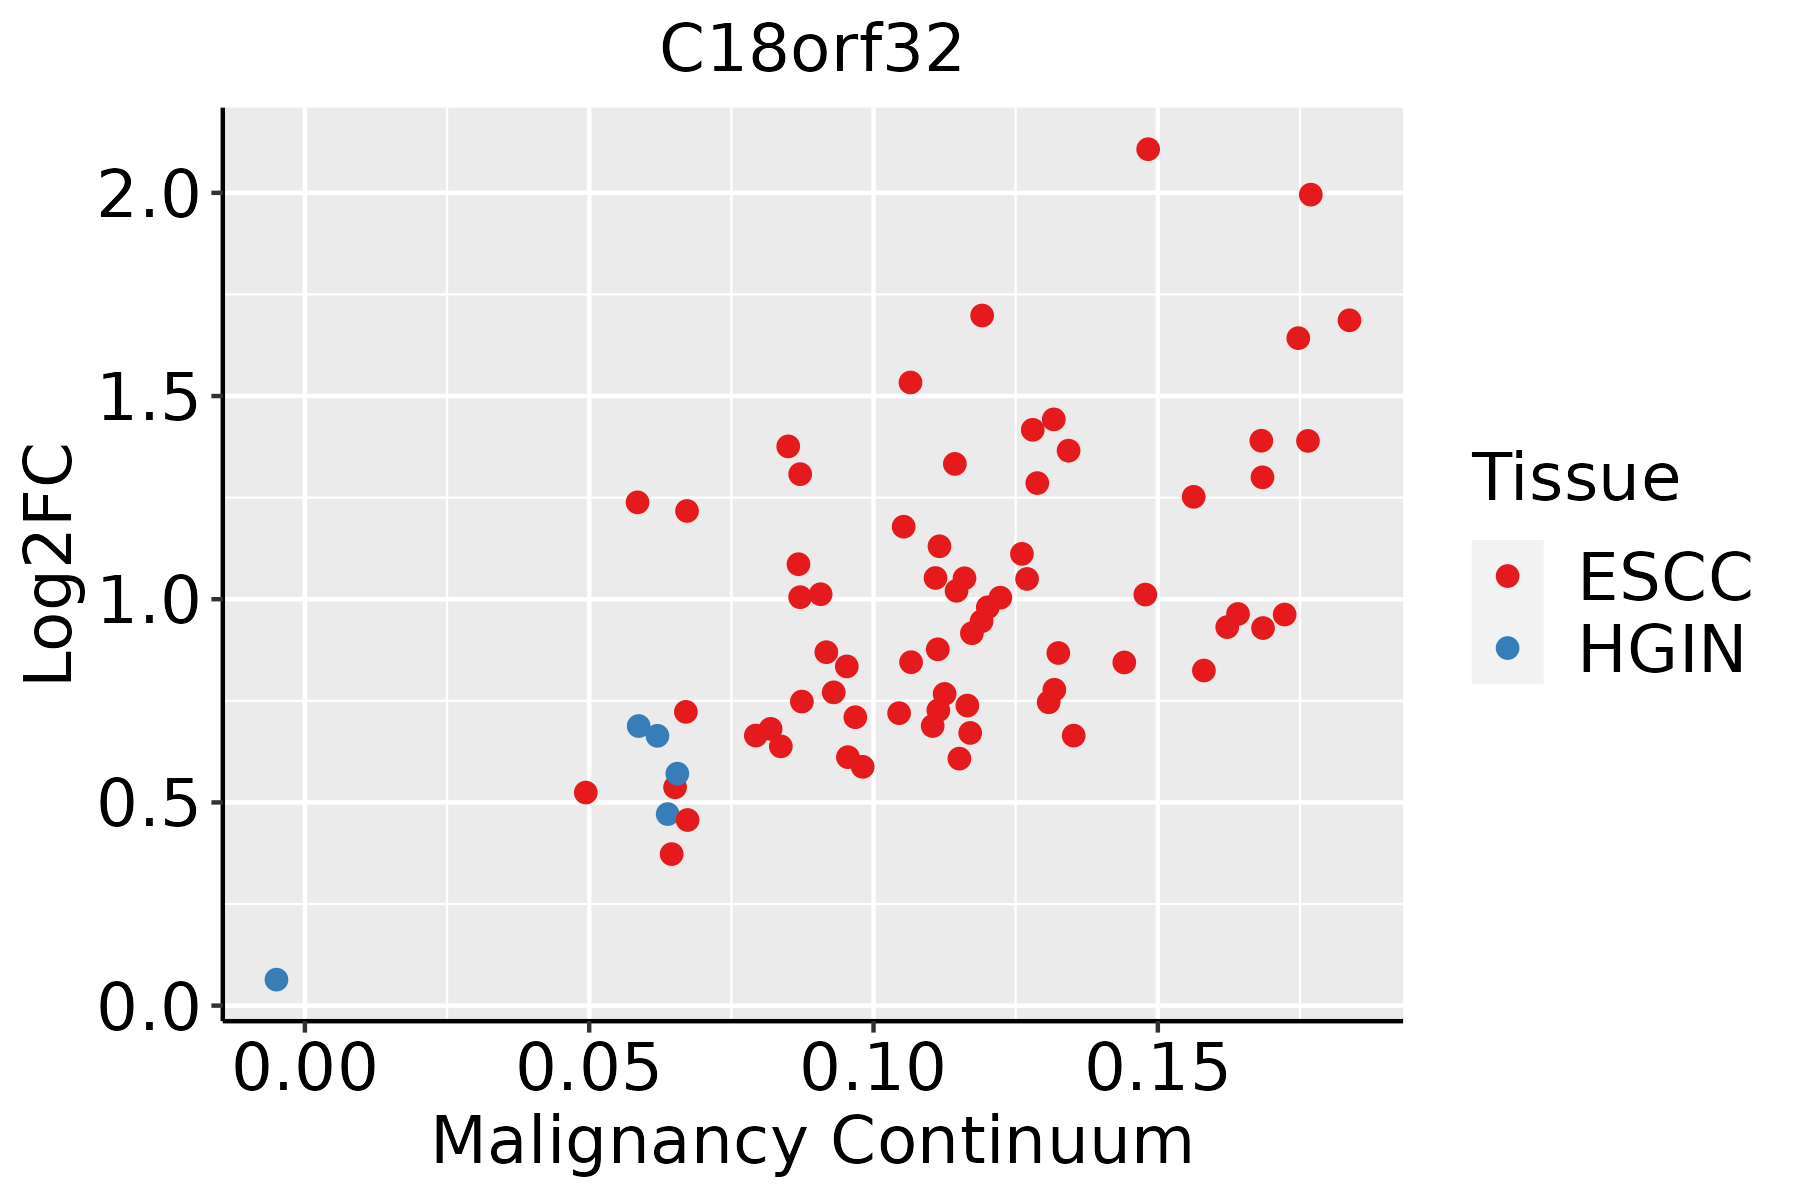 | ESCC: Esophageal squamous cell carcinoma |
| HGIN: High-grade intraepithelial neoplasias | ||
| LGIN: Low-grade intraepithelial neoplasias | ||
| GC |  | CAG: Chronic atrophic gastritis |
| CAG with IM: Chronic atrophic gastritis with intestinal metaplasia | ||
| CSG: Chronic superficial gastritis | ||
| GC: Gastric cancer | ||
| SIM: Severe intestinal metaplasia | ||
| WIM: Wild intestinal metaplasia | ||
| Liver |  | HCC: Hepatocellular carcinoma |
| NAFLD: Non-alcoholic fatty liver disease | ||
| Thyroid |  | ATC: Anaplastic thyroid cancer |
| HT: Hashimoto's thyroiditis | ||
| PTC: Papillary thyroid cancer |
| ∗log2FC in expression of this searched gene in stem-like cells from each diseased tissue sample relative to stem-like cells in normal samples in each tissue plotted against the malignancy continuum. Samples are colored based on if they are from different disease stage. |
Top |
Malignant transformation related pathway analysis |
| Find out the enriched GO biological processes and KEGG pathways involved in transition from healthy to precancer to cancer |
| Tissue | Disease Stage | Enriched GO biological Processes |
| Colorectum | AD |  |
| Colorectum | SER |  |
| Colorectum | MSS |  |
| Colorectum | MSI-H |  |
| Colorectum | FAP |  |
| ∗Top 15 enriched GO BP terms are showed in the bar plot of each disease state in each tissue. Each row represents a significant GO biological process which is colored according to the -log10(p.adjust). |
| Page: 1 2 3 4 5 6 7 8 9 |
| GO ID | Tissue | Disease Stage | Description | Gene Ratio | Bg Ratio | pvalue | p.adjust | Count |
| GO:004312220 | Esophagus | HGIN | regulation of I-kappaB kinase/NF-kappaB signaling | 63/2587 | 249/18723 | 8.91e-07 | 3.61e-05 | 63 |
| GO:000724918 | Esophagus | HGIN | I-kappaB kinase/NF-kappaB signaling | 67/2587 | 281/18723 | 3.84e-06 | 1.29e-04 | 67 |
| GO:004312317 | Esophagus | HGIN | positive regulation of I-kappaB kinase/NF-kappaB signaling | 49/2587 | 186/18723 | 4.22e-06 | 1.40e-04 | 49 |
| GO:004312318 | Esophagus | ESCC | positive regulation of I-kappaB kinase/NF-kappaB signaling | 132/8552 | 186/18723 | 2.07e-12 | 8.58e-11 | 132 |
| GO:0043122110 | Esophagus | ESCC | regulation of I-kappaB kinase/NF-kappaB signaling | 167/8552 | 249/18723 | 6.11e-12 | 2.32e-10 | 167 |
| GO:000724919 | Esophagus | ESCC | I-kappaB kinase/NF-kappaB signaling | 183/8552 | 281/18723 | 3.02e-11 | 1.01e-09 | 183 |
| GO:00072494 | Liver | Cirrhotic | I-kappaB kinase/NF-kappaB signaling | 108/4634 | 281/18723 | 2.21e-07 | 5.64e-06 | 108 |
| GO:00431225 | Liver | Cirrhotic | regulation of I-kappaB kinase/NF-kappaB signaling | 95/4634 | 249/18723 | 1.68e-06 | 3.22e-05 | 95 |
| GO:00431234 | Liver | Cirrhotic | positive regulation of I-kappaB kinase/NF-kappaB signaling | 71/4634 | 186/18723 | 3.20e-05 | 3.97e-04 | 71 |
| GO:000724912 | Liver | HCC | I-kappaB kinase/NF-kappaB signaling | 156/7958 | 281/18723 | 6.66e-06 | 8.00e-05 | 156 |
| GO:004312312 | Liver | HCC | positive regulation of I-kappaB kinase/NF-kappaB signaling | 108/7958 | 186/18723 | 1.28e-05 | 1.43e-04 | 108 |
| GO:004312212 | Liver | HCC | regulation of I-kappaB kinase/NF-kappaB signaling | 138/7958 | 249/18723 | 2.47e-05 | 2.58e-04 | 138 |
| GO:00431224 | Stomach | GC | regulation of I-kappaB kinase/NF-kappaB signaling | 30/1159 | 249/18723 | 3.67e-04 | 5.70e-03 | 30 |
| GO:00072493 | Stomach | GC | I-kappaB kinase/NF-kappaB signaling | 31/1159 | 281/18723 | 1.31e-03 | 1.46e-02 | 31 |
| GO:00431233 | Stomach | GC | positive regulation of I-kappaB kinase/NF-kappaB signaling | 22/1159 | 186/18723 | 2.66e-03 | 2.46e-02 | 22 |
| GO:004312211 | Stomach | CAG with IM | regulation of I-kappaB kinase/NF-kappaB signaling | 29/1050 | 249/18723 | 1.58e-04 | 3.07e-03 | 29 |
| GO:000724911 | Stomach | CAG with IM | I-kappaB kinase/NF-kappaB signaling | 30/1050 | 281/18723 | 5.53e-04 | 8.18e-03 | 30 |
| GO:004312311 | Stomach | CAG with IM | positive regulation of I-kappaB kinase/NF-kappaB signaling | 22/1050 | 186/18723 | 7.61e-04 | 1.03e-02 | 22 |
| GO:004312221 | Stomach | CSG | regulation of I-kappaB kinase/NF-kappaB signaling | 29/1034 | 249/18723 | 1.21e-04 | 2.58e-03 | 29 |
| GO:000724921 | Stomach | CSG | I-kappaB kinase/NF-kappaB signaling | 30/1034 | 281/18723 | 4.30e-04 | 6.76e-03 | 30 |
| Page: 1 2 |
| Pathway ID | Tissue | Disease Stage | Description | Gene Ratio | Bg Ratio | pvalue | p.adjust | qvalue | Count |
| Page: 1 |
Top |
Cell-cell communication analysis |
| Identification of potential cell-cell interactions between two cell types and their ligand-receptor pairs for different disease states |
| Ligand | Receptor | LRpair | Pathway | Tissue | Disease Stage |
| Page: 1 |
Top |
Single-cell gene regulatory network inference analysis |
| Find out the significant the regulons (TFs) and the target genes of each regulon across cell types for different disease states |
| TF | Cell Type | Tissue | Disease Stage | Target Gene | RSS | Regulon Activity |
| ∗The dot plots of a searched regulon are shown for all cell subpopulations in each disease state of each tissue based on the regulon specific score inferred using pySCENIC and by calculating the average expression. |
| Page: 1 |
Top |
Somatic mutation of malignant transformation related genes |
| Annotation of somatic variants for genes involved in malignant transformation |
| Hugo Symbol | Variant Class | Variant Classification | dbSNP RS | HGVSc | HGVSp | HGVSp Short | SWISSPROT | BIOTYPE | SIFT | PolyPhen | Tumor Sample Barcode | Tissue | Histology | Sex | Age | Stage | Therapy Types | Drugs | Outcome |
| C18orf32 | insertion | Frame_Shift_Ins | novel | c.182_183insCTAC | p.Leu62TyrfsTer12 | p.L62Yfs*12 | Q8TCD1 | protein_coding | TCGA-A7-A26I-01 | Breast | breast invasive carcinoma | Female | >=65 | I/II | Chemotherapy | cytoxan | SD | ||
| C18orf32 | SNV | Missense_Mutation | novel | c.130T>C | p.Ser44Pro | p.S44P | Q8TCD1 | protein_coding | tolerated(0.14) | benign(0.001) | TCGA-AG-A002-01 | Colorectum | rectum adenocarcinoma | Male | <65 | I/II | Unknown | Unknown | SD |
| C18orf32 | SNV | Missense_Mutation | rs11537626 | c.110C>A | p.Pro37His | p.P37H | Q8TCD1 | protein_coding | deleterious(0) | possibly_damaging(0.891) | TCGA-AP-A1DK-01 | Endometrium | uterine corpus endometrioid carcinoma | Female | <65 | I/II | Unknown | Unknown | SD |
| C18orf32 | SNV | Missense_Mutation | rs201224790 | c.100N>T | p.Arg34Cys | p.R34C | Q8TCD1 | protein_coding | tolerated(0.09) | probably_damaging(0.953) | TCGA-B5-A11Y-01 | Endometrium | uterine corpus endometrioid carcinoma | Female | <65 | I/II | Unknown | Unknown | SD |
| C18orf32 | SNV | Missense_Mutation | rs747588792 | c.22N>A | p.Val8Ile | p.V8I | Q8TCD1 | protein_coding | tolerated(0.1) | probably_damaging(0.996) | TCGA-EO-A22U-01 | Endometrium | uterine corpus endometrioid carcinoma | Female | >=65 | I/II | Unknown | Unknown | SD |
| C18orf32 | SNV | Missense_Mutation | novel | c.146N>C | p.Lys49Thr | p.K49T | Q8TCD1 | protein_coding | tolerated(0.21) | benign(0.005) | TCGA-FI-A2D0-01 | Endometrium | uterine corpus endometrioid carcinoma | Female | <65 | I/II | Unknown | Unknown | SD |
| C18orf32 | SNV | Missense_Mutation | c.89N>T | p.Pro30Leu | p.P30L | Q8TCD1 | protein_coding | deleterious(0) | probably_damaging(1) | TCGA-44-8117-01 | Lung | lung adenocarcinoma | Female | <65 | I/II | Chemotherapy | cisplatin | CR |
| Page: 1 |
Top |
Related drugs of malignant transformation related genes |
| Identification of chemicals and drugs interact with genes involved in malignant transfromation |
| (DGIdb 4.0) |
| Entrez ID | Symbol | Category | Interaction Types | Drug Claim Name | Drug Name | PMIDs |
| Page: 1 |

Copyright 2023-Present -The University of Texas Health Science Center at Houston |