
|
|||||
|
 | |
| |
| |
| |
| |
| |
|
Gene: C18orf25 |
Gene summary for C18ORF25 |
| Gene information | Species | Human | Gene symbol | C18orf25 | Gene ID | 147339 |
| Gene name | chromosome 18 open reading frame 25 | |
| Gene Alias | ARKL1 | |
| Cytomap | 18q21.1 | |
| Gene Type | protein-coding | GO ID | GO:0006464 | UniProtAcc | Q96B23 |
Top |
Malignant transformation analysis |
| Identification of the aberrant gene expression in precancerous and cancerous lesions by comparing the gene expression of stem-like cells in diseased tissues with normal stem cells |
| Entrez ID | Symbol | Replicates | Species | Organ | Tissue | Adj P-value | Log2FC | Malignancy |
| 147339 | C18orf25 | LZE4T | Human | Esophagus | ESCC | 2.58e-07 | 1.79e-01 | 0.0811 |
| 147339 | C18orf25 | LZE7T | Human | Esophagus | ESCC | 5.46e-05 | 2.88e-01 | 0.0667 |
| 147339 | C18orf25 | LZE20T | Human | Esophagus | ESCC | 3.27e-03 | 9.05e-02 | 0.0662 |
| 147339 | C18orf25 | LZE24T | Human | Esophagus | ESCC | 9.77e-09 | 1.63e-01 | 0.0596 |
| 147339 | C18orf25 | P1T-E | Human | Esophagus | ESCC | 2.58e-11 | 3.52e-01 | 0.0875 |
| 147339 | C18orf25 | P2T-E | Human | Esophagus | ESCC | 2.05e-21 | 2.94e-01 | 0.1177 |
| 147339 | C18orf25 | P4T-E | Human | Esophagus | ESCC | 1.98e-22 | 3.97e-01 | 0.1323 |
| 147339 | C18orf25 | P5T-E | Human | Esophagus | ESCC | 1.96e-11 | 1.28e-01 | 0.1327 |
| 147339 | C18orf25 | P8T-E | Human | Esophagus | ESCC | 2.01e-15 | 2.56e-01 | 0.0889 |
| 147339 | C18orf25 | P9T-E | Human | Esophagus | ESCC | 9.53e-20 | 4.00e-01 | 0.1131 |
| 147339 | C18orf25 | P10T-E | Human | Esophagus | ESCC | 1.58e-16 | 2.50e-01 | 0.116 |
| 147339 | C18orf25 | P11T-E | Human | Esophagus | ESCC | 2.46e-06 | 2.17e-01 | 0.1426 |
| 147339 | C18orf25 | P12T-E | Human | Esophagus | ESCC | 3.67e-16 | 1.73e-01 | 0.1122 |
| 147339 | C18orf25 | P15T-E | Human | Esophagus | ESCC | 8.09e-10 | 1.73e-01 | 0.1149 |
| 147339 | C18orf25 | P16T-E | Human | Esophagus | ESCC | 2.52e-07 | 1.17e-01 | 0.1153 |
| 147339 | C18orf25 | P17T-E | Human | Esophagus | ESCC | 2.05e-03 | 1.60e-01 | 0.1278 |
| 147339 | C18orf25 | P19T-E | Human | Esophagus | ESCC | 9.91e-04 | 2.82e-01 | 0.1662 |
| 147339 | C18orf25 | P20T-E | Human | Esophagus | ESCC | 4.08e-10 | 1.70e-01 | 0.1124 |
| 147339 | C18orf25 | P21T-E | Human | Esophagus | ESCC | 1.07e-12 | 1.51e-01 | 0.1617 |
| 147339 | C18orf25 | P22T-E | Human | Esophagus | ESCC | 2.75e-10 | 1.98e-01 | 0.1236 |
| Page: 1 2 3 4 5 |
| Tissue | Expression Dynamics | Abbreviation |
| Esophagus | 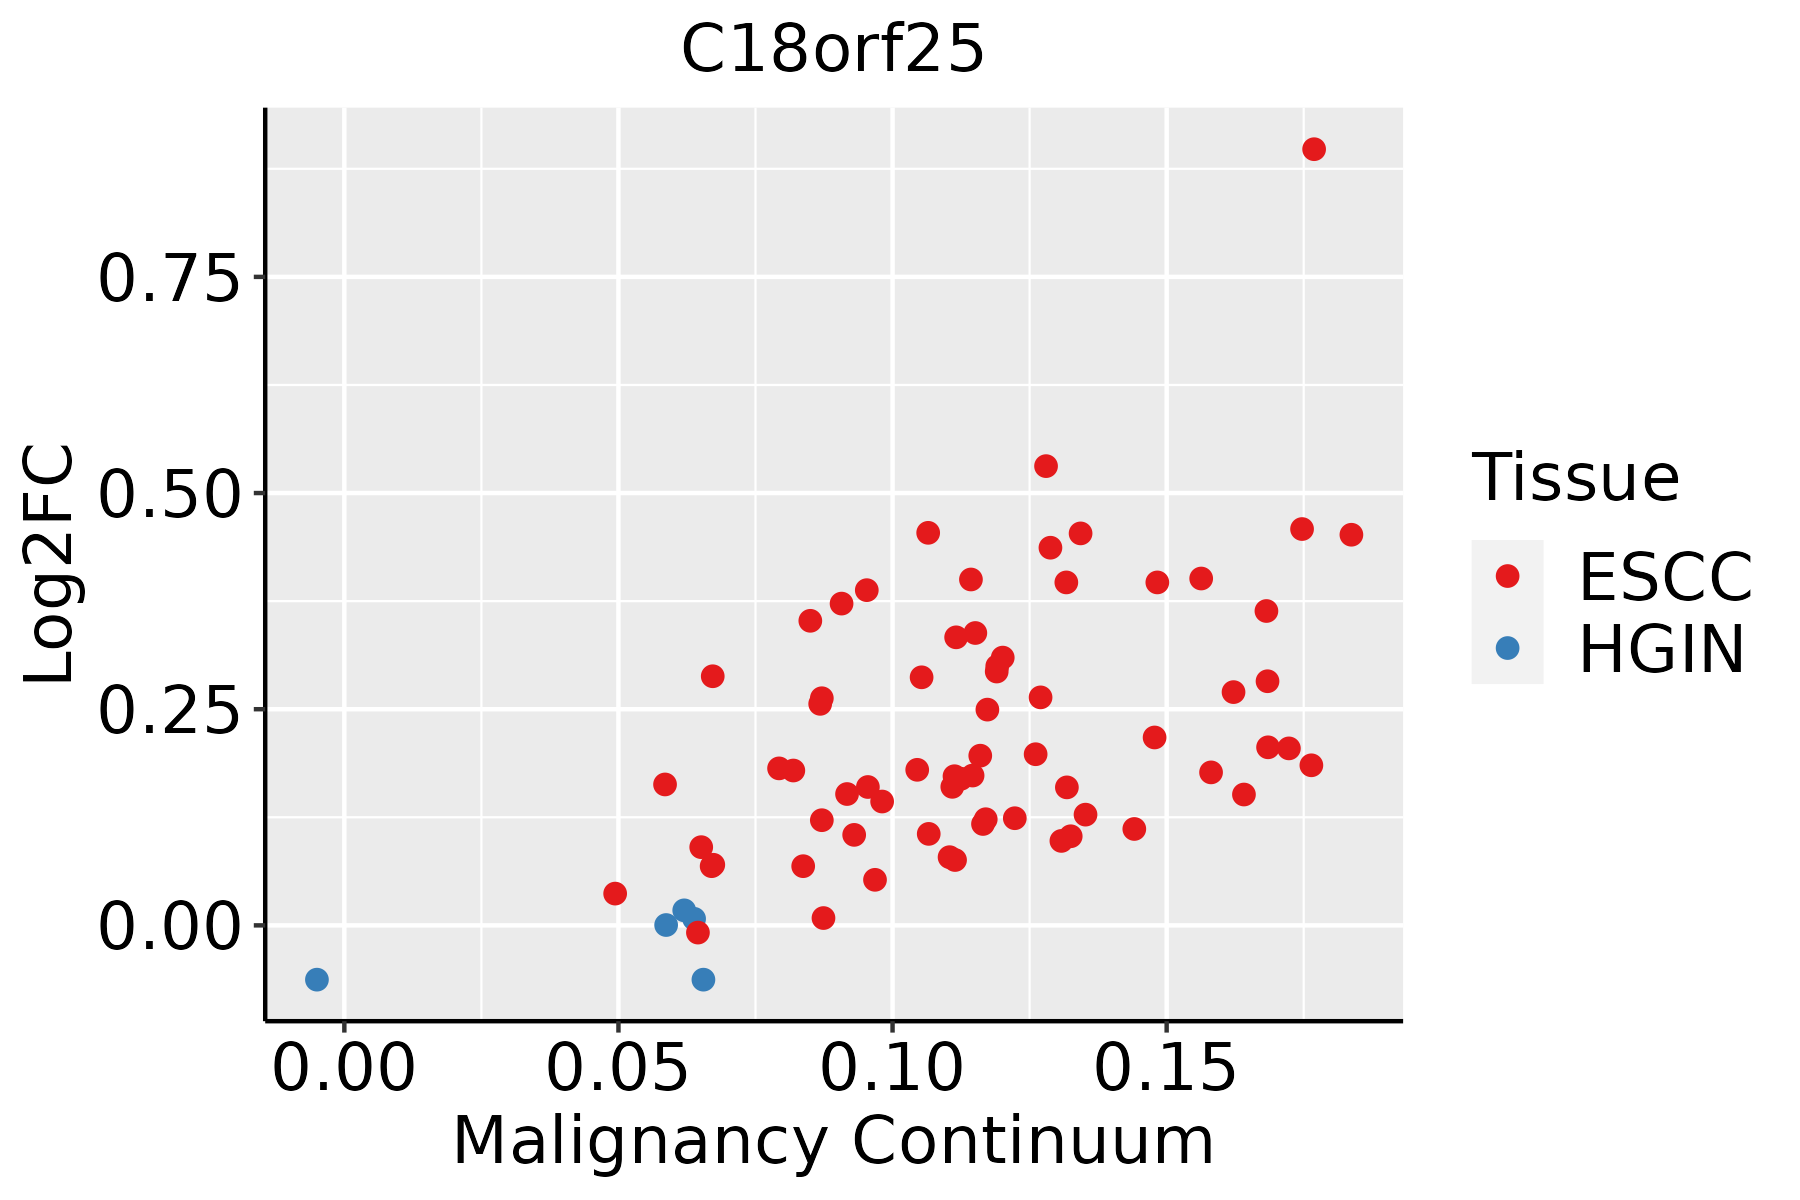 | ESCC: Esophageal squamous cell carcinoma |
| HGIN: High-grade intraepithelial neoplasias | ||
| LGIN: Low-grade intraepithelial neoplasias | ||
| Oral Cavity |  | EOLP: Erosive Oral lichen planus |
| LP: leukoplakia | ||
| NEOLP: Non-erosive oral lichen planus | ||
| OSCC: Oral squamous cell carcinoma | ||
| Thyroid | 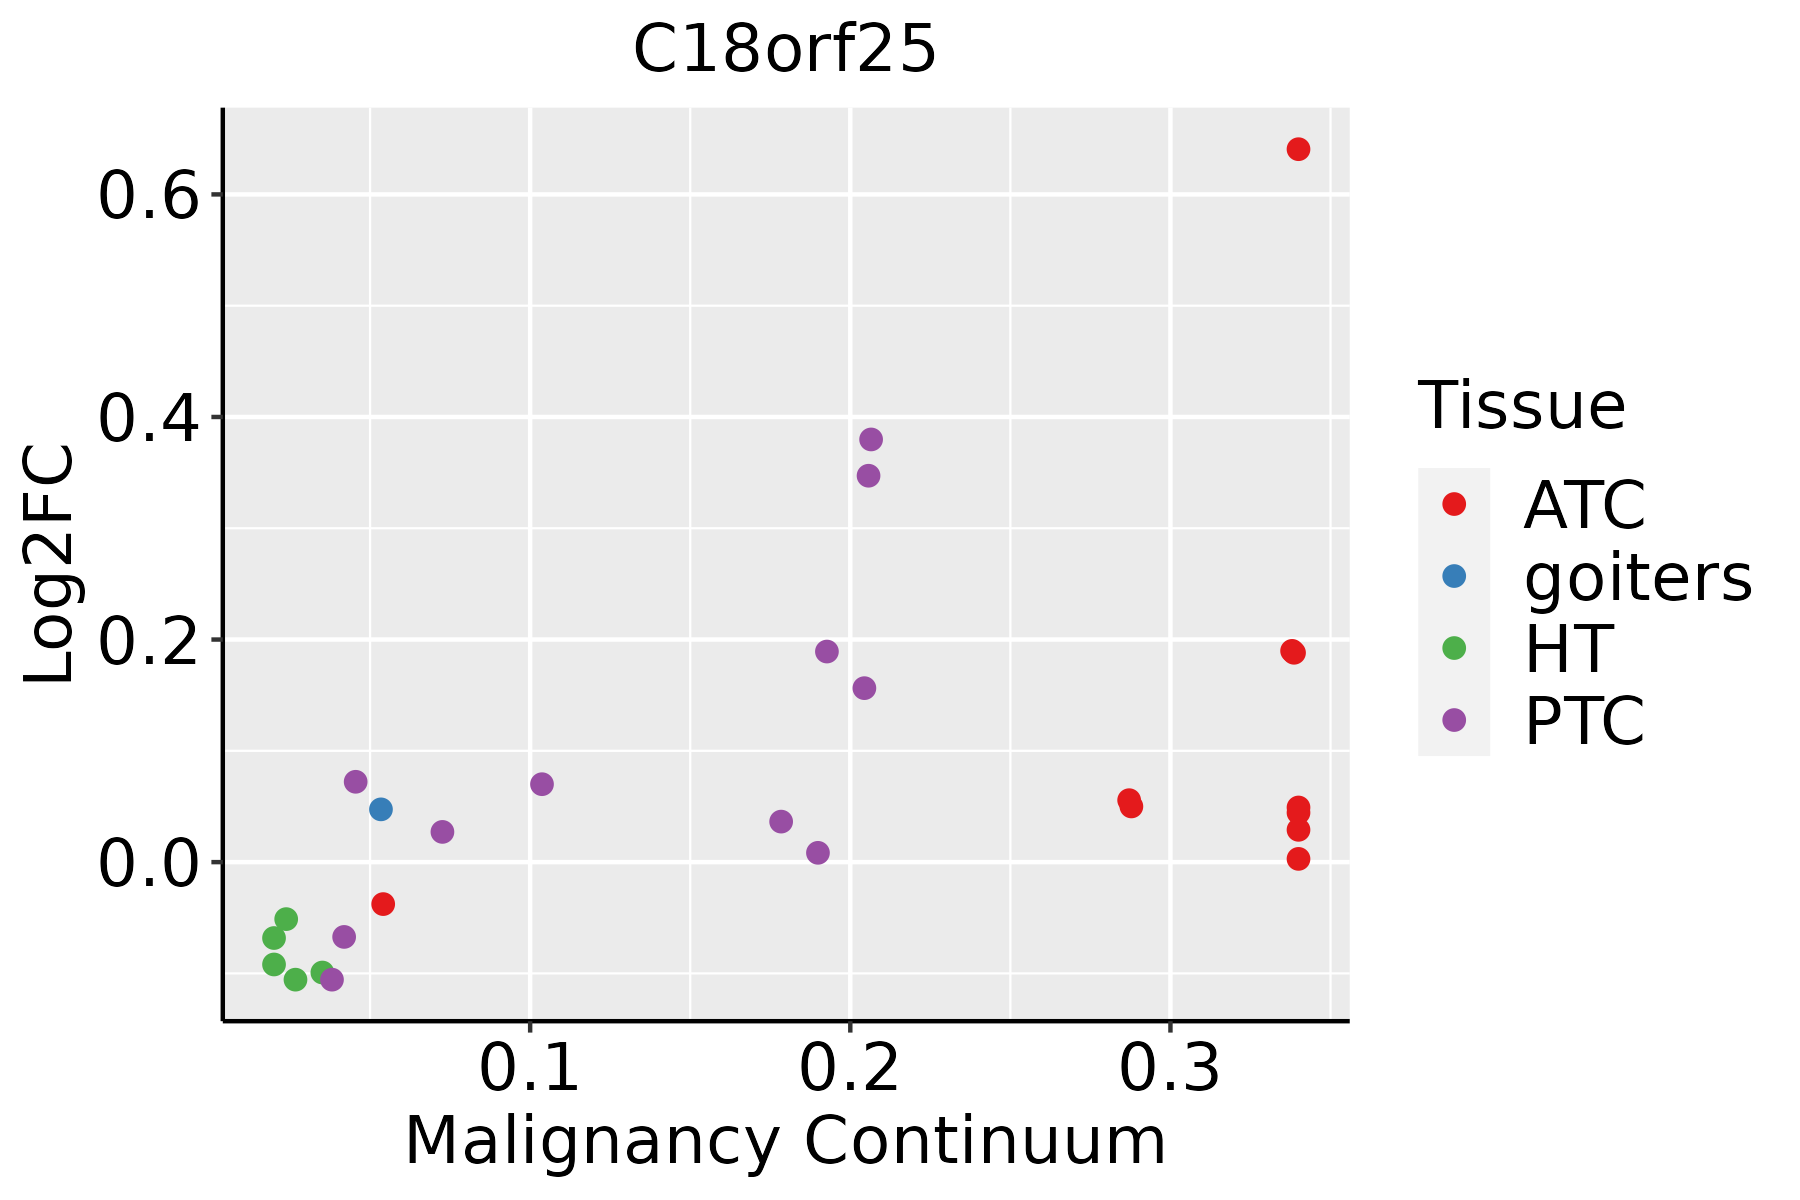 | ATC: Anaplastic thyroid cancer |
| HT: Hashimoto's thyroiditis | ||
| PTC: Papillary thyroid cancer |
| ∗log2FC in expression of this searched gene in stem-like cells from each diseased tissue sample relative to stem-like cells in normal samples in each tissue plotted against the malignancy continuum. Samples are colored based on if they are from different disease stage. |
Top |
Malignant transformation related pathway analysis |
| Find out the enriched GO biological processes and KEGG pathways involved in transition from healthy to precancer to cancer |
| Tissue | Disease Stage | Enriched GO biological Processes |
| Colorectum | AD |  |
| Colorectum | SER |  |
| Colorectum | MSS |  |
| Colorectum | MSI-H |  |
| Colorectum | FAP |  |
| ∗Top 15 enriched GO BP terms are showed in the bar plot of each disease state in each tissue. Each row represents a significant GO biological process which is colored according to the -log10(p.adjust). |
| Page: 1 2 3 4 5 6 7 8 9 |
| GO ID | Tissue | Disease Stage | Description | Gene Ratio | Bg Ratio | pvalue | p.adjust | Count |
| Page: 1 |
| Pathway ID | Tissue | Disease Stage | Description | Gene Ratio | Bg Ratio | pvalue | p.adjust | qvalue | Count |
| Page: 1 |
Top |
Cell-cell communication analysis |
| Identification of potential cell-cell interactions between two cell types and their ligand-receptor pairs for different disease states |
| Ligand | Receptor | LRpair | Pathway | Tissue | Disease Stage |
| Page: 1 |
Top |
Single-cell gene regulatory network inference analysis |
| Find out the significant the regulons (TFs) and the target genes of each regulon across cell types for different disease states |
| TF | Cell Type | Tissue | Disease Stage | Target Gene | RSS | Regulon Activity |
| ∗The dot plots of a searched regulon are shown for all cell subpopulations in each disease state of each tissue based on the regulon specific score inferred using pySCENIC and by calculating the average expression. |
| Page: 1 |
Top |
Somatic mutation of malignant transformation related genes |
| Annotation of somatic variants for genes involved in malignant transformation |
| Hugo Symbol | Variant Class | Variant Classification | dbSNP RS | HGVSc | HGVSp | HGVSp Short | SWISSPROT | BIOTYPE | SIFT | PolyPhen | Tumor Sample Barcode | Tissue | Histology | Sex | Age | Stage | Therapy Types | Drugs | Outcome |
| C18orf25 | deletion | Frame_Shift_Del | novel | c.24_45delAAAAGTTGAAGAACTCATTGAG | p.Lys9ProfsTer20 | p.K9Pfs*20 | protein_coding | TCGA-D8-A1JG-01 | Breast | breast invasive carcinoma | Female | <65 | I/II | Chemotherapy | doxorubicin | SD | |||
| C18orf25 | SNV | Missense_Mutation | novel | c.1171N>C | p.Asp391His | p.D391H | protein_coding | deleterious(0) | probably_damaging(1) | TCGA-HM-A4S6-01 | Cervix | cervical & endocervical cancer | Female | <65 | III/IV | Chemotherapy | cisplatin | CR | |
| C18orf25 | SNV | Missense_Mutation | novel | c.304C>T | p.His102Tyr | p.H102Y | protein_coding | deleterious(0) | probably_damaging(0.972) | TCGA-IR-A3LH-01 | Cervix | cervical & endocervical cancer | Female | <65 | I/II | Chemotherapy | cisplatin | CR | |
| C18orf25 | SNV | Missense_Mutation | novel | c.1031N>C | p.Val344Ala | p.V344A | protein_coding | tolerated(0.6) | benign(0.007) | TCGA-A6-3809-01 | Colorectum | colon adenocarcinoma | Female | >=65 | I/II | Unknown | Unknown | SD | |
| C18orf25 | SNV | Missense_Mutation | novel | c.165N>T | p.Met55Ile | p.M55I | protein_coding | deleterious(0) | possibly_damaging(0.525) | TCGA-AM-5820-01 | Colorectum | colon adenocarcinoma | Female | <65 | I/II | Unknown | Unknown | SD | |
| C18orf25 | SNV | Missense_Mutation | rs751507829 | c.977N>T | p.Ala326Val | p.A326V | protein_coding | tolerated(0.18) | possibly_damaging(0.49) | TCGA-AZ-4313-01 | Colorectum | colon adenocarcinoma | Female | <65 | I/II | Unknown | Unknown | SD | |
| C18orf25 | SNV | Missense_Mutation | novel | c.278N>A | p.Cys93Tyr | p.C93Y | protein_coding | deleterious(0.01) | probably_damaging(0.964) | TCGA-G4-6628-01 | Colorectum | colon adenocarcinoma | Male | >=65 | I/II | Unknown | Unknown | SD | |
| C18orf25 | SNV | Missense_Mutation | novel | c.262G>T | p.Asp88Tyr | p.D88Y | protein_coding | deleterious(0) | probably_damaging(1) | TCGA-AG-A002-01 | Colorectum | rectum adenocarcinoma | Male | <65 | I/II | Unknown | Unknown | SD | |
| C18orf25 | insertion | In_Frame_Ins | novel | c.163_164insCTT | p.Met55delinsThrLeu | p.M55delinsTL | protein_coding | TCGA-AM-5820-01 | Colorectum | colon adenocarcinoma | Female | <65 | I/II | Unknown | Unknown | SD | |||
| C18orf25 | insertion | In_Frame_Ins | novel | c.1175_1176insCAGTTGTACTTA | p.Leu392_Thr393insSerCysThrTyr | p.L392_T393insSCTY | protein_coding | TCGA-AM-5820-01 | Colorectum | colon adenocarcinoma | Female | <65 | I/II | Unknown | Unknown | SD |
| Page: 1 2 3 4 |
Top |
Related drugs of malignant transformation related genes |
| Identification of chemicals and drugs interact with genes involved in malignant transfromation |
| (DGIdb 4.0) |
| Entrez ID | Symbol | Category | Interaction Types | Drug Claim Name | Drug Name | PMIDs |
| Page: 1 |

Copyright 2023-Present -The University of Texas Health Science Center at Houston |