Schematic overview of the cellular and molecular mechanisms involved in the cancer progression, including the proposed cellular and molecular mechanisms in cancer cells trajectory. AT1: alveolar type 1 cells; AT2: alveolar type 2 cells; AAH: atypical adenomatous hyperplasia; AIS: adenocarcinoma in situ; MIA: minimally invasive adenocarcinoma; IA: invasive adenocarcinoma; EMT: epithelial-mesenchymal transition

Home

Download

Statistics

Help

Contact

Center for Computational Systems Medicine
leaf

Gene summary

leaf

Malignant transformation analysis

leaf

Malignant transformation related pathway analysis

leaf

Cell-cell communication analysis

leaf

Single-cell gene regulatory network inference analysis

leaf

Somatic mutation of malignant transformation related genes

leaf

Related drugs of malignant transformation related genes

Gene: C17orf75

Gene summary for C17ORF75

check button Gene summary.

Gene informationSpeciesHuman
Gene symbol

C17orf75

Gene ID

64149

Gene namechromosome 17 open reading frame 75
Gene AliasNJMU-R1
Cytomap17q11.2
Gene Typeprotein-coding
GO ID

GO:0006810

UniProtAcc

Q9HAS0


Top

Malignant transformation analysis

check button Identification of the aberrant gene expression in precancerous and cancerous lesions by comparing the gene expression of stem-like cells in diseased tissues with normal stem cells
check button Malignant transformation involving gene list.
Entrez IDSymbolReplicatesSpeciesOrganTissueAdj P-valueLog2FCMalignancy
64149C17orf75GSM4909293HumanBreastIDC1.24e-345.25e-010.1581
64149C17orf75M2HumanBreastIDC1.94e-035.08e-010.21
64149C17orf75P2HumanBreastIDC4.65e-135.71e-010.21
64149C17orf75DCIS2HumanBreastDCIS1.43e-218.45e-020.0085
64149C17orf75LZE2THumanEsophagusESCC1.62e-056.55e-010.082
64149C17orf75LZE4THumanEsophagusESCC2.51e-072.31e-010.0811
64149C17orf75LZE5THumanEsophagusESCC9.33e-043.49e-010.0514
64149C17orf75LZE7THumanEsophagusESCC3.34e-073.11e-010.0667
64149C17orf75LZE8THumanEsophagusESCC2.40e-021.50e-010.067
64149C17orf75LZE24THumanEsophagusESCC3.81e-174.10e-010.0596
64149C17orf75LZE21THumanEsophagusESCC3.98e-021.91e-010.0655
64149C17orf75LZE6THumanEsophagusESCC2.51e-093.00e-010.0845
64149C17orf75P1T-EHumanEsophagusESCC3.58e-032.91e-010.0875
64149C17orf75P2T-EHumanEsophagusESCC6.68e-336.36e-010.1177
64149C17orf75P4T-EHumanEsophagusESCC1.72e-205.30e-010.1323
64149C17orf75P5T-EHumanEsophagusESCC1.02e-192.71e-010.1327
64149C17orf75P8T-EHumanEsophagusESCC4.32e-213.06e-010.0889
64149C17orf75P9T-EHumanEsophagusESCC1.78e-102.57e-010.1131
64149C17orf75P10T-EHumanEsophagusESCC2.56e-151.52e-010.116
64149C17orf75P11T-EHumanEsophagusESCC9.82e-072.40e-010.1426
Page: 1 2 3 4 5 

check button Transcriptomic changes along malignancy continuum.
TissueExpression DynamicsAbbreviation
BreastThe image shows the transcriptomic changes along malignancy continuum.log2FC in expression of this searched gene in stem-like cells from each diseased tissue sample relative to stem-like cells in normal samples in each tissue plotted against the malignancy continuum. Samples are colored based on if they are from different disease stage.
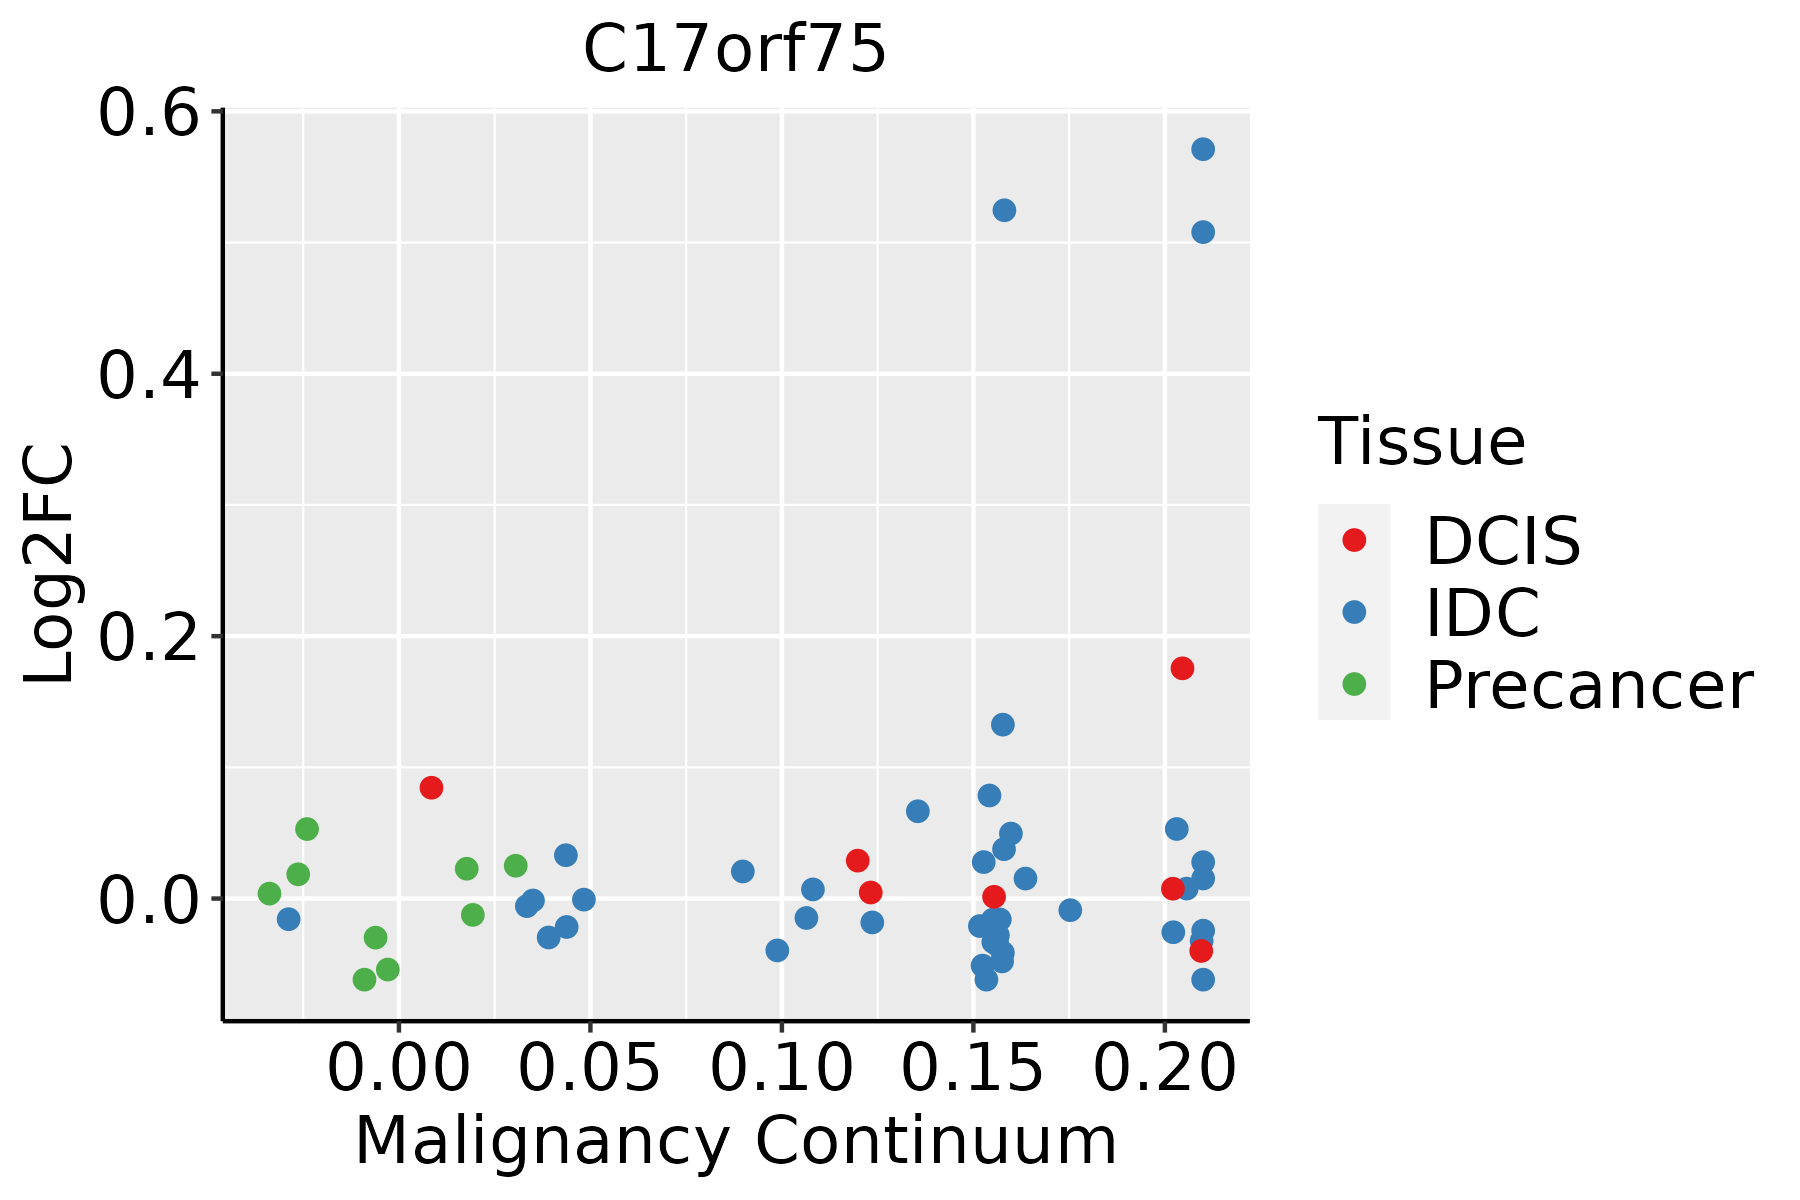
IDC: Invasive ductal carcinoma
DCIS: Ductal carcinoma in situ
Precancer(BRCA1-mut): Precancerous lesion from BRCA1 mutation carriers
EsophagusThe image shows the transcriptomic changes along malignancy continuum.log2FC in expression of this searched gene in stem-like cells from each diseased tissue sample relative to stem-like cells in normal samples in each tissue plotted against the malignancy continuum. Samples are colored based on if they are from different disease stage.
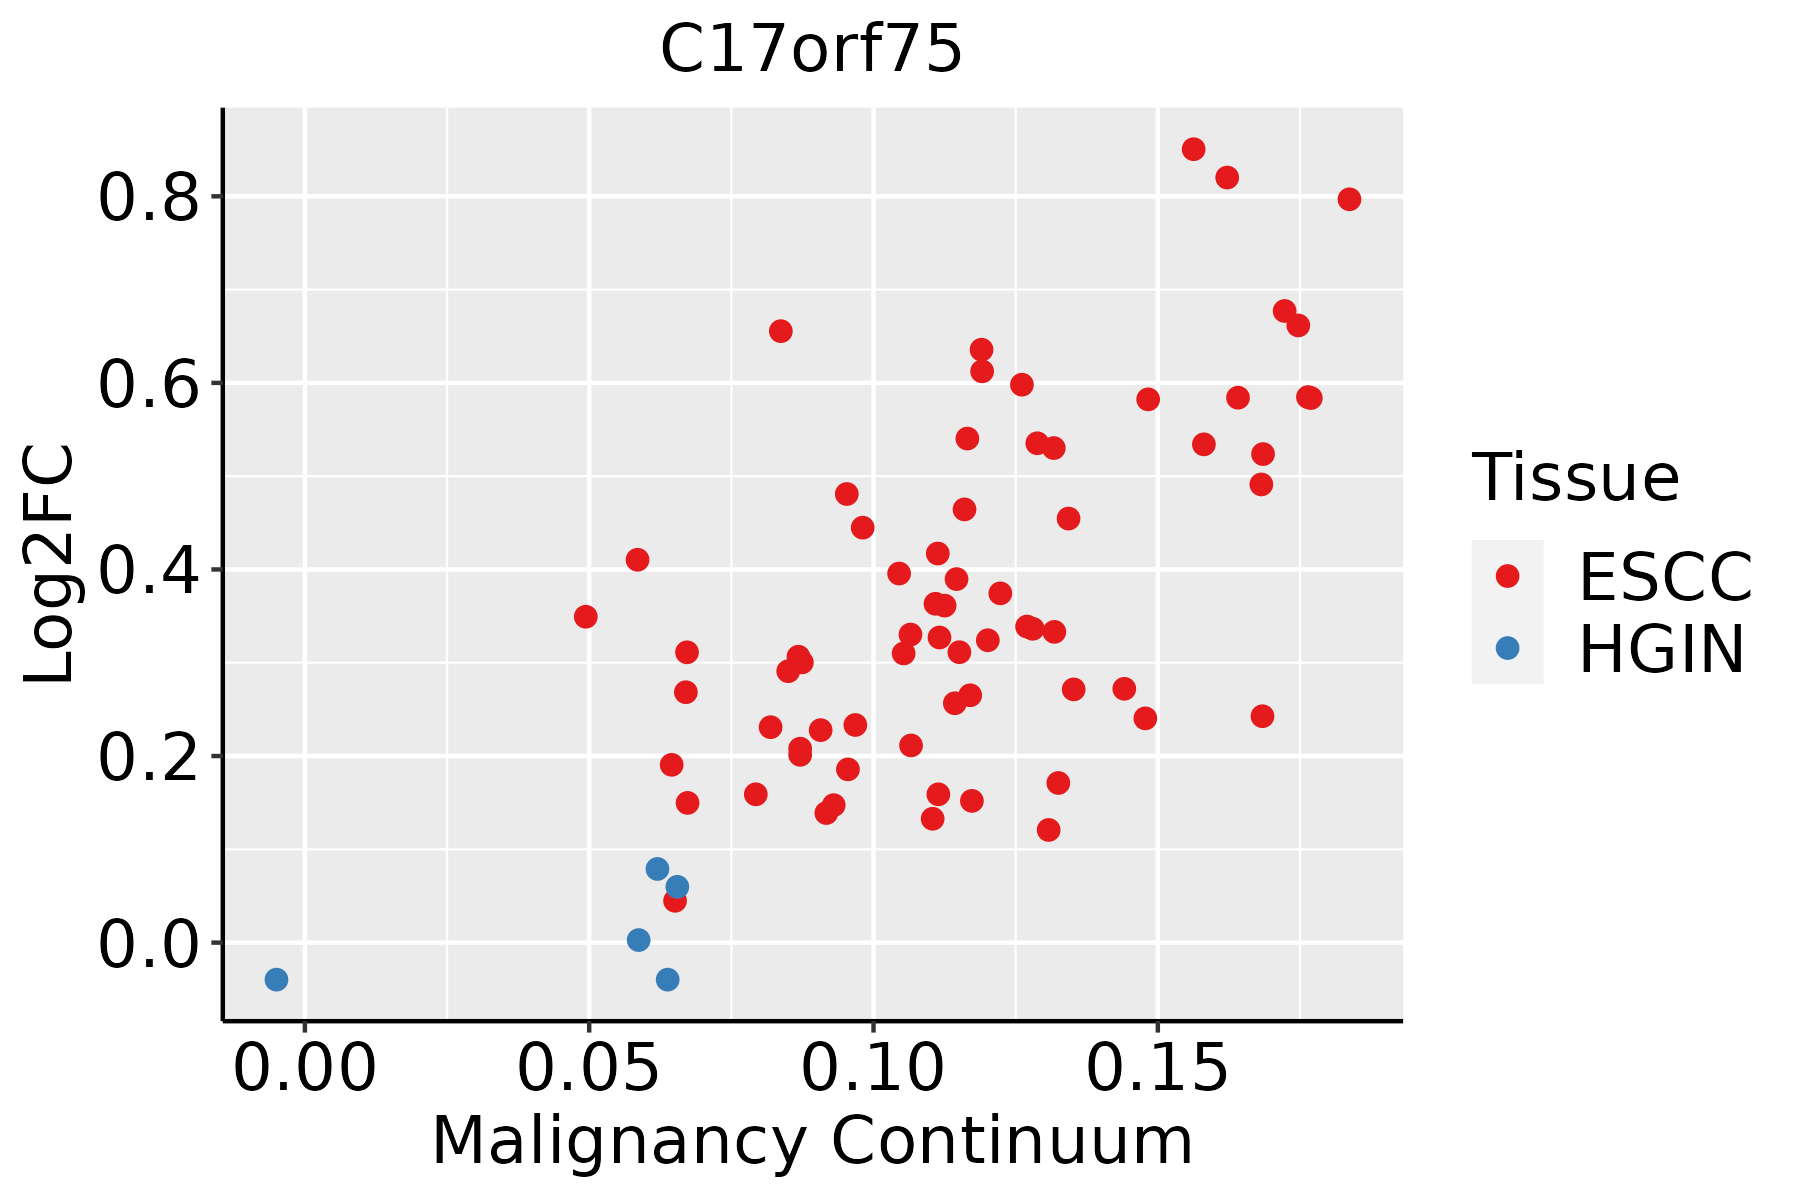
ESCC: Esophageal squamous cell carcinoma
HGIN: High-grade intraepithelial neoplasias
LGIN: Low-grade intraepithelial neoplasias
LiverThe image shows the transcriptomic changes along malignancy continuum.log2FC in expression of this searched gene in stem-like cells from each diseased tissue sample relative to stem-like cells in normal samples in each tissue plotted against the malignancy continuum. Samples are colored based on if they are from different disease stage.
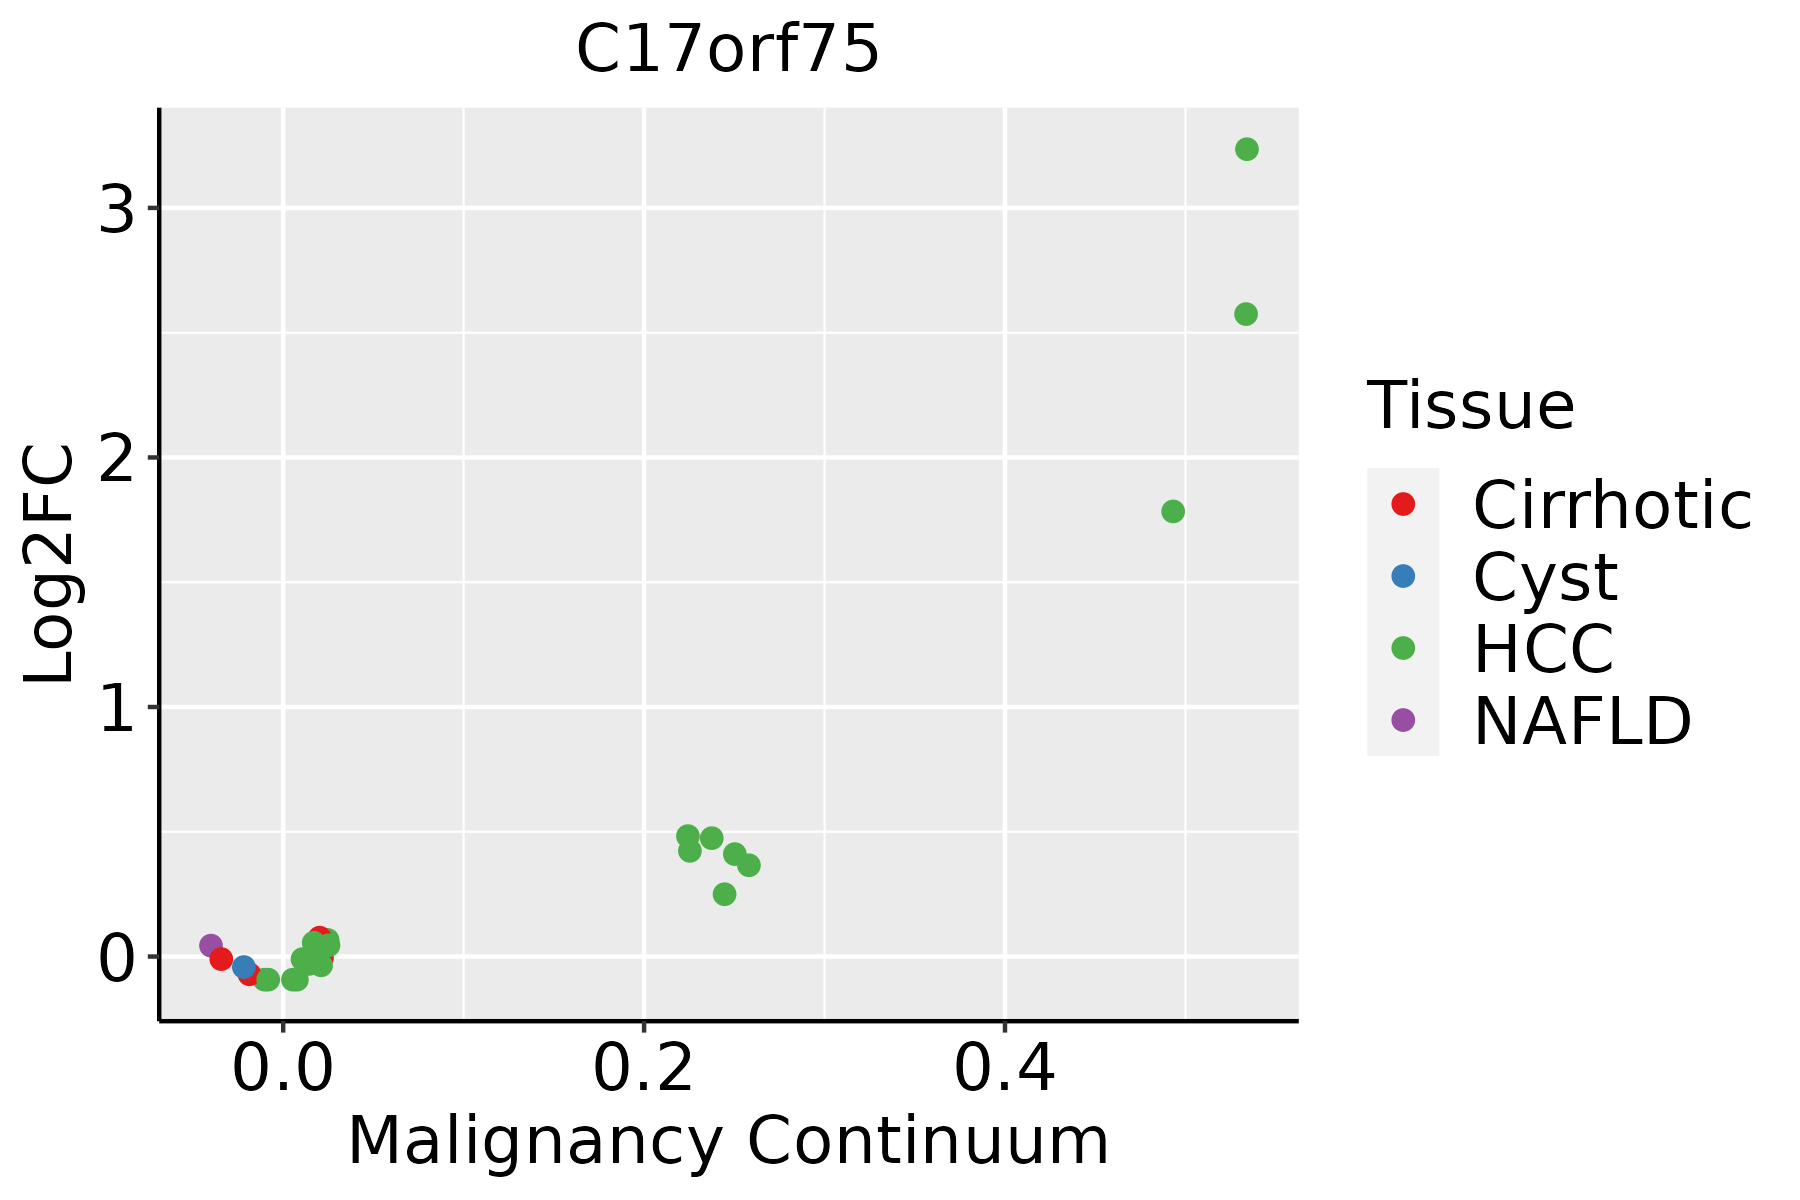
HCC: Hepatocellular carcinoma
NAFLD: Non-alcoholic fatty liver disease
Oral CavityThe image shows the transcriptomic changes along malignancy continuum.log2FC in expression of this searched gene in stem-like cells from each diseased tissue sample relative to stem-like cells in normal samples in each tissue plotted against the malignancy continuum. Samples are colored based on if they are from different disease stage.EOLP: Erosive Oral lichen planus
LP: leukoplakia
NEOLP: Non-erosive oral lichen planus
OSCC: Oral squamous cell carcinoma
SkinThe image shows the transcriptomic changes along malignancy continuum.log2FC in expression of this searched gene in stem-like cells from each diseased tissue sample relative to stem-like cells in normal samples in each tissue plotted against the malignancy continuum. Samples are colored based on if they are from different disease stage.
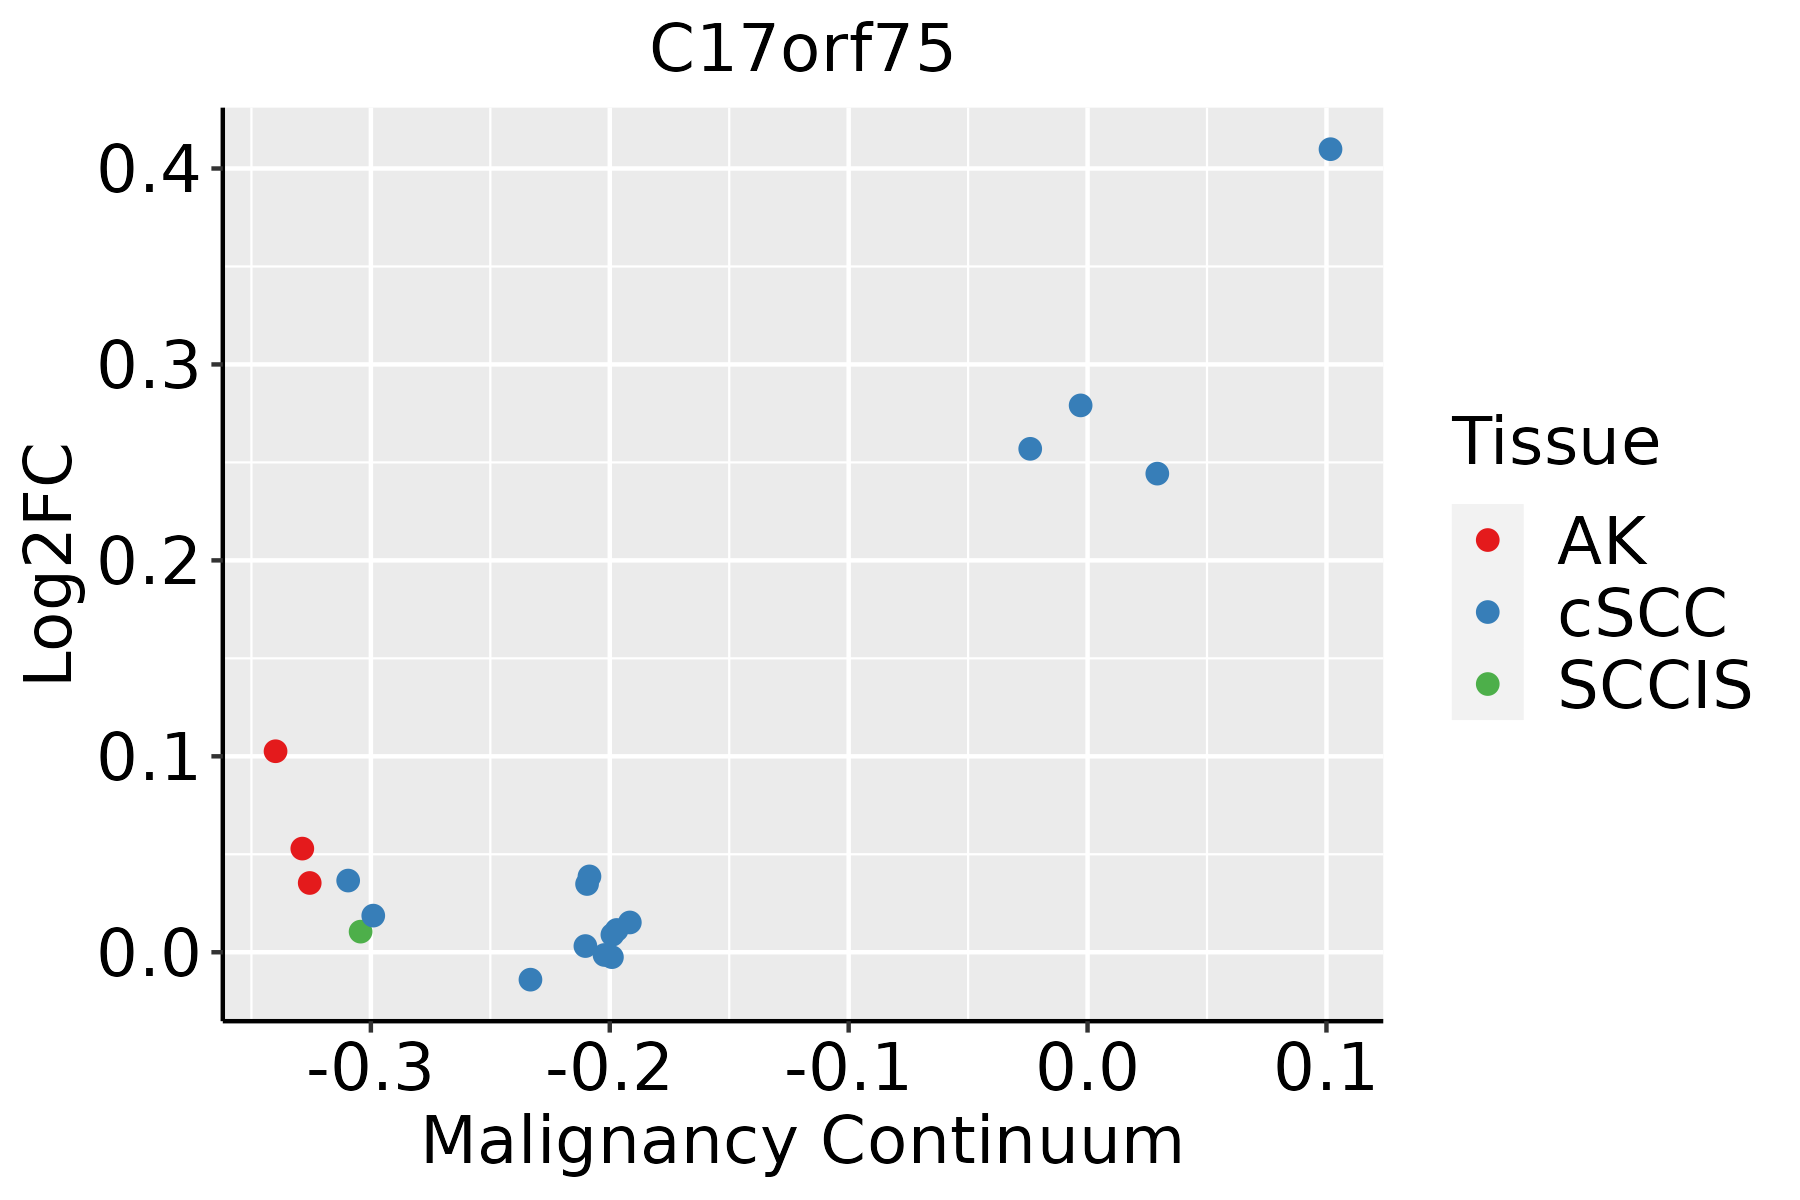
AK: Actinic keratosis
cSCC: Cutaneous squamous cell carcinoma
SCCIS:squamous cell carcinoma in situ
∗log2FC in expression of this searched gene in stem-like cells from each diseased tissue sample relative to stem-like cells in normal samples in each tissue plotted against the malignancy continuum. Samples are colored based on if they are from different disease stage.

Top

Malignant transformation related pathway analysis

check buttonFind out the enriched GO biological processes and KEGG pathways involved in transition from healthy to precancer to cancer
check button Figure of enriched GO biological processes.
TissueDisease StageEnriched GO biological Processes
ColorectumADGO analysis - Figure of enriched GO biological processes: Top 15 enriched GO BP terms are showed in the bar plot of each disease state in each tissue. Each row represents a significant GO biological process which is colored according to the -log10(p.adjust).
ColorectumSERGO analysis - Figure of enriched GO biological processes: Top 15 enriched GO BP terms are showed in the bar plot of each disease state in each tissue. Each row represents a significant GO biological process which is colored according to the -log10(p.adjust).
ColorectumMSSGO analysis - Figure of enriched GO biological processes: Top 15 enriched GO BP terms are showed in the bar plot of each disease state in each tissue. Each row represents a significant GO biological process which is colored according to the -log10(p.adjust).
ColorectumMSI-HGO analysis - Figure of enriched GO biological processes: Top 15 enriched GO BP terms are showed in the bar plot of each disease state in each tissue. Each row represents a significant GO biological process which is colored according to the -log10(p.adjust).
ColorectumFAPGO analysis - Figure of enriched GO biological processes: Top 15 enriched GO BP terms are showed in the bar plot of each disease state in each tissue. Each row represents a significant GO biological process which is colored according to the -log10(p.adjust).
∗Top 15 enriched GO BP terms are showed in the bar plot of each disease state in each tissue. Each row represents a significant GO biological process which is colored according to the -log10(p.adjust).
Page: 1 2 3 4 5 6 7 8 9 

check button Enriched GO biological processes.
GO IDTissueDisease StageDescriptionGene RatioBg Ratiopvaluep.adjustCount
GO:005165617EsophagusESCCestablishment of organelle localization273/8552390/187239.13e-231.81e-20273
GO:005165016EsophagusESCCestablishment of vesicle localization114/8552161/187238.20e-112.53e-09114
GO:005164815EsophagusESCCvesicle localization119/8552177/187235.16e-091.08e-07119
GO:00069038EsophagusESCCvesicle targeting38/855245/187238.42e-081.43e-0638
GO:00990222EsophagusESCCvesicle tethering10/855211/187232.54e-031.08e-0210
GO:005165611LiverCirrhoticestablishment of organelle localization128/4634390/187231.78e-041.67e-03128
GO:00069034LiverCirrhoticvesicle targeting22/463445/187233.90e-043.23e-0322
GO:005165011LiverCirrhoticestablishment of vesicle localization58/4634161/187238.98e-046.44e-0358
GO:005164811LiverCirrhoticvesicle localization62/4634177/187231.37e-039.18e-0362
GO:005165621LiverHCCestablishment of organelle localization226/7958390/187234.15e-101.34e-08226
GO:005165021LiverHCCestablishment of vesicle localization103/7958161/187232.94e-086.69e-07103
GO:005164821LiverHCCvesicle localization107/7958177/187231.05e-061.57e-05107
GO:000690311LiverHCCvesicle targeting34/795845/187236.75e-068.08e-0534
GO:005165610Oral cavityOSCCestablishment of organelle localization239/7305390/187232.46e-193.31e-17239
GO:00069037Oral cavityOSCCvesicle targeting38/730545/187234.49e-101.19e-0838
GO:00516509Oral cavityOSCCestablishment of vesicle localization101/7305161/187238.79e-102.17e-08101
GO:00516489Oral cavityOSCCvesicle localization105/7305177/187233.30e-086.30e-07105
GO:0099022Oral cavityOSCCvesicle tethering10/730511/187235.78e-043.30e-0310
GO:005165615Oral cavityLPestablishment of organelle localization147/4623390/187236.01e-092.46e-07147
GO:000690314Oral cavityLPvesicle targeting27/462345/187235.03e-071.40e-0527
Page: 1 2 

check button Enriched KEGG pathways.
Pathway IDTissueDisease StageDescriptionGene RatioBg Ratiopvaluep.adjustqvalueCount
Page: 1 

Top

Cell-cell communication analysis

check buttonIdentification of potential cell-cell interactions between two cell types and their ligand-receptor pairs for different disease states
LigandReceptorLRpairPathwayTissueDisease Stage
Page: 1 

Top

Single-cell gene regulatory network inference analysis

check buttonFind out the significant the regulons (TFs) and the target genes of each regulon across cell types for different disease states
TFCell TypeTissueDisease StageTarget GeneRSSRegulon Activity
∗The dot plots of a searched regulon are shown for all cell subpopulations in each disease state of each tissue based on the regulon specific score inferred using pySCENIC and by calculating the average expression.
Page: 1 

Top

Somatic mutation of malignant transformation related genes

check buttonAnnotation of somatic variants for genes involved in malignant transformation
Hugo SymbolVariant ClassVariant ClassificationdbSNP RSHGVScHGVSpHGVSp ShortSWISSPROTBIOTYPESIFTPolyPhenTumor Sample BarcodeTissueHistologySexAgeStageTherapy TypesDrugsOutcome
C17orf75SNVMissense_Mutationc.1136N>Gp.Asn379Serp.N379SQ9HAS0protein_codingtolerated(0.42)benign(0.017)TCGA-A2-A0ES-01Breastbreast invasive carcinomaFemale<65I/IIChemotherapydocetaxelSD
C17orf75SNVMissense_Mutationrs753957093c.971T>Cp.Leu324Prop.L324PQ9HAS0protein_codingdeleterious(0)probably_damaging(0.995)TCGA-A8-A090-01Breastbreast invasive carcinomaFemale>=65I/IIUnknownUnknownSD
C17orf75SNVMissense_Mutationc.473N>Tp.Ser158Phep.S158FQ9HAS0protein_codingdeleterious(0)probably_damaging(0.939)TCGA-B6-A1KN-01Breastbreast invasive carcinomaFemale<65III/IVUnknownUnknownSD
C17orf75SNVMissense_Mutationrs761593047c.406N>Tp.Pro136Serp.P136SQ9HAS0protein_codingtolerated(0.19)benign(0)TCGA-BH-A0HF-01Breastbreast invasive carcinomaFemale>=65I/IIHormone TherapyarimidexSD
C17orf75insertionFrame_Shift_Insnovelc.582_583insGATACAACCTTATTCTTCCTGCCTTGTGCAGp.Leu195AspfsTer16p.L195Dfs*16Q9HAS0protein_codingTCGA-AN-A0FN-01Breastbreast invasive carcinomaFemale<65I/IIUnknownUnknownSD
C17orf75insertionIn_Frame_Insnovelc.257_258insTTTGAGACAGGGTCTTGCTTTGTTGCCCAGGCTGGAGTGCAGp.Val86_Glu87insLeuArgGlnGlyLeuAlaLeuLeuProArgLeuGluCysArgp.V86_E87insLRQGLALLPRLECRQ9HAS0protein_codingTCGA-AO-A0JI-01Breastbreast invasive carcinomaFemale<65I/IIChemotherapycyclophosphamideSD
C17orf75SNVMissense_Mutationnovelc.61N>Cp.Glu21Glnp.E21QQ9HAS0protein_codingtolerated(0.11)probably_damaging(0.994)TCGA-C5-A8XK-01Cervixcervical & endocervical cancerFemale<65I/IIChemotherapycisplatinSD
C17orf75SNVMissense_Mutationc.37N>Cp.Glu13Glnp.E13QQ9HAS0protein_codingdeleterious_low_confidence(0.01)benign(0.26)TCGA-EK-A2PG-01Cervixcervical & endocervical cancerFemale>=65I/IIUnknownUnknownSD
C17orf75SNVMissense_Mutationc.675N>Cp.Leu225Phep.L225FQ9HAS0protein_codingdeleterious(0)probably_damaging(0.962)TCGA-LP-A7HU-01Cervixcervical & endocervical cancerFemale<65I/IIUnknownUnknownSD
C17orf75SNVMissense_Mutationc.469N>Tp.Gly157Trpp.G157WQ9HAS0protein_codingdeleterious(0)probably_damaging(0.995)TCGA-A6-5665-01Colorectumcolon adenocarcinomaFemale>=65I/IIUnknownUnknownPD
Page: 1 2 3 4 

Top

Related drugs of malignant transformation related genes

check buttonIdentification of chemicals and drugs interact with genes involved in malignant transfromation
(DGIdb 4.0)
Entrez IDSymbolCategoryInteraction TypesDrug Claim NameDrug NamePMIDs
Page: 1