
|
|||||
|
 | |
| |
| |
| |
| |
| |
|
Gene: C16orf59 |
Gene summary for C16ORF59 |
| Gene information | Species | Human | Gene symbol | C16orf59 | Gene ID | 80178 |
| Gene name | tubulin epsilon and delta complex 2 | |
| Gene Alias | C16orf59 | |
| Cytomap | 16p13.3 | |
| Gene Type | protein-coding | GO ID | GO:0007154 | UniProtAcc | Q7L2K0 |
Top |
Malignant transformation analysis |
| Identification of the aberrant gene expression in precancerous and cancerous lesions by comparing the gene expression of stem-like cells in diseased tissues with normal stem cells |
| Entrez ID | Symbol | Replicates | Species | Organ | Tissue | Adj P-value | Log2FC | Malignancy |
| 80178 | C16orf59 | C04 | Human | Oral cavity | OSCC | 2.02e-04 | 2.03e-01 | 0.2633 |
| 80178 | C16orf59 | C21 | Human | Oral cavity | OSCC | 1.12e-11 | 4.11e-01 | 0.2678 |
| 80178 | C16orf59 | C30 | Human | Oral cavity | OSCC | 2.17e-16 | 7.59e-01 | 0.3055 |
| 80178 | C16orf59 | C38 | Human | Oral cavity | OSCC | 2.38e-04 | 4.98e-01 | 0.172 |
| 80178 | C16orf59 | C43 | Human | Oral cavity | OSCC | 2.83e-23 | 4.14e-01 | 0.1704 |
| 80178 | C16orf59 | C46 | Human | Oral cavity | OSCC | 3.95e-16 | 3.18e-01 | 0.1673 |
| 80178 | C16orf59 | C51 | Human | Oral cavity | OSCC | 1.79e-02 | 2.04e-01 | 0.2674 |
| 80178 | C16orf59 | C57 | Human | Oral cavity | OSCC | 9.83e-03 | 1.27e-01 | 0.1679 |
| 80178 | C16orf59 | C06 | Human | Oral cavity | OSCC | 1.27e-02 | 6.27e-01 | 0.2699 |
| 80178 | C16orf59 | C08 | Human | Oral cavity | OSCC | 3.94e-04 | 1.14e-01 | 0.1919 |
| 80178 | C16orf59 | LN46 | Human | Oral cavity | OSCC | 6.38e-07 | 2.86e-01 | 0.1666 |
| 80178 | C16orf59 | SYSMH2 | Human | Oral cavity | OSCC | 1.77e-03 | 1.72e-01 | 0.2326 |
| 80178 | C16orf59 | SYSMH3 | Human | Oral cavity | OSCC | 4.32e-07 | 1.87e-01 | 0.2442 |
| 80178 | C16orf59 | SYSMH5 | Human | Oral cavity | OSCC | 3.50e-02 | 9.24e-02 | 0.0647 |
| Page: 1 |
| Tissue | Expression Dynamics | Abbreviation |
| Oral Cavity | 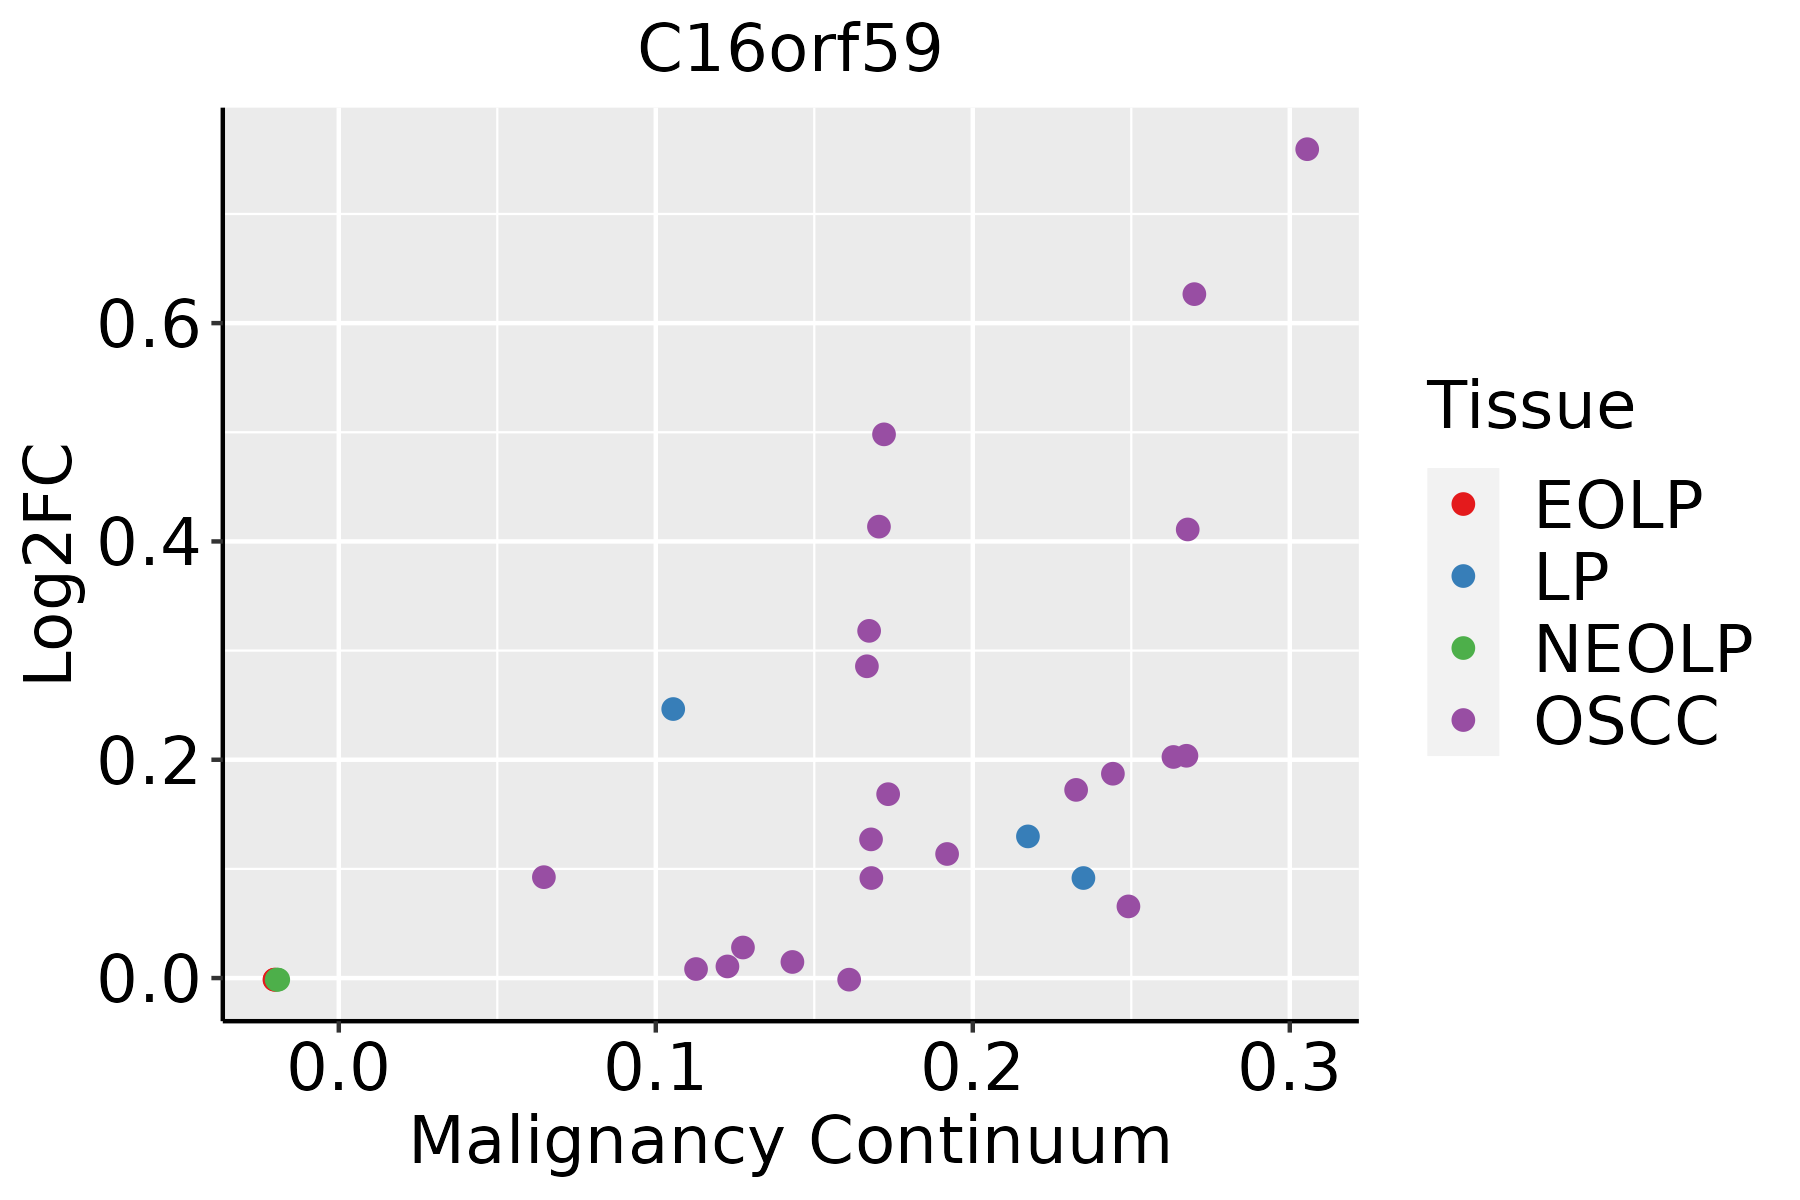 | EOLP: Erosive Oral lichen planus |
| LP: leukoplakia | ||
| NEOLP: Non-erosive oral lichen planus | ||
| OSCC: Oral squamous cell carcinoma |
| ∗log2FC in expression of this searched gene in stem-like cells from each diseased tissue sample relative to stem-like cells in normal samples in each tissue plotted against the malignancy continuum. Samples are colored based on if they are from different disease stage. |
Top |
Malignant transformation related pathway analysis |
| Find out the enriched GO biological processes and KEGG pathways involved in transition from healthy to precancer to cancer |
| Tissue | Disease Stage | Enriched GO biological Processes |
| Colorectum | AD |  |
| Colorectum | SER |  |
| Colorectum | MSS |  |
| Colorectum | MSI-H |  |
| Colorectum | FAP |  |
| ∗Top 15 enriched GO BP terms are showed in the bar plot of each disease state in each tissue. Each row represents a significant GO biological process which is colored according to the -log10(p.adjust). |
| Page: 1 2 3 4 5 6 7 8 9 |
| GO ID | Tissue | Disease Stage | Description | Gene Ratio | Bg Ratio | pvalue | p.adjust | Count |
| Page: 1 |
| Pathway ID | Tissue | Disease Stage | Description | Gene Ratio | Bg Ratio | pvalue | p.adjust | qvalue | Count |
| Page: 1 |
Top |
Cell-cell communication analysis |
| Identification of potential cell-cell interactions between two cell types and their ligand-receptor pairs for different disease states |
| Ligand | Receptor | LRpair | Pathway | Tissue | Disease Stage |
| Page: 1 |
Top |
Single-cell gene regulatory network inference analysis |
| Find out the significant the regulons (TFs) and the target genes of each regulon across cell types for different disease states |
| TF | Cell Type | Tissue | Disease Stage | Target Gene | RSS | Regulon Activity |
| ∗The dot plots of a searched regulon are shown for all cell subpopulations in each disease state of each tissue based on the regulon specific score inferred using pySCENIC and by calculating the average expression. |
| Page: 1 |
Top |
Somatic mutation of malignant transformation related genes |
| Annotation of somatic variants for genes involved in malignant transformation |
| Hugo Symbol | Variant Class | Variant Classification | dbSNP RS | HGVSc | HGVSp | HGVSp Short | SWISSPROT | BIOTYPE | SIFT | PolyPhen | Tumor Sample Barcode | Tissue | Histology | Sex | Age | Stage | Therapy Types | Drugs | Outcome |
| C16orf59 | SNV | Missense_Mutation | c.200N>A | p.Cys67Tyr | p.C67Y | Q7L2K0 | protein_coding | tolerated(0.08) | benign(0.018) | TCGA-D8-A1J8-01 | Breast | breast invasive carcinoma | Female | >=65 | I/II | Hormone Therapy | nolvadex | SD | |
| C16orf59 | SNV | Missense_Mutation | rs775584915 | c.344C>T | p.Ser115Phe | p.S115F | Q7L2K0 | protein_coding | deleterious(0.01) | benign(0.074) | TCGA-2W-A8YY-01 | Cervix | cervical & endocervical cancer | Female | <65 | I/II | Chemotherapy | cisplatin | CR |
| C16orf59 | SNV | Missense_Mutation | c.647C>T | p.Ser216Phe | p.S216F | Q7L2K0 | protein_coding | deleterious(0.03) | probably_damaging(0.967) | TCGA-EA-A97N-01 | Cervix | cervical & endocervical cancer | Female | <65 | I/II | Unknown | Unknown | SD | |
| C16orf59 | SNV | Missense_Mutation | rs749451532 | c.1177C>T | p.Pro393Ser | p.P393S | Q7L2K0 | protein_coding | deleterious(0) | probably_damaging(0.999) | TCGA-A6-5657-01 | Colorectum | colon adenocarcinoma | Male | >=65 | III/IV | Ancillary | leucovorin | SD |
| C16orf59 | SNV | Missense_Mutation | c.1208C>T | p.Pro403Leu | p.P403L | Q7L2K0 | protein_coding | deleterious(0.04) | benign(0.019) | TCGA-AA-A01P-01 | Colorectum | colon adenocarcinoma | Female | >=65 | III/IV | Unknown | Unknown | PD | |
| C16orf59 | SNV | Missense_Mutation | novel | c.193C>A | p.Pro65Thr | p.P65T | Q7L2K0 | protein_coding | tolerated(0.17) | benign(0.025) | TCGA-CA-6717-01 | Colorectum | colon adenocarcinoma | Male | <65 | I/II | Chemotherapy | oxaliplatin | CR |
| C16orf59 | deletion | Frame_Shift_Del | c.308delN | p.Ser105AlafsTer2 | p.S105Afs*2 | Q7L2K0 | protein_coding | TCGA-AY-6197-01 | Colorectum | colon adenocarcinoma | Male | <65 | I/II | Unknown | Unknown | SD | |||
| C16orf59 | SNV | Missense_Mutation | novel | c.1000N>T | p.Gly334Trp | p.G334W | Q7L2K0 | protein_coding | deleterious(0.02) | possibly_damaging(0.465) | TCGA-AP-A0LS-01 | Endometrium | uterine corpus endometrioid carcinoma | Female | <65 | I/II | Unknown | Unknown | SD |
| C16orf59 | SNV | Missense_Mutation | novel | c.815A>C | p.Lys272Thr | p.K272T | Q7L2K0 | protein_coding | deleterious(0.02) | benign(0.066) | TCGA-AP-A1DK-01 | Endometrium | uterine corpus endometrioid carcinoma | Female | <65 | I/II | Unknown | Unknown | SD |
| C16orf59 | SNV | Missense_Mutation | novel | c.329N>T | p.Ser110Phe | p.S110F | Q7L2K0 | protein_coding | deleterious(0) | possibly_damaging(0.785) | TCGA-AX-A1CE-01 | Endometrium | uterine corpus endometrioid carcinoma | Female | <65 | I/II | Unspecific | Paclitaxel | SD |
| Page: 1 2 3 |
Top |
Related drugs of malignant transformation related genes |
| Identification of chemicals and drugs interact with genes involved in malignant transfromation |
| (DGIdb 4.0) |
| Entrez ID | Symbol | Category | Interaction Types | Drug Claim Name | Drug Name | PMIDs |
| Page: 1 |

Copyright 2023-Present -The University of Texas Health Science Center at Houston |