
|
|||||
|
 | |
| |
| |
| |
| |
| |
|
Gene: C16orf52 |
Gene summary for C16ORF52 |
| Gene information | Species | Human | Gene symbol | C16orf52 | Gene ID | 730094 |
| Gene name | modulator of smoothened | |
| Gene Alias | ATTHOG | |
| Cytomap | 16p12.2 | |
| Gene Type | protein-coding | GO ID | GO:0007154 | UniProtAcc | Q8NHV5 |
Top |
Malignant transformation analysis |
| Identification of the aberrant gene expression in precancerous and cancerous lesions by comparing the gene expression of stem-like cells in diseased tissues with normal stem cells |
| Entrez ID | Symbol | Replicates | Species | Organ | Tissue | Adj P-value | Log2FC | Malignancy |
| 730094 | C16orf52 | HTA11_99999970781_79442 | Human | Colorectum | MSS | 1.75e-18 | 3.56e-01 | 0.294 |
| 730094 | C16orf52 | HTA11_99999965062_69753 | Human | Colorectum | MSI-H | 1.91e-08 | 7.22e-01 | 0.3487 |
| 730094 | C16orf52 | HTA11_99999965104_69814 | Human | Colorectum | MSS | 7.13e-20 | 6.47e-01 | 0.281 |
| 730094 | C16orf52 | HTA11_99999971662_82457 | Human | Colorectum | MSS | 1.75e-18 | 3.59e-01 | 0.3859 |
| 730094 | C16orf52 | HTA11_99999973899_84307 | Human | Colorectum | MSS | 5.79e-04 | 1.84e-01 | 0.2585 |
| 730094 | C16orf52 | HTA11_99999974143_84620 | Human | Colorectum | MSS | 4.28e-10 | 2.06e-01 | 0.3005 |
| 730094 | C16orf52 | C21 | Human | Oral cavity | OSCC | 1.18e-04 | 2.31e-01 | 0.2678 |
| 730094 | C16orf52 | C30 | Human | Oral cavity | OSCC | 1.14e-21 | 8.63e-01 | 0.3055 |
| 730094 | C16orf52 | C46 | Human | Oral cavity | OSCC | 1.13e-02 | 1.19e-01 | 0.1673 |
| 730094 | C16orf52 | C57 | Human | Oral cavity | OSCC | 1.29e-03 | 2.87e-01 | 0.1679 |
| 730094 | C16orf52 | C08 | Human | Oral cavity | OSCC | 5.84e-23 | 5.02e-01 | 0.1919 |
| 730094 | C16orf52 | C09 | Human | Oral cavity | OSCC | 7.08e-03 | 1.92e-01 | 0.1431 |
| 730094 | C16orf52 | LN46 | Human | Oral cavity | OSCC | 1.04e-02 | 1.76e-01 | 0.1666 |
| 730094 | C16orf52 | SYSMH1 | Human | Oral cavity | OSCC | 1.56e-04 | 1.80e-01 | 0.1127 |
| 730094 | C16orf52 | SYSMH2 | Human | Oral cavity | OSCC | 3.20e-08 | 2.72e-01 | 0.2326 |
| 730094 | C16orf52 | SYSMH3 | Human | Oral cavity | OSCC | 4.26e-11 | 3.47e-01 | 0.2442 |
| 730094 | C16orf52 | SYSMH5 | Human | Oral cavity | OSCC | 1.12e-03 | 1.30e-01 | 0.0647 |
| 730094 | C16orf52 | SYSMH6 | Human | Oral cavity | OSCC | 2.19e-04 | 1.71e-01 | 0.1275 |
| Page: 1 |
| Tissue | Expression Dynamics | Abbreviation |
| Colorectum (GSE201348) |  | FAP: Familial adenomatous polyposis |
| CRC: Colorectal cancer | ||
| Colorectum (HTA11) | 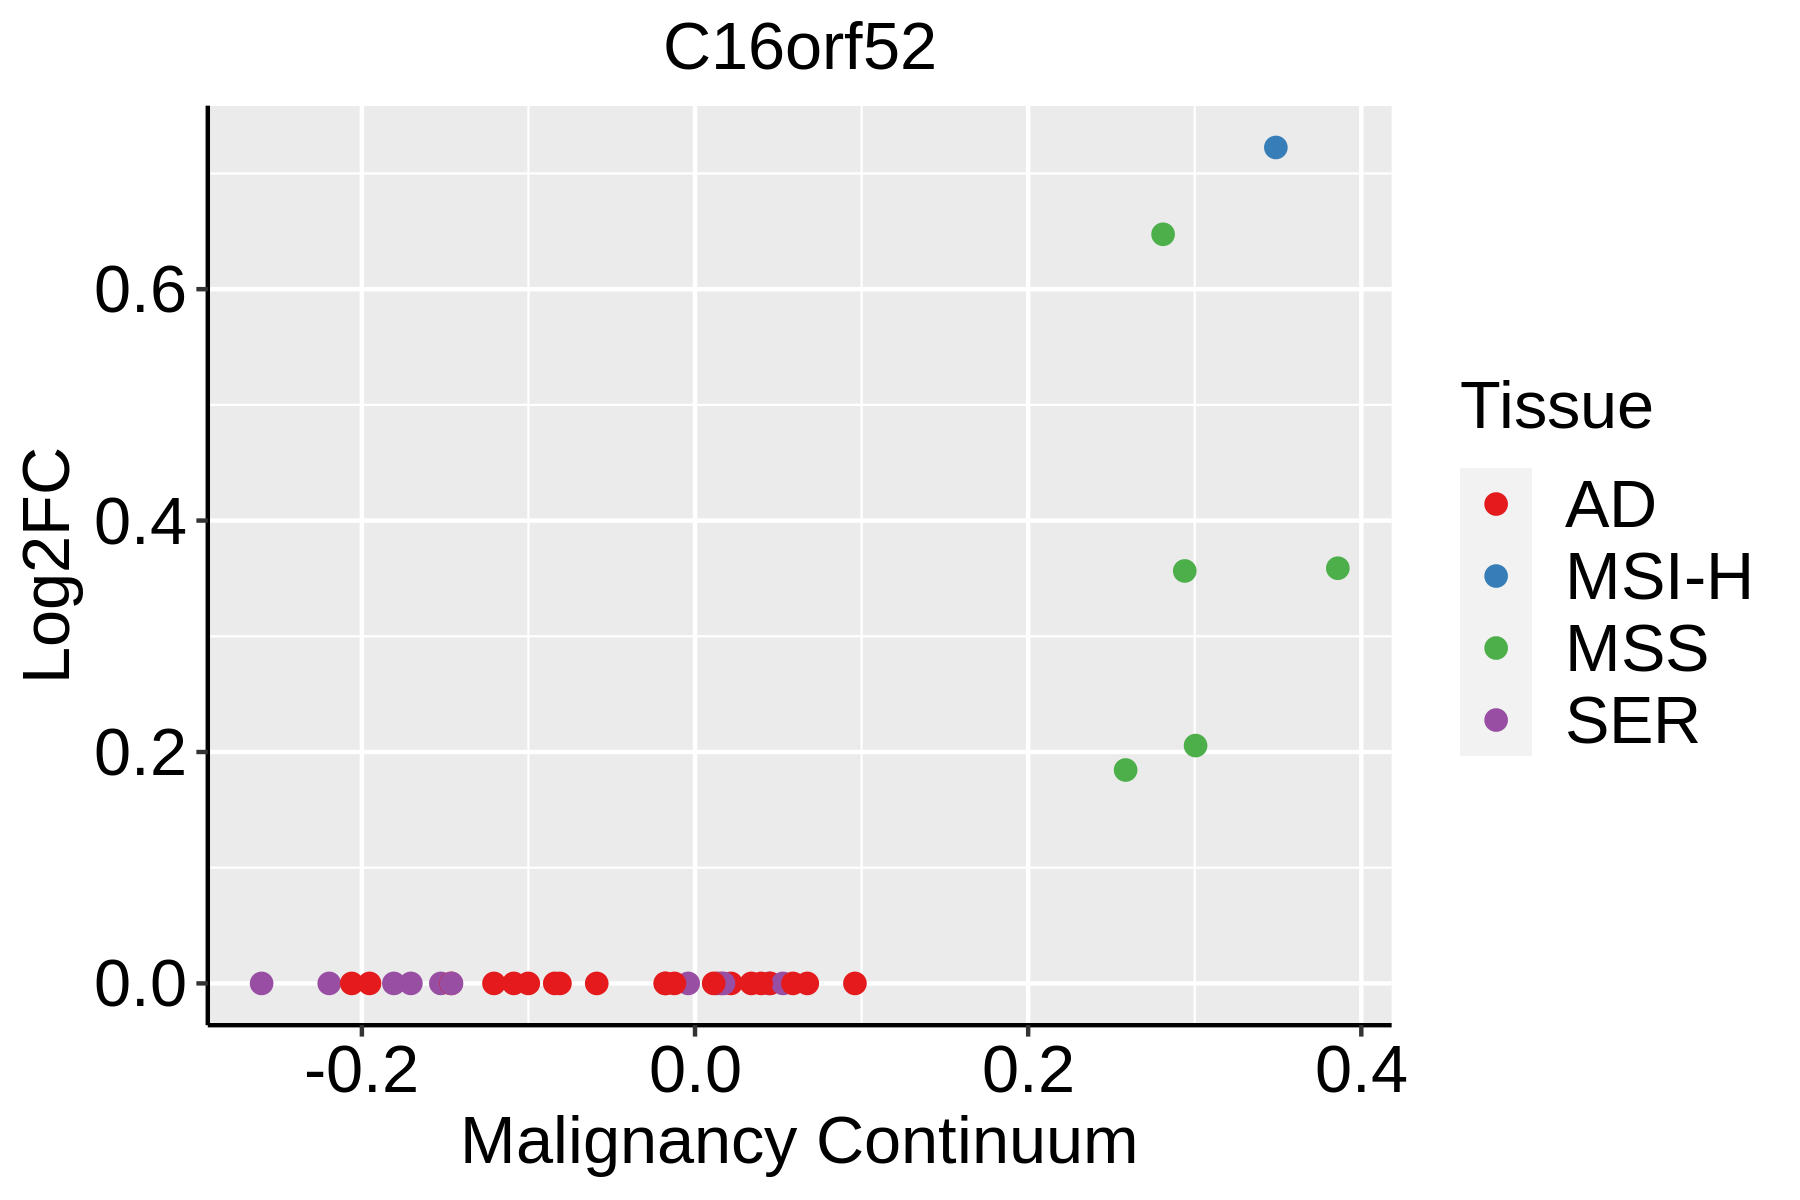 | AD: Adenomas |
| SER: Sessile serrated lesions | ||
| MSI-H: Microsatellite-high colorectal cancer | ||
| MSS: Microsatellite stable colorectal cancer | ||
| Oral Cavity | 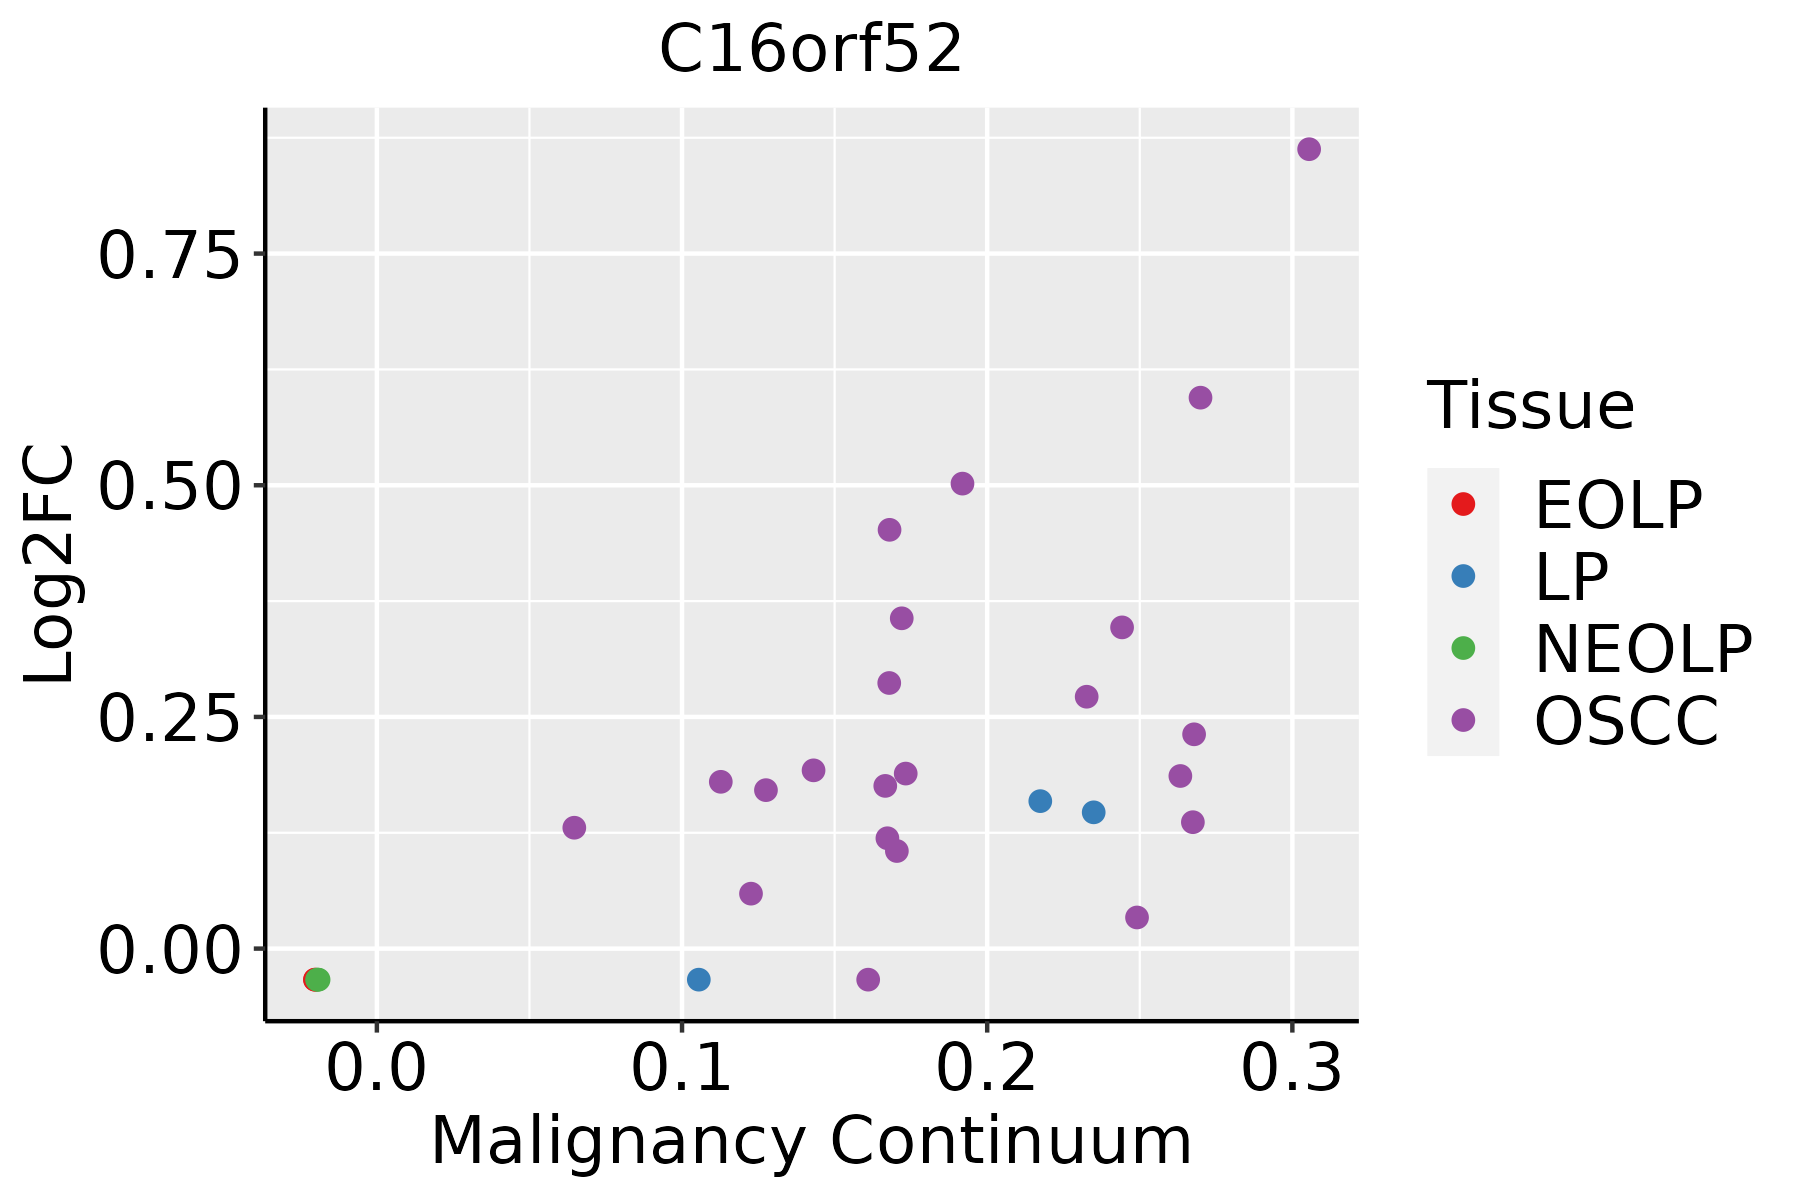 | EOLP: Erosive Oral lichen planus |
| LP: leukoplakia | ||
| NEOLP: Non-erosive oral lichen planus | ||
| OSCC: Oral squamous cell carcinoma |
| ∗log2FC in expression of this searched gene in stem-like cells from each diseased tissue sample relative to stem-like cells in normal samples in each tissue plotted against the malignancy continuum. Samples are colored based on if they are from different disease stage. |
Top |
Malignant transformation related pathway analysis |
| Find out the enriched GO biological processes and KEGG pathways involved in transition from healthy to precancer to cancer |
| Tissue | Disease Stage | Enriched GO biological Processes |
| Colorectum | AD |  |
| Colorectum | SER |  |
| Colorectum | MSS |  |
| Colorectum | MSI-H |  |
| Colorectum | FAP |  |
| ∗Top 15 enriched GO BP terms are showed in the bar plot of each disease state in each tissue. Each row represents a significant GO biological process which is colored according to the -log10(p.adjust). |
| Page: 1 2 3 4 5 6 7 8 9 |
| GO ID | Tissue | Disease Stage | Description | Gene Ratio | Bg Ratio | pvalue | p.adjust | Count |
| Page: 1 |
| Pathway ID | Tissue | Disease Stage | Description | Gene Ratio | Bg Ratio | pvalue | p.adjust | qvalue | Count |
| Page: 1 |
Top |
Cell-cell communication analysis |
| Identification of potential cell-cell interactions between two cell types and their ligand-receptor pairs for different disease states |
| Ligand | Receptor | LRpair | Pathway | Tissue | Disease Stage |
| Page: 1 |
Top |
Single-cell gene regulatory network inference analysis |
| Find out the significant the regulons (TFs) and the target genes of each regulon across cell types for different disease states |
| TF | Cell Type | Tissue | Disease Stage | Target Gene | RSS | Regulon Activity |
| ∗The dot plots of a searched regulon are shown for all cell subpopulations in each disease state of each tissue based on the regulon specific score inferred using pySCENIC and by calculating the average expression. |
| Page: 1 |
Top |
Somatic mutation of malignant transformation related genes |
| Annotation of somatic variants for genes involved in malignant transformation |
| Hugo Symbol | Variant Class | Variant Classification | dbSNP RS | HGVSc | HGVSp | HGVSp Short | SWISSPROT | BIOTYPE | SIFT | PolyPhen | Tumor Sample Barcode | Tissue | Histology | Sex | Age | Stage | Therapy Types | Drugs | Outcome |
| C16orf52 | SNV | Missense_Mutation | novel | c.190N>A | p.Glu64Lys | p.E64K | Q8NHV5 | protein_coding | deleterious(0) | probably_damaging(0.997) | TCGA-AX-A1CE-01 | Endometrium | uterine corpus endometrioid carcinoma | Female | <65 | I/II | Unspecific | Paclitaxel | SD |
| C16orf52 | SNV | Missense_Mutation | novel | c.17N>C | p.Ile6Thr | p.I6T | Q8NHV5 | protein_coding | tolerated(0.17) | benign(0.051) | TCGA-B5-A3FC-01 | Endometrium | uterine corpus endometrioid carcinoma | Female | <65 | I/II | Unknown | Unknown | SD |
| C16orf52 | SNV | Missense_Mutation | novel | c.193T>C | p.Trp65Arg | p.W65R | Q8NHV5 | protein_coding | deleterious(0.02) | benign(0.05) | TCGA-D1-A103-01 | Endometrium | uterine corpus endometrioid carcinoma | Female | >=65 | I/II | Unknown | Unknown | SD |
| C16orf52 | SNV | Missense_Mutation | novel | c.40N>A | p.Ala14Thr | p.A14T | Q8NHV5 | protein_coding | tolerated(0.17) | benign(0.026) | TCGA-DF-A2KU-01 | Endometrium | uterine corpus endometrioid carcinoma | Female | Unknown | I/II | Unknown | Unknown | SD |
| C16orf52 | SNV | Missense_Mutation | novel | c.65G>A | p.Ser22Asn | p.S22N | Q8NHV5 | protein_coding | deleterious(0) | benign(0.089) | TCGA-EO-A22T-01 | Endometrium | uterine corpus endometrioid carcinoma | Female | <65 | I/II | Unknown | Unknown | SD |
| C16orf52 | SNV | Missense_Mutation | novel | c.351T>G | p.Phe117Leu | p.F117L | Q8NHV5 | protein_coding | deleterious(0.04) | benign(0.017) | TCGA-EO-A22X-01 | Endometrium | uterine corpus endometrioid carcinoma | Female | <65 | III/IV | Unspecific | Carboplatin | Complete Response |
| Page: 1 |
Top |
Related drugs of malignant transformation related genes |
| Identification of chemicals and drugs interact with genes involved in malignant transfromation |
| (DGIdb 4.0) |
| Entrez ID | Symbol | Category | Interaction Types | Drug Claim Name | Drug Name | PMIDs |
| Page: 1 |

Copyright 2023-Present -The University of Texas Health Science Center at Houston |