
|
|||||
|
 | |
| |
| |
| |
| |
| |
|
Gene: C15orf48 |
Gene summary for C15ORF48 |
| Gene information | Species | Human | Gene symbol | C15orf48 | Gene ID | 84419 |
| Gene name | chromosome 15 open reading frame 48 | |
| Gene Alias | COXFA4L3 | |
| Cytomap | 15q21.1 | |
| Gene Type | protein-coding | GO ID | GO:0008150 | UniProtAcc | A0A024R5U4 |
Top |
Malignant transformation analysis |
| Identification of the aberrant gene expression in precancerous and cancerous lesions by comparing the gene expression of stem-like cells in diseased tissues with normal stem cells |
| Entrez ID | Symbol | Replicates | Species | Organ | Tissue | Adj P-value | Log2FC | Malignancy |
| 84419 | C15orf48 | GSM4909281 | Human | Breast | IDC | 3.65e-29 | -8.13e-01 | 0.21 |
| 84419 | C15orf48 | GSM4909282 | Human | Breast | IDC | 9.70e-14 | -6.33e-01 | -0.0288 |
| 84419 | C15orf48 | GSM4909285 | Human | Breast | IDC | 5.28e-23 | -7.50e-01 | 0.21 |
| 84419 | C15orf48 | GSM4909286 | Human | Breast | IDC | 3.59e-37 | -8.41e-01 | 0.1081 |
| 84419 | C15orf48 | GSM4909287 | Human | Breast | IDC | 1.30e-13 | -6.18e-01 | 0.2057 |
| 84419 | C15orf48 | GSM4909288 | Human | Breast | IDC | 2.02e-09 | -7.70e-01 | 0.0988 |
| 84419 | C15orf48 | GSM4909290 | Human | Breast | IDC | 1.67e-18 | -7.62e-01 | 0.2096 |
| 84419 | C15orf48 | GSM4909291 | Human | Breast | IDC | 3.35e-13 | -7.29e-01 | 0.1753 |
| 84419 | C15orf48 | GSM4909292 | Human | Breast | IDC | 1.10e-02 | -8.04e-01 | 0.1236 |
| 84419 | C15orf48 | GSM4909293 | Human | Breast | IDC | 6.38e-10 | -5.71e-01 | 0.1581 |
| 84419 | C15orf48 | GSM4909294 | Human | Breast | IDC | 1.11e-28 | -8.19e-01 | 0.2022 |
| 84419 | C15orf48 | GSM4909295 | Human | Breast | IDC | 4.62e-03 | -5.17e-01 | 0.0898 |
| 84419 | C15orf48 | GSM4909296 | Human | Breast | IDC | 2.16e-18 | -7.03e-01 | 0.1524 |
| 84419 | C15orf48 | GSM4909297 | Human | Breast | IDC | 2.00e-11 | -5.55e-01 | 0.1517 |
| 84419 | C15orf48 | GSM4909298 | Human | Breast | IDC | 2.24e-31 | -8.24e-01 | 0.1551 |
| 84419 | C15orf48 | GSM4909299 | Human | Breast | IDC | 5.33e-13 | -6.63e-01 | 0.035 |
| 84419 | C15orf48 | GSM4909300 | Human | Breast | IDC | 9.36e-06 | -6.34e-01 | 0.0334 |
| 84419 | C15orf48 | GSM4909302 | Human | Breast | IDC | 4.47e-02 | -3.21e-01 | 0.1545 |
| 84419 | C15orf48 | GSM4909304 | Human | Breast | IDC | 1.38e-27 | -8.10e-01 | 0.1636 |
| 84419 | C15orf48 | GSM4909305 | Human | Breast | IDC | 1.48e-10 | -5.94e-01 | 0.0436 |
| Page: 1 2 3 4 5 6 7 8 9 10 |
| Tissue | Expression Dynamics | Abbreviation |
| Breast | 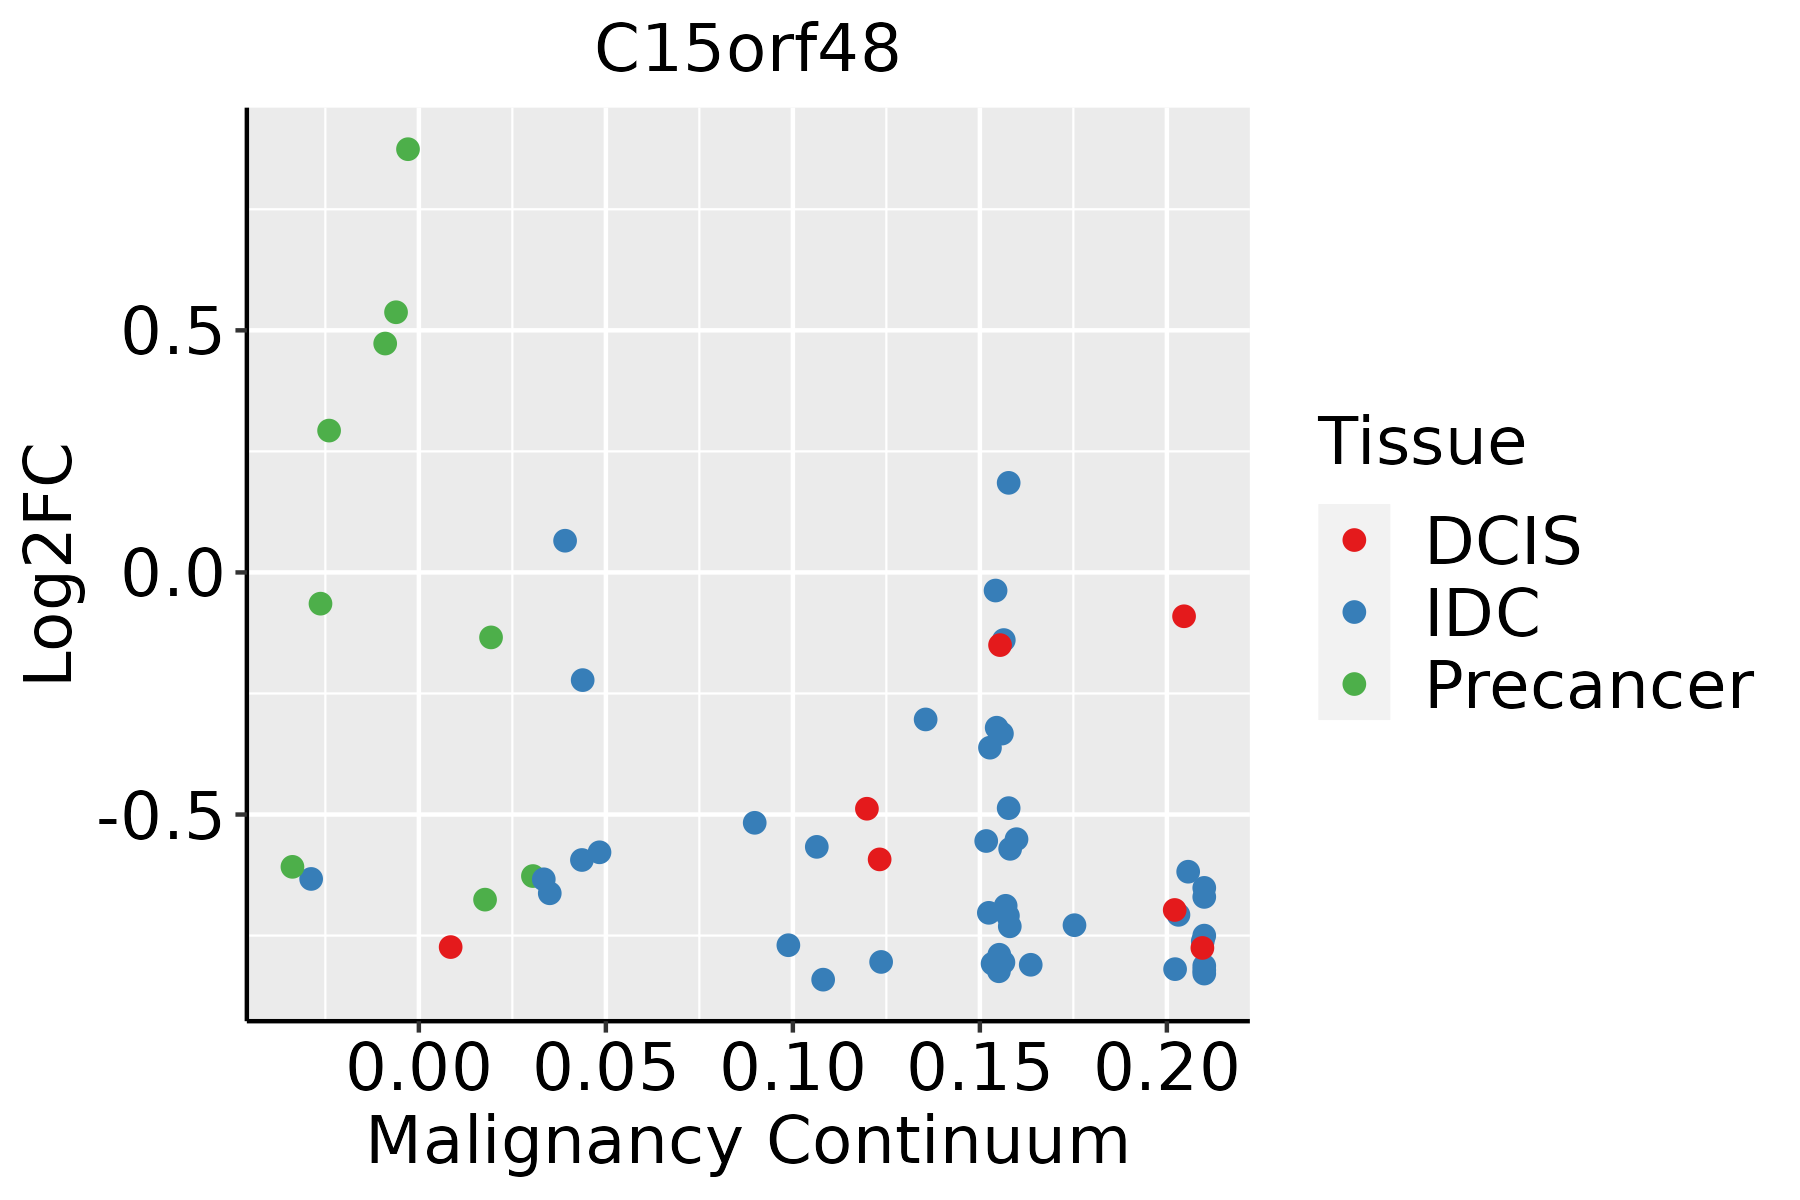 | IDC: Invasive ductal carcinoma |
| DCIS: Ductal carcinoma in situ | ||
| Precancer(BRCA1-mut): Precancerous lesion from BRCA1 mutation carriers | ||
| Cervix |  | CC: Cervix cancer |
| HSIL_HPV: HPV-infected high-grade squamous intraepithelial lesions | ||
| N_HPV: HPV-infected normal cervix | ||
| Colorectum (GSE201348) |  | FAP: Familial adenomatous polyposis |
| CRC: Colorectal cancer | ||
| Colorectum (HTA11) |  | AD: Adenomas |
| SER: Sessile serrated lesions | ||
| MSI-H: Microsatellite-high colorectal cancer | ||
| MSS: Microsatellite stable colorectal cancer | ||
| Esophagus | 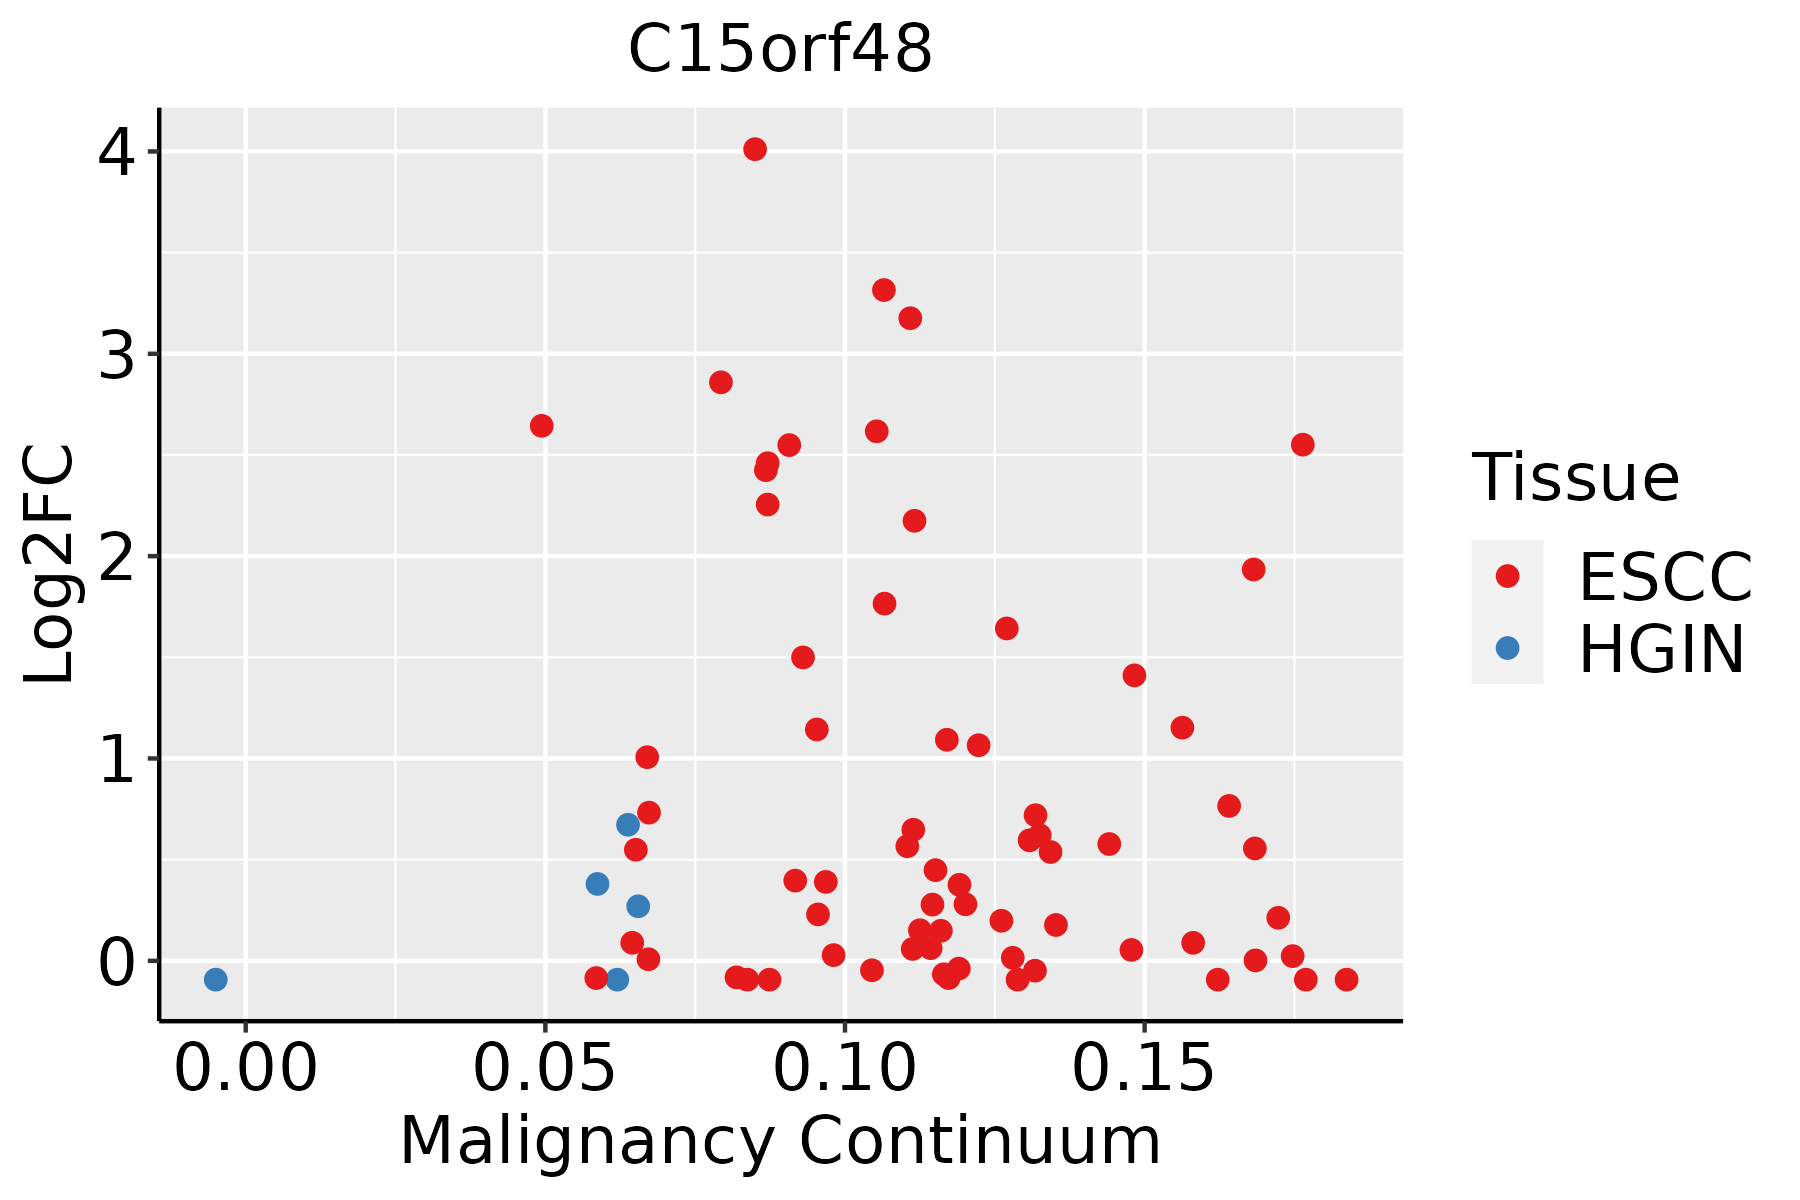 | ESCC: Esophageal squamous cell carcinoma |
| HGIN: High-grade intraepithelial neoplasias | ||
| LGIN: Low-grade intraepithelial neoplasias | ||
| GC | 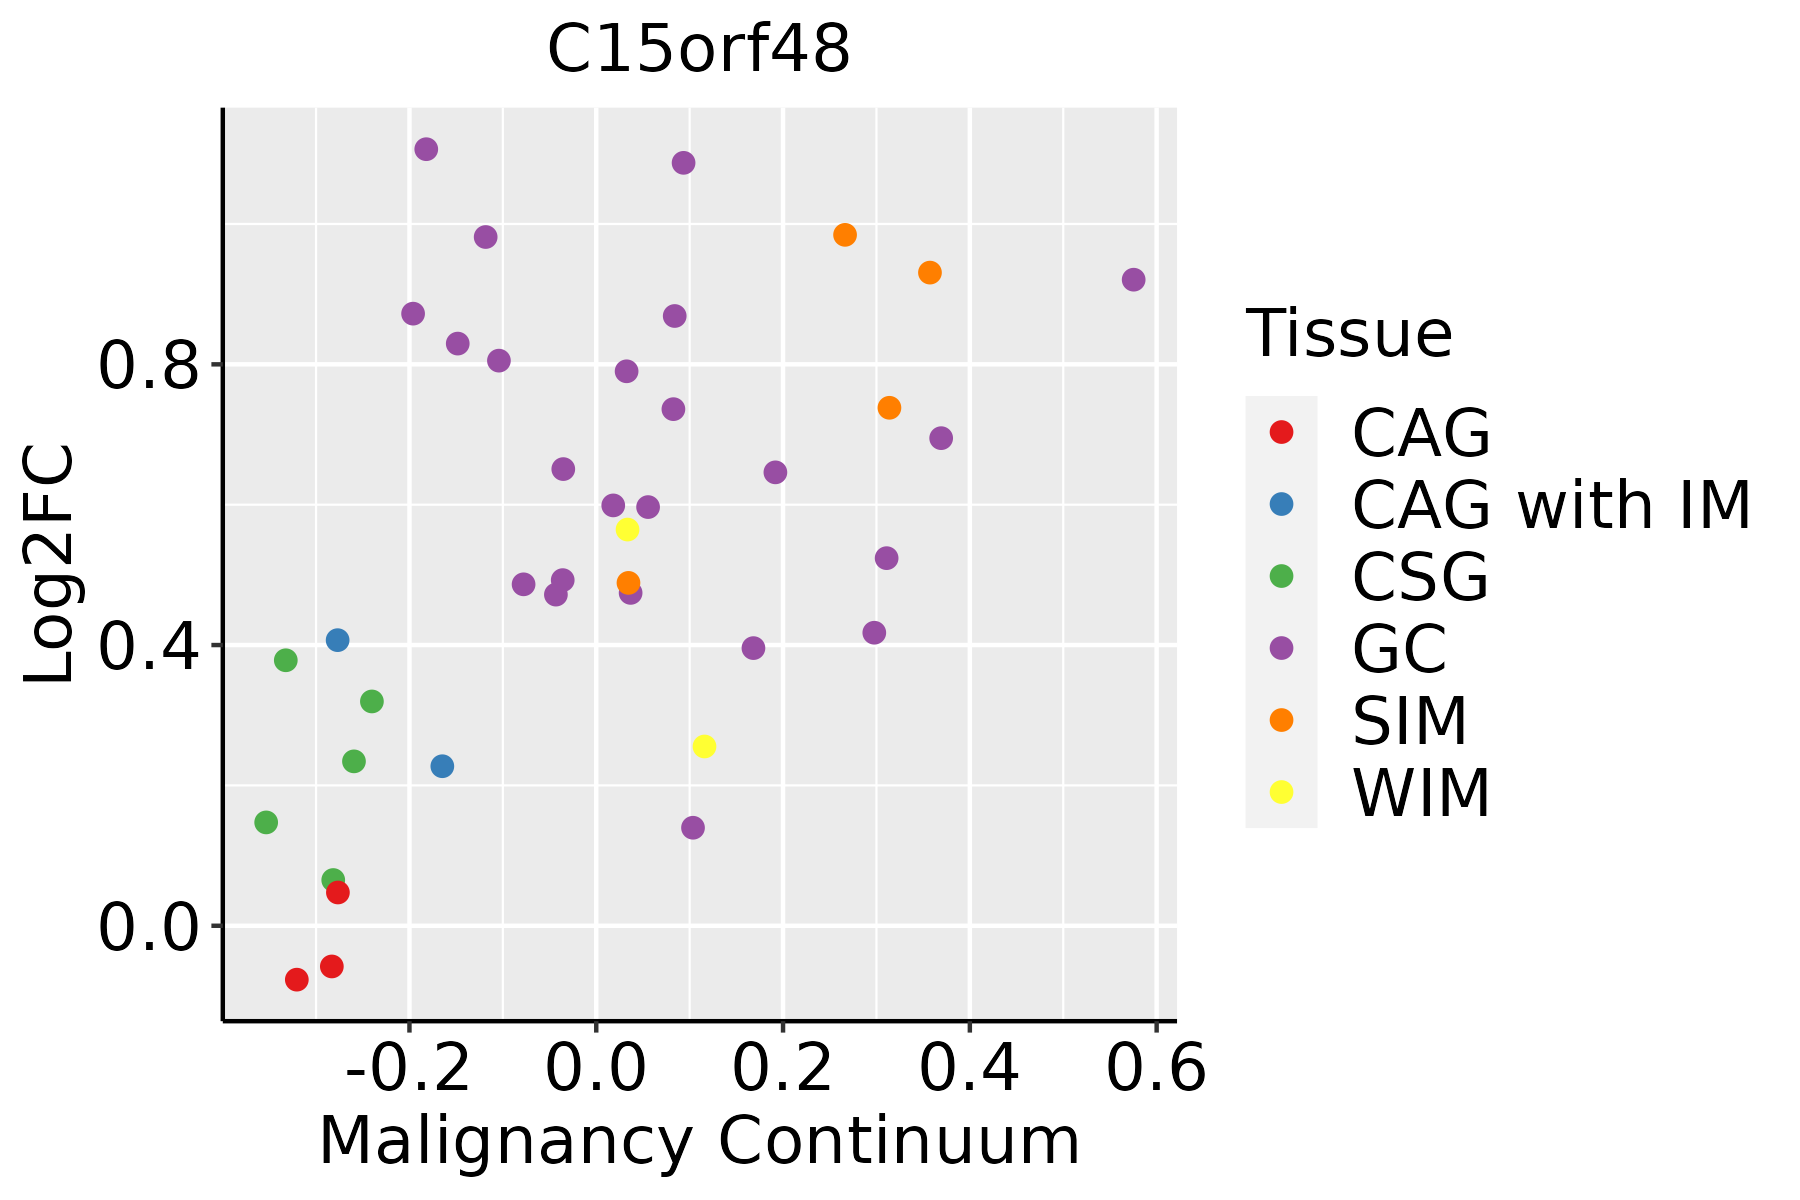 | CAG: Chronic atrophic gastritis |
| CAG with IM: Chronic atrophic gastritis with intestinal metaplasia | ||
| CSG: Chronic superficial gastritis | ||
| GC: Gastric cancer | ||
| SIM: Severe intestinal metaplasia | ||
| WIM: Wild intestinal metaplasia | ||
| Liver | 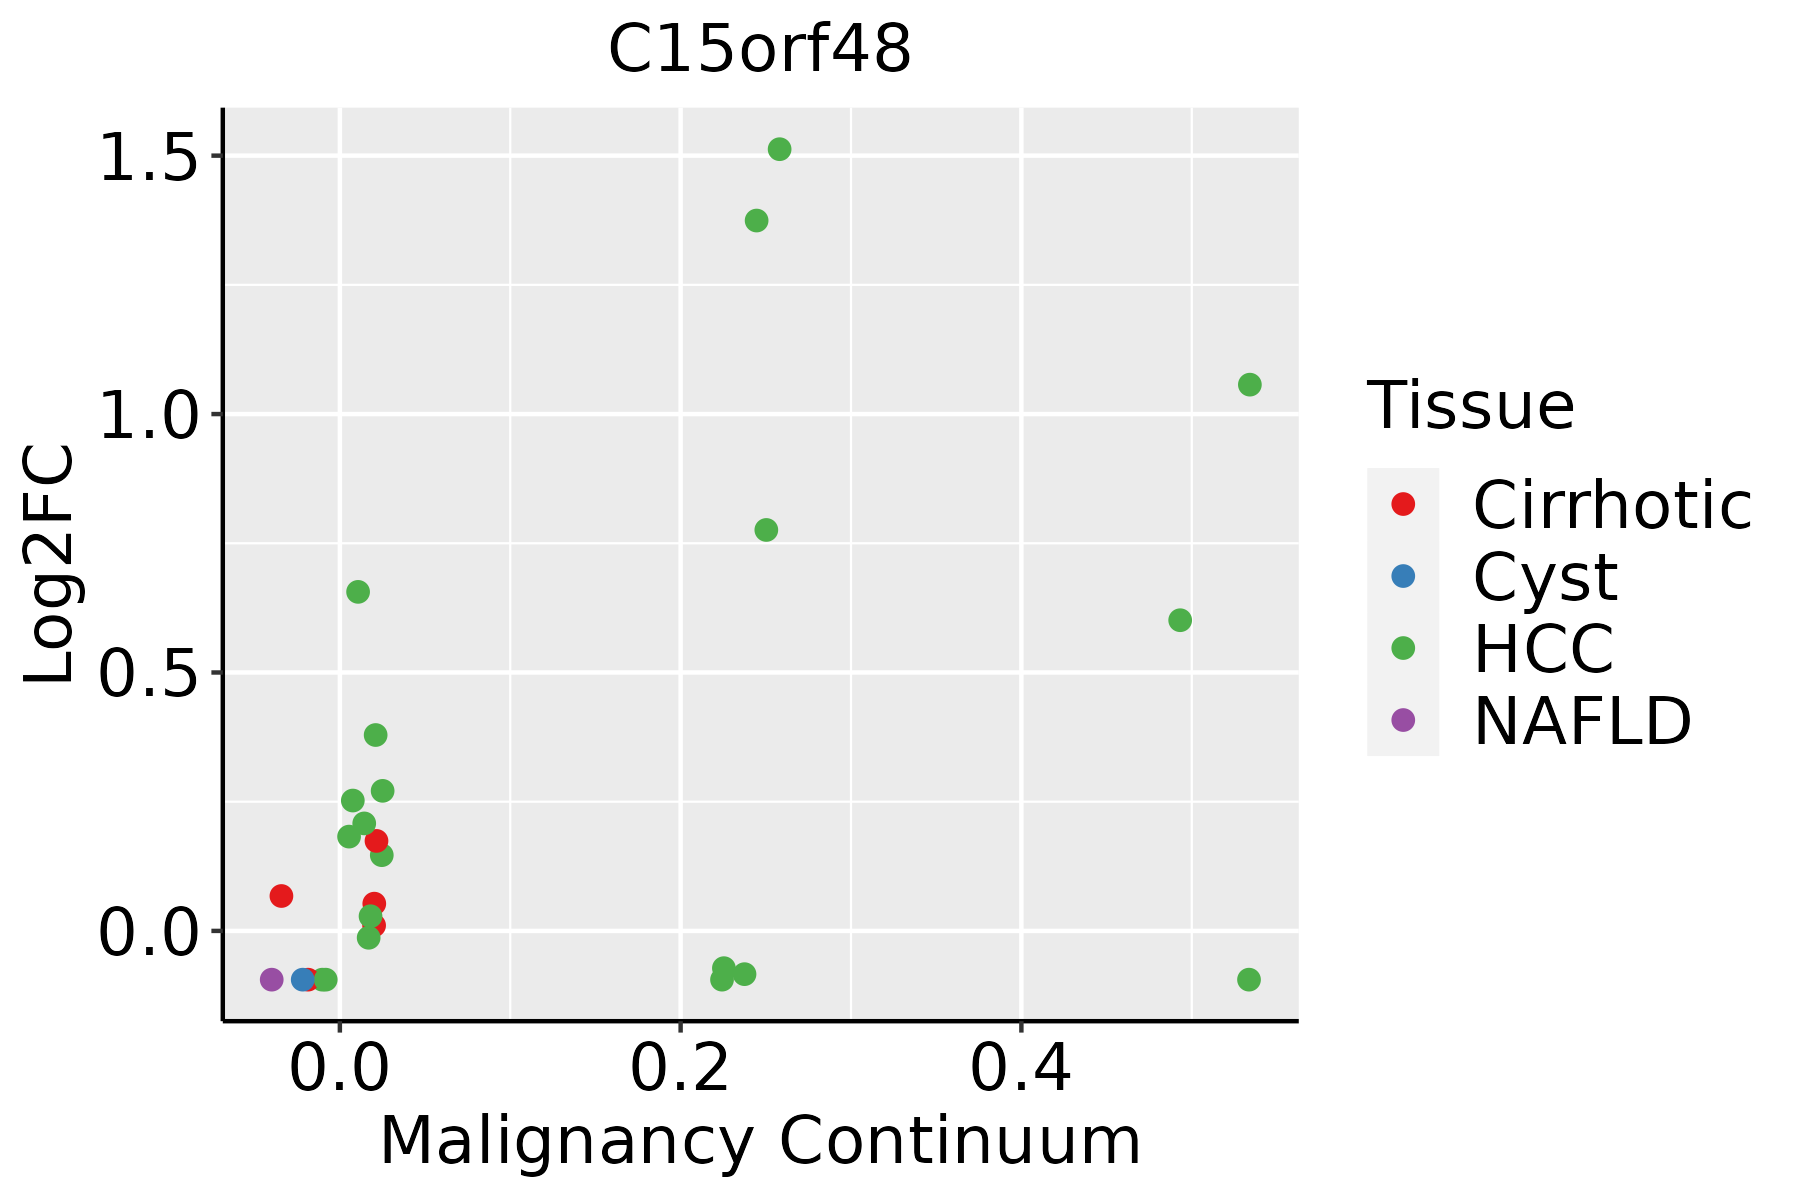 | HCC: Hepatocellular carcinoma |
| NAFLD: Non-alcoholic fatty liver disease | ||
| Lung | 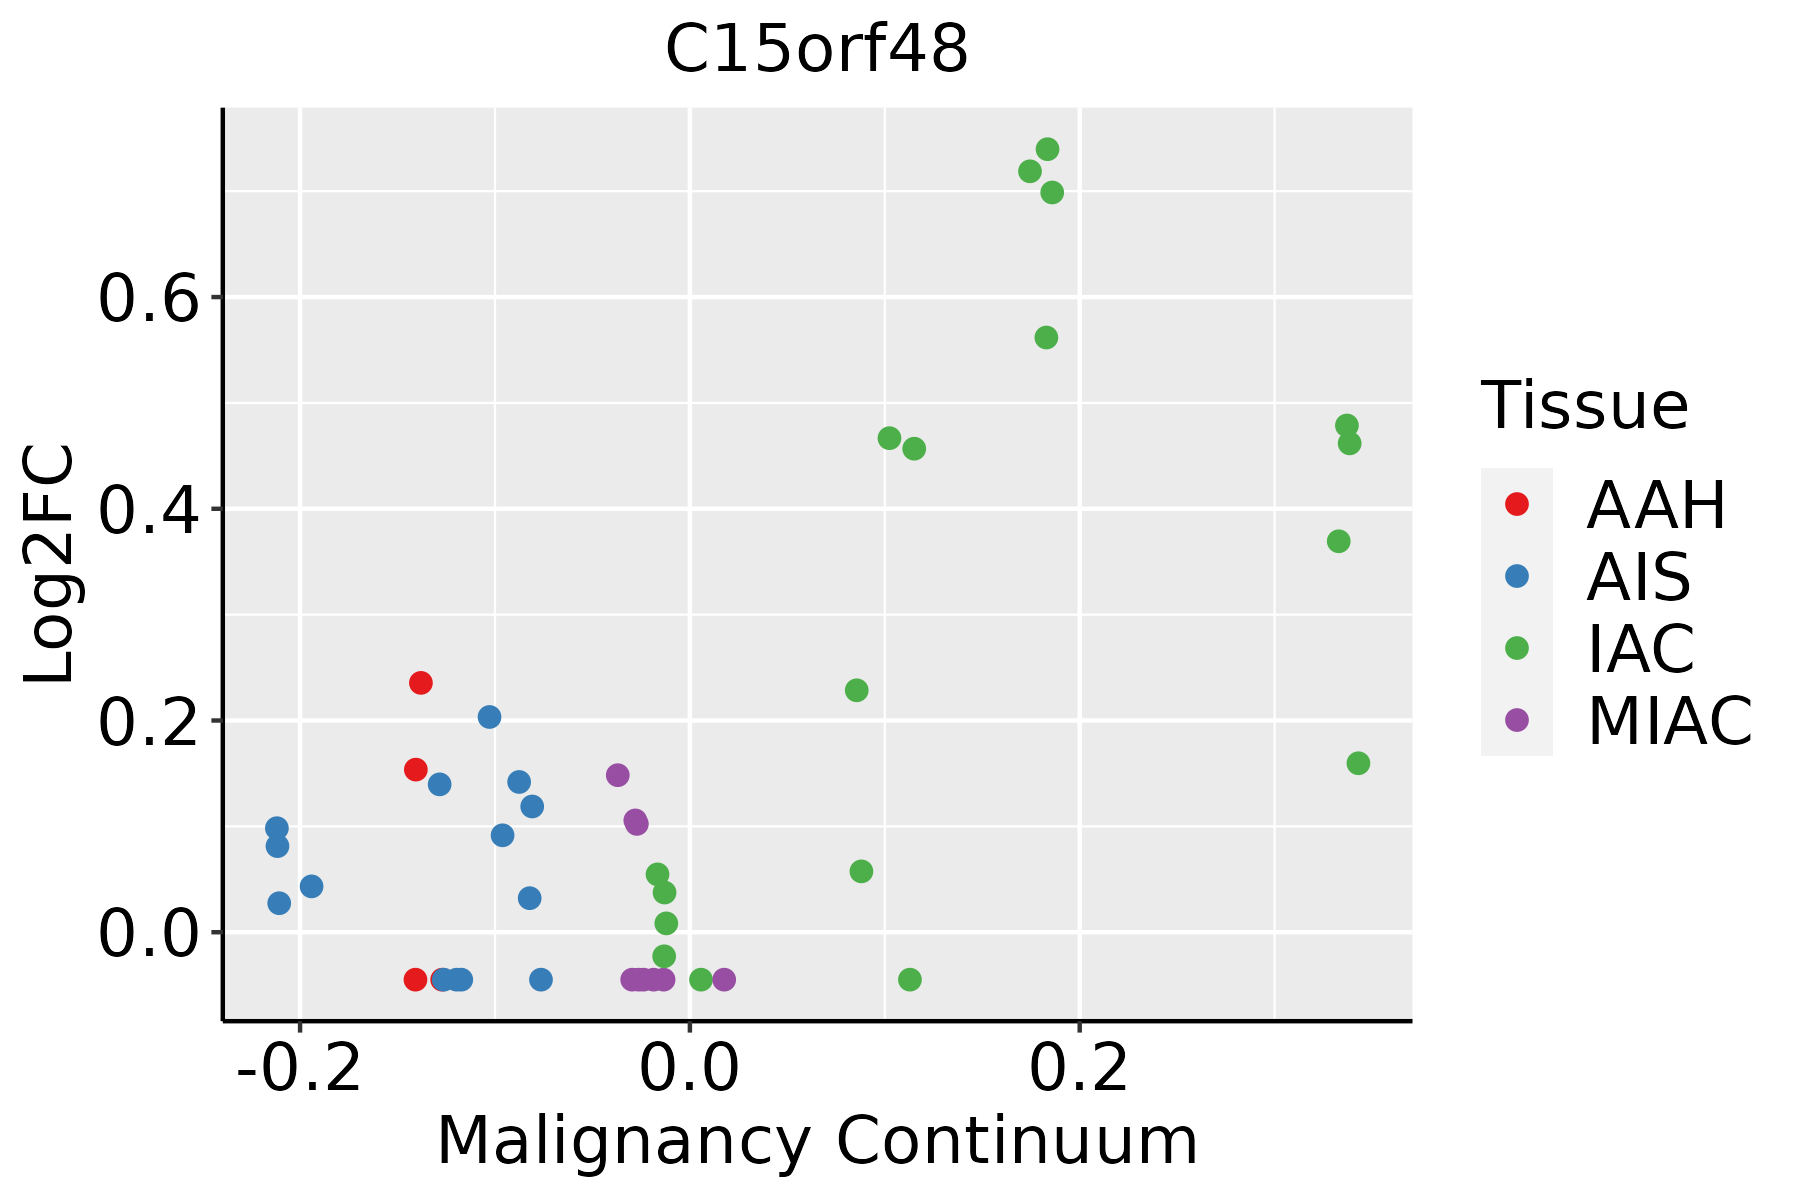 | AAH: Atypical adenomatous hyperplasia |
| AIS: Adenocarcinoma in situ | ||
| IAC: Invasive lung adenocarcinoma | ||
| MIA: Minimally invasive adenocarcinoma | ||
| Oral Cavity | 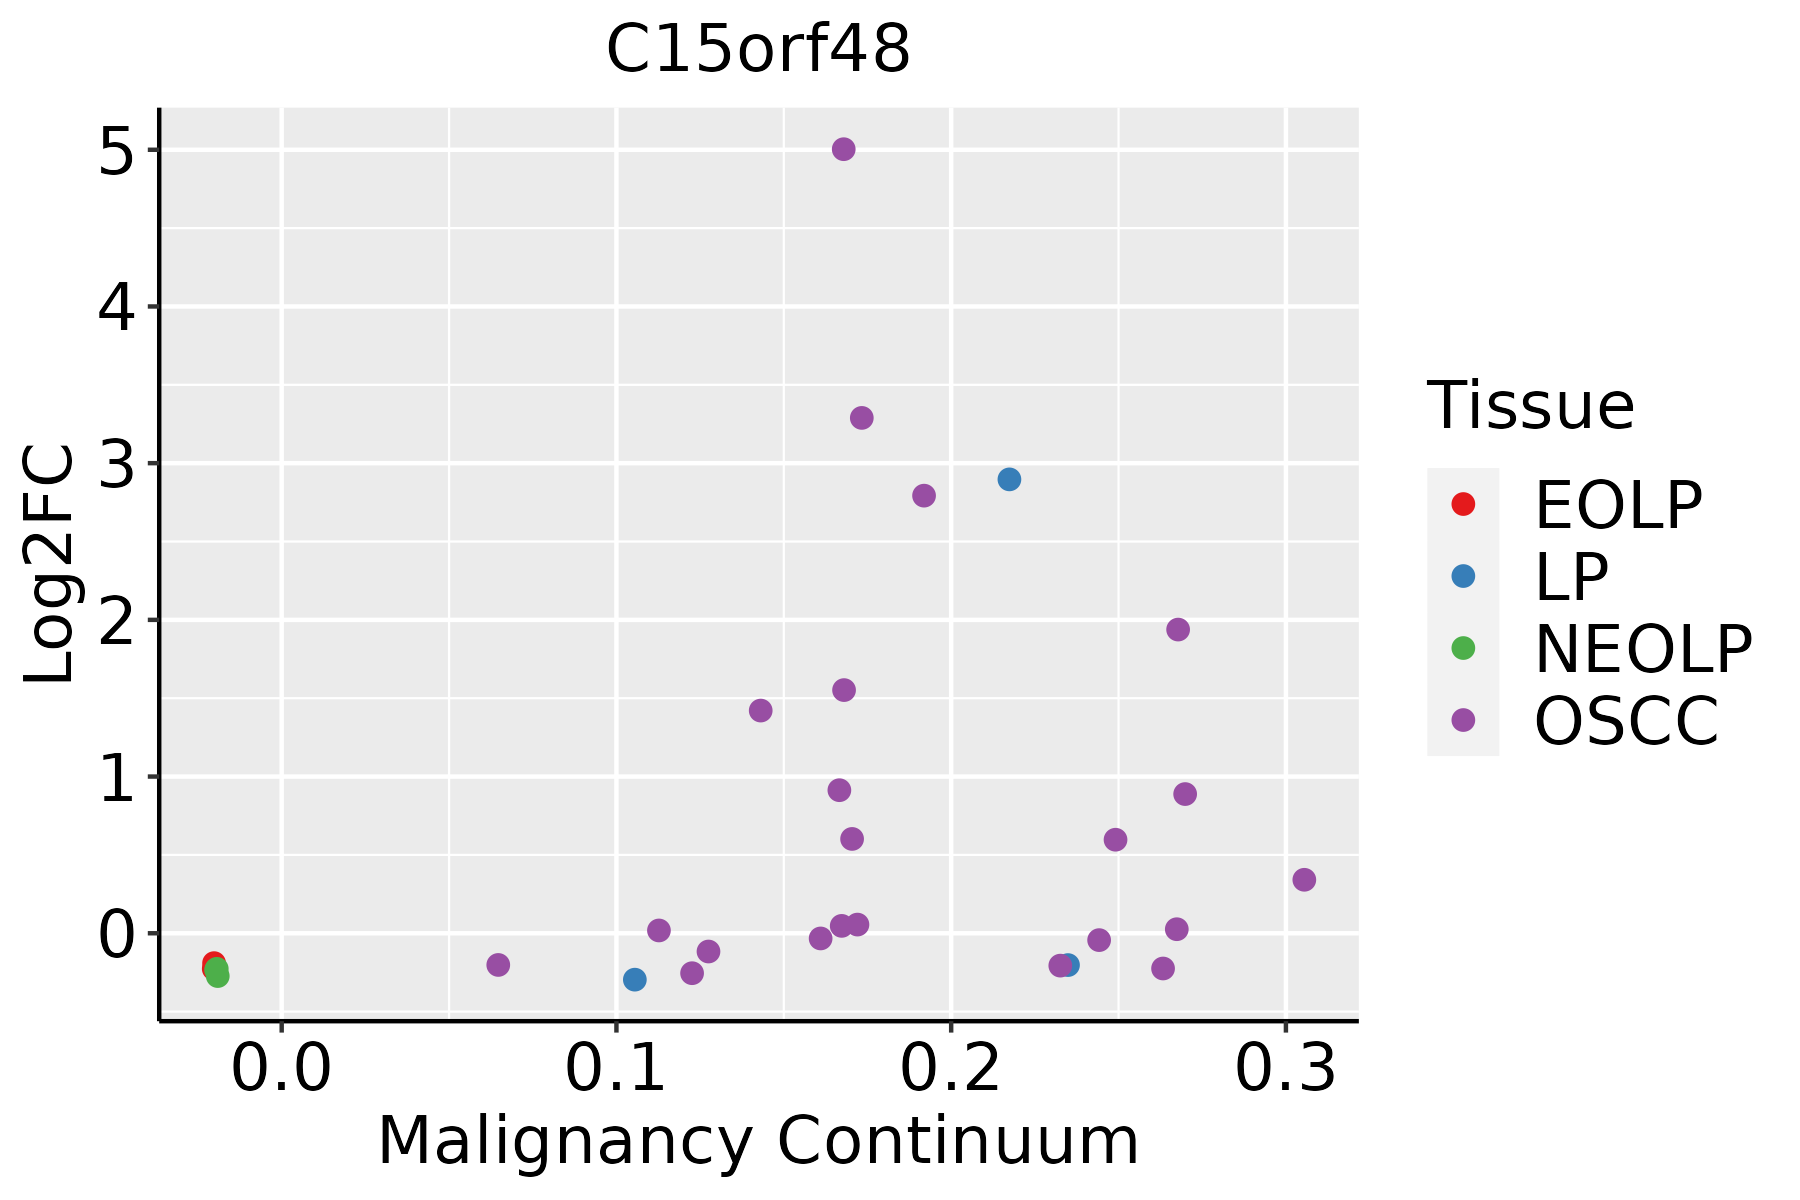 | EOLP: Erosive Oral lichen planus |
| LP: leukoplakia | ||
| NEOLP: Non-erosive oral lichen planus | ||
| OSCC: Oral squamous cell carcinoma | ||
| Thyroid | 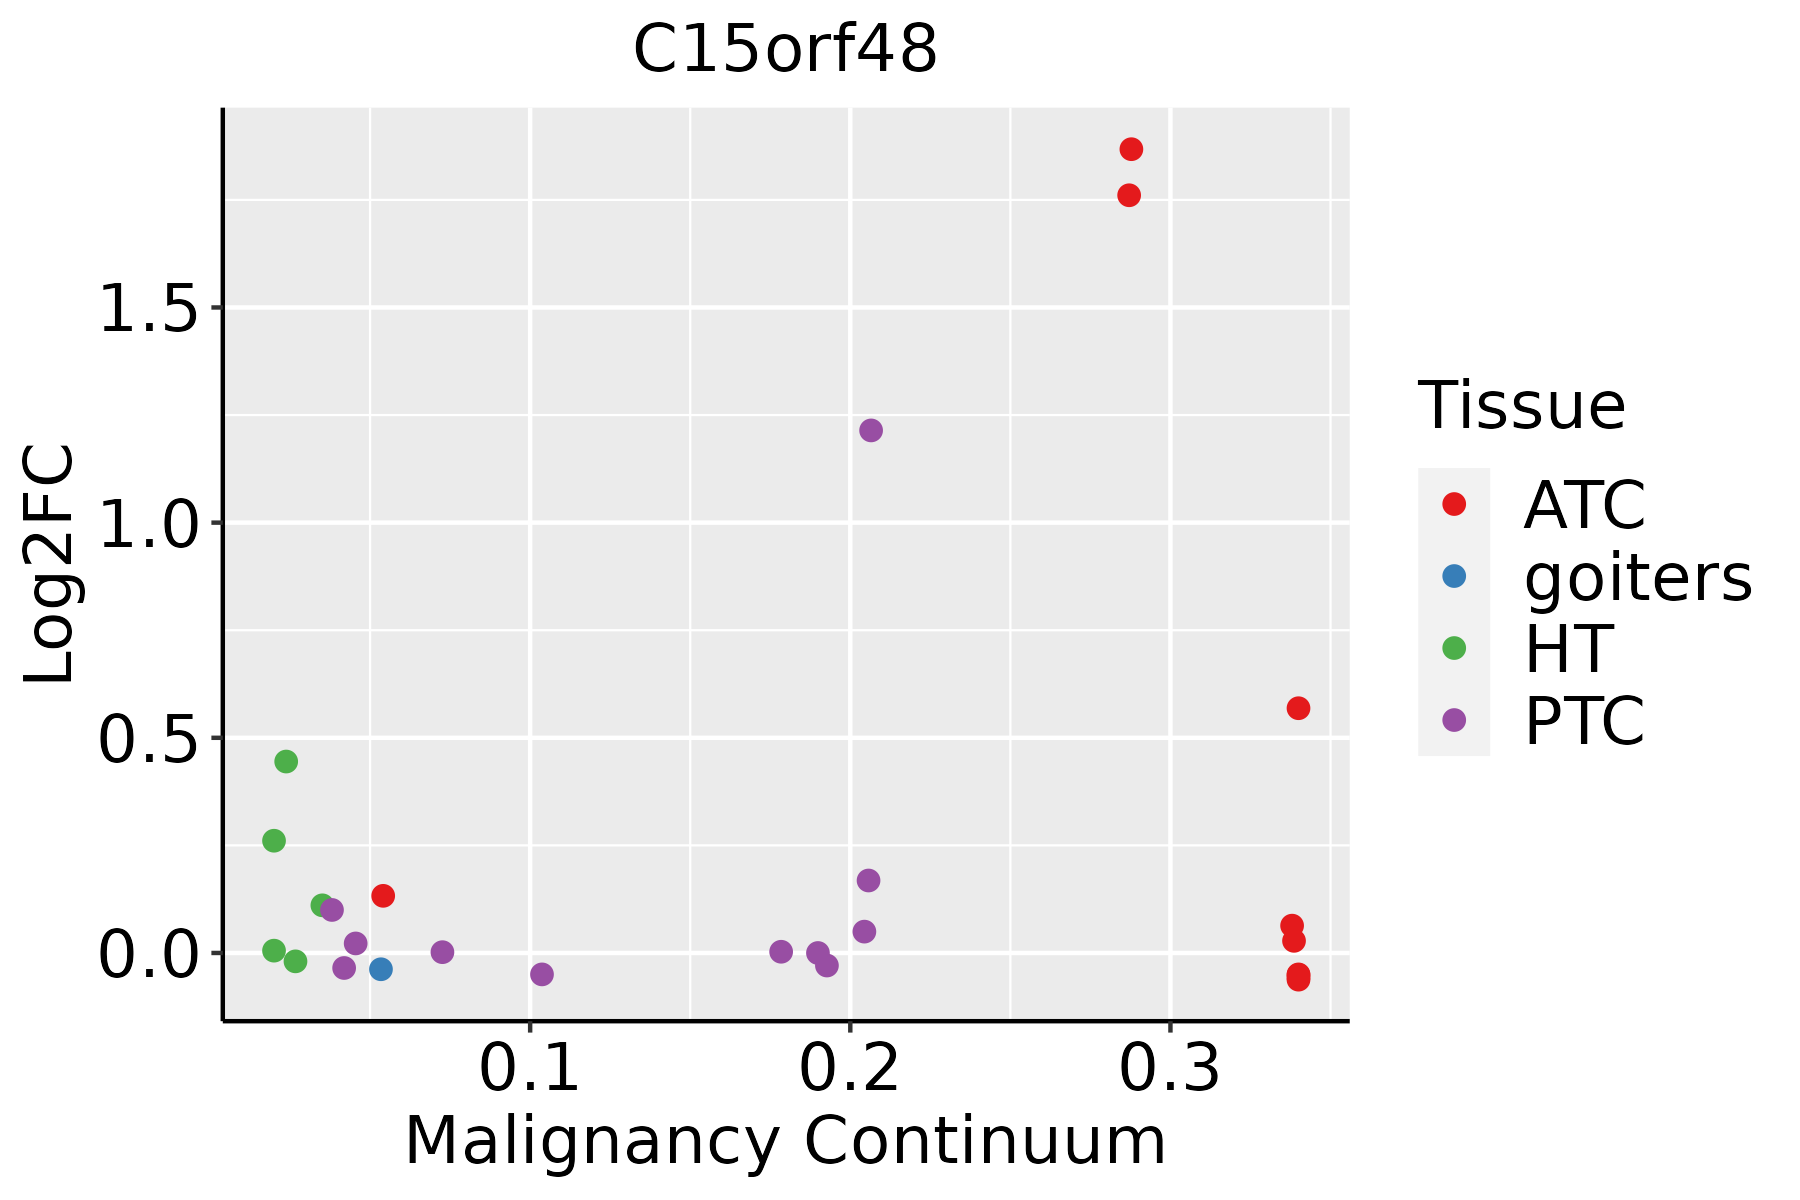 | ATC: Anaplastic thyroid cancer |
| HT: Hashimoto's thyroiditis | ||
| PTC: Papillary thyroid cancer |
| ∗log2FC in expression of this searched gene in stem-like cells from each diseased tissue sample relative to stem-like cells in normal samples in each tissue plotted against the malignancy continuum. Samples are colored based on if they are from different disease stage. |
Top |
Malignant transformation related pathway analysis |
| Find out the enriched GO biological processes and KEGG pathways involved in transition from healthy to precancer to cancer |
| Tissue | Disease Stage | Enriched GO biological Processes |
| Colorectum | AD |  |
| Colorectum | SER |  |
| Colorectum | MSS |  |
| Colorectum | MSI-H |  |
| Colorectum | FAP |  |
| ∗Top 15 enriched GO BP terms are showed in the bar plot of each disease state in each tissue. Each row represents a significant GO biological process which is colored according to the -log10(p.adjust). |
| Page: 1 2 3 4 5 6 7 8 9 |
| GO ID | Tissue | Disease Stage | Description | Gene Ratio | Bg Ratio | pvalue | p.adjust | Count |
| Page: 1 |
| Pathway ID | Tissue | Disease Stage | Description | Gene Ratio | Bg Ratio | pvalue | p.adjust | qvalue | Count |
| Page: 1 |
Top |
Cell-cell communication analysis |
| Identification of potential cell-cell interactions between two cell types and their ligand-receptor pairs for different disease states |
| Ligand | Receptor | LRpair | Pathway | Tissue | Disease Stage |
| Page: 1 |
Top |
Single-cell gene regulatory network inference analysis |
| Find out the significant the regulons (TFs) and the target genes of each regulon across cell types for different disease states |
| TF | Cell Type | Tissue | Disease Stage | Target Gene | RSS | Regulon Activity |
| ∗The dot plots of a searched regulon are shown for all cell subpopulations in each disease state of each tissue based on the regulon specific score inferred using pySCENIC and by calculating the average expression. |
| Page: 1 |
Top |
Somatic mutation of malignant transformation related genes |
| Annotation of somatic variants for genes involved in malignant transformation |
| Hugo Symbol | Variant Class | Variant Classification | dbSNP RS | HGVSc | HGVSp | HGVSp Short | SWISSPROT | BIOTYPE | SIFT | PolyPhen | Tumor Sample Barcode | Tissue | Histology | Sex | Age | Stage | Therapy Types | Drugs | Outcome |
| C15orf48 | SNV | Missense_Mutation | c.220G>C | p.Glu74Gln | p.E74Q | Q9C002 | protein_coding | deleterious(0.01) | probably_damaging(0.999) | TCGA-AN-A0FV-01 | Breast | breast invasive carcinoma | Female | <65 | I/II | Unknown | Unknown | SD | |
| C15orf48 | insertion | In_Frame_Ins | novel | c.168_169insTCTTGTGTTTATTCTTTTACCCATTGGCCCTTCTCC | p.Pro56_Thr57insSerCysValTyrSerPheThrHisTrpProPheSer | p.P56_T57insSCVYSFTHWPFS | Q9C002 | protein_coding | TCGA-B6-A0IA-01 | Breast | breast invasive carcinoma | Female | <65 | I/II | Unknown | Unknown | SD | ||
| C15orf48 | SNV | Missense_Mutation | novel | c.71N>T | p.Ala24Val | p.A24V | Q9C002 | protein_coding | deleterious(0.02) | possibly_damaging(0.751) | TCGA-AA-3966-01 | Colorectum | colon adenocarcinoma | Female | >=65 | I/II | Unknown | Unknown | SD |
| C15orf48 | SNV | Missense_Mutation | c.86N>T | p.Ser29Phe | p.S29F | Q9C002 | protein_coding | tolerated(0.3) | benign(0.014) | TCGA-AZ-6599-01 | Colorectum | colon adenocarcinoma | Male | >=65 | I/II | Unknown | Unknown | SD | |
| C15orf48 | SNV | Missense_Mutation | rs781407831 | c.183N>T | p.Lys61Asn | p.K61N | Q9C002 | protein_coding | deleterious(0) | probably_damaging(0.999) | TCGA-AG-A002-01 | Colorectum | rectum adenocarcinoma | Male | <65 | I/II | Unknown | Unknown | SD |
| C15orf48 | SNV | Missense_Mutation | novel | c.227N>G | p.Gln76Arg | p.Q76R | Q9C002 | protein_coding | tolerated(0.05) | possibly_damaging(0.491) | TCGA-A5-A0G2-01 | Endometrium | uterine corpus endometrioid carcinoma | Female | <65 | III/IV | Unknown | Unknown | SD |
| C15orf48 | SNV | Missense_Mutation | rs143173357 | c.91N>A | p.Ala31Thr | p.A31T | Q9C002 | protein_coding | deleterious(0.01) | benign(0.37) | TCGA-AJ-A3EK-01 | Endometrium | uterine corpus endometrioid carcinoma | Female | <65 | I/II | Chemotherapy | carboplatin | CR |
| C15orf48 | SNV | Missense_Mutation | novel | c.37N>T | p.Leu13Phe | p.L13F | Q9C002 | protein_coding | deleterious(0) | probably_damaging(0.994) | TCGA-AP-A059-01 | Endometrium | uterine corpus endometrioid carcinoma | Female | >=65 | I/II | Unknown | Unknown | SD |
| C15orf48 | SNV | Missense_Mutation | novel | c.101N>A | p.Ser34Tyr | p.S34Y | Q9C002 | protein_coding | deleterious(0.01) | possibly_damaging(0.768) | TCGA-B5-A1MR-01 | Endometrium | uterine corpus endometrioid carcinoma | Female | >=65 | III/IV | Unknown | Unknown | SD |
| C15orf48 | SNV | Missense_Mutation | novel | c.74N>A | p.Gly25Asp | p.G25D | Q9C002 | protein_coding | tolerated(0.22) | benign(0.062) | TCGA-38-4628-01 | Lung | lung adenocarcinoma | Female | >=65 | I/II | Chemotherapy | carboplatin | PD |
| Page: 1 2 |
Top |
Related drugs of malignant transformation related genes |
| Identification of chemicals and drugs interact with genes involved in malignant transfromation |
| (DGIdb 4.0) |
| Entrez ID | Symbol | Category | Interaction Types | Drug Claim Name | Drug Name | PMIDs |
| Page: 1 |

Copyright 2023-Present -The University of Texas Health Science Center at Houston |