
|
|||||
|
 | |
| |
| |
| |
| |
| |
|
Gene: C15orf41 |
Gene summary for C15ORF41 |
| Gene information | Species | Human | Gene symbol | C15orf41 | Gene ID | 84529 |
| Gene name | CDAN1 interacting nuclease 1 | |
| Gene Alias | C15orf41 | |
| Cytomap | 15q14 | |
| Gene Type | protein-coding | GO ID | GO:0002262 | UniProtAcc | Q9Y2V0 |
Top |
Malignant transformation analysis |
| Identification of the aberrant gene expression in precancerous and cancerous lesions by comparing the gene expression of stem-like cells in diseased tissues with normal stem cells |
| Entrez ID | Symbol | Replicates | Species | Organ | Tissue | Adj P-value | Log2FC | Malignancy |
| 84529 | C15orf41 | CA_HPV_3 | Human | Cervix | CC | 2.77e-02 | 1.32e-01 | 0.0414 |
| 84529 | C15orf41 | CCI_1 | Human | Cervix | CC | 1.43e-05 | 1.44e+00 | 0.528 |
| 84529 | C15orf41 | CCI_3 | Human | Cervix | CC | 6.23e-11 | 5.86e-01 | 0.516 |
| 84529 | C15orf41 | LZE4T | Human | Esophagus | ESCC | 6.33e-05 | 1.85e-01 | 0.0811 |
| 84529 | C15orf41 | LZE5T | Human | Esophagus | ESCC | 3.43e-02 | 2.34e-01 | 0.0514 |
| 84529 | C15orf41 | LZE7T | Human | Esophagus | ESCC | 3.96e-02 | 1.41e-01 | 0.0667 |
| 84529 | C15orf41 | LZE22T | Human | Esophagus | ESCC | 3.09e-02 | 2.34e-01 | 0.068 |
| 84529 | C15orf41 | LZE24T | Human | Esophagus | ESCC | 1.86e-04 | 9.62e-02 | 0.0596 |
| 84529 | C15orf41 | P2T-E | Human | Esophagus | ESCC | 8.69e-12 | 1.75e-01 | 0.1177 |
| 84529 | C15orf41 | P4T-E | Human | Esophagus | ESCC | 1.95e-07 | 2.18e-01 | 0.1323 |
| 84529 | C15orf41 | P5T-E | Human | Esophagus | ESCC | 6.06e-09 | 2.14e-01 | 0.1327 |
| 84529 | C15orf41 | P8T-E | Human | Esophagus | ESCC | 6.73e-13 | 3.07e-01 | 0.0889 |
| 84529 | C15orf41 | P9T-E | Human | Esophagus | ESCC | 1.33e-02 | 6.96e-02 | 0.1131 |
| 84529 | C15orf41 | P10T-E | Human | Esophagus | ESCC | 2.80e-16 | 2.86e-01 | 0.116 |
| 84529 | C15orf41 | P12T-E | Human | Esophagus | ESCC | 4.32e-19 | 3.83e-01 | 0.1122 |
| 84529 | C15orf41 | P15T-E | Human | Esophagus | ESCC | 1.89e-17 | 2.46e-01 | 0.1149 |
| 84529 | C15orf41 | P16T-E | Human | Esophagus | ESCC | 8.00e-09 | 2.26e-01 | 0.1153 |
| 84529 | C15orf41 | P19T-E | Human | Esophagus | ESCC | 4.04e-03 | 2.33e-01 | 0.1662 |
| 84529 | C15orf41 | P20T-E | Human | Esophagus | ESCC | 1.65e-09 | 1.91e-01 | 0.1124 |
| 84529 | C15orf41 | P21T-E | Human | Esophagus | ESCC | 7.68e-05 | 1.31e-01 | 0.1617 |
| Page: 1 2 3 |
| Tissue | Expression Dynamics | Abbreviation |
| Cervix | 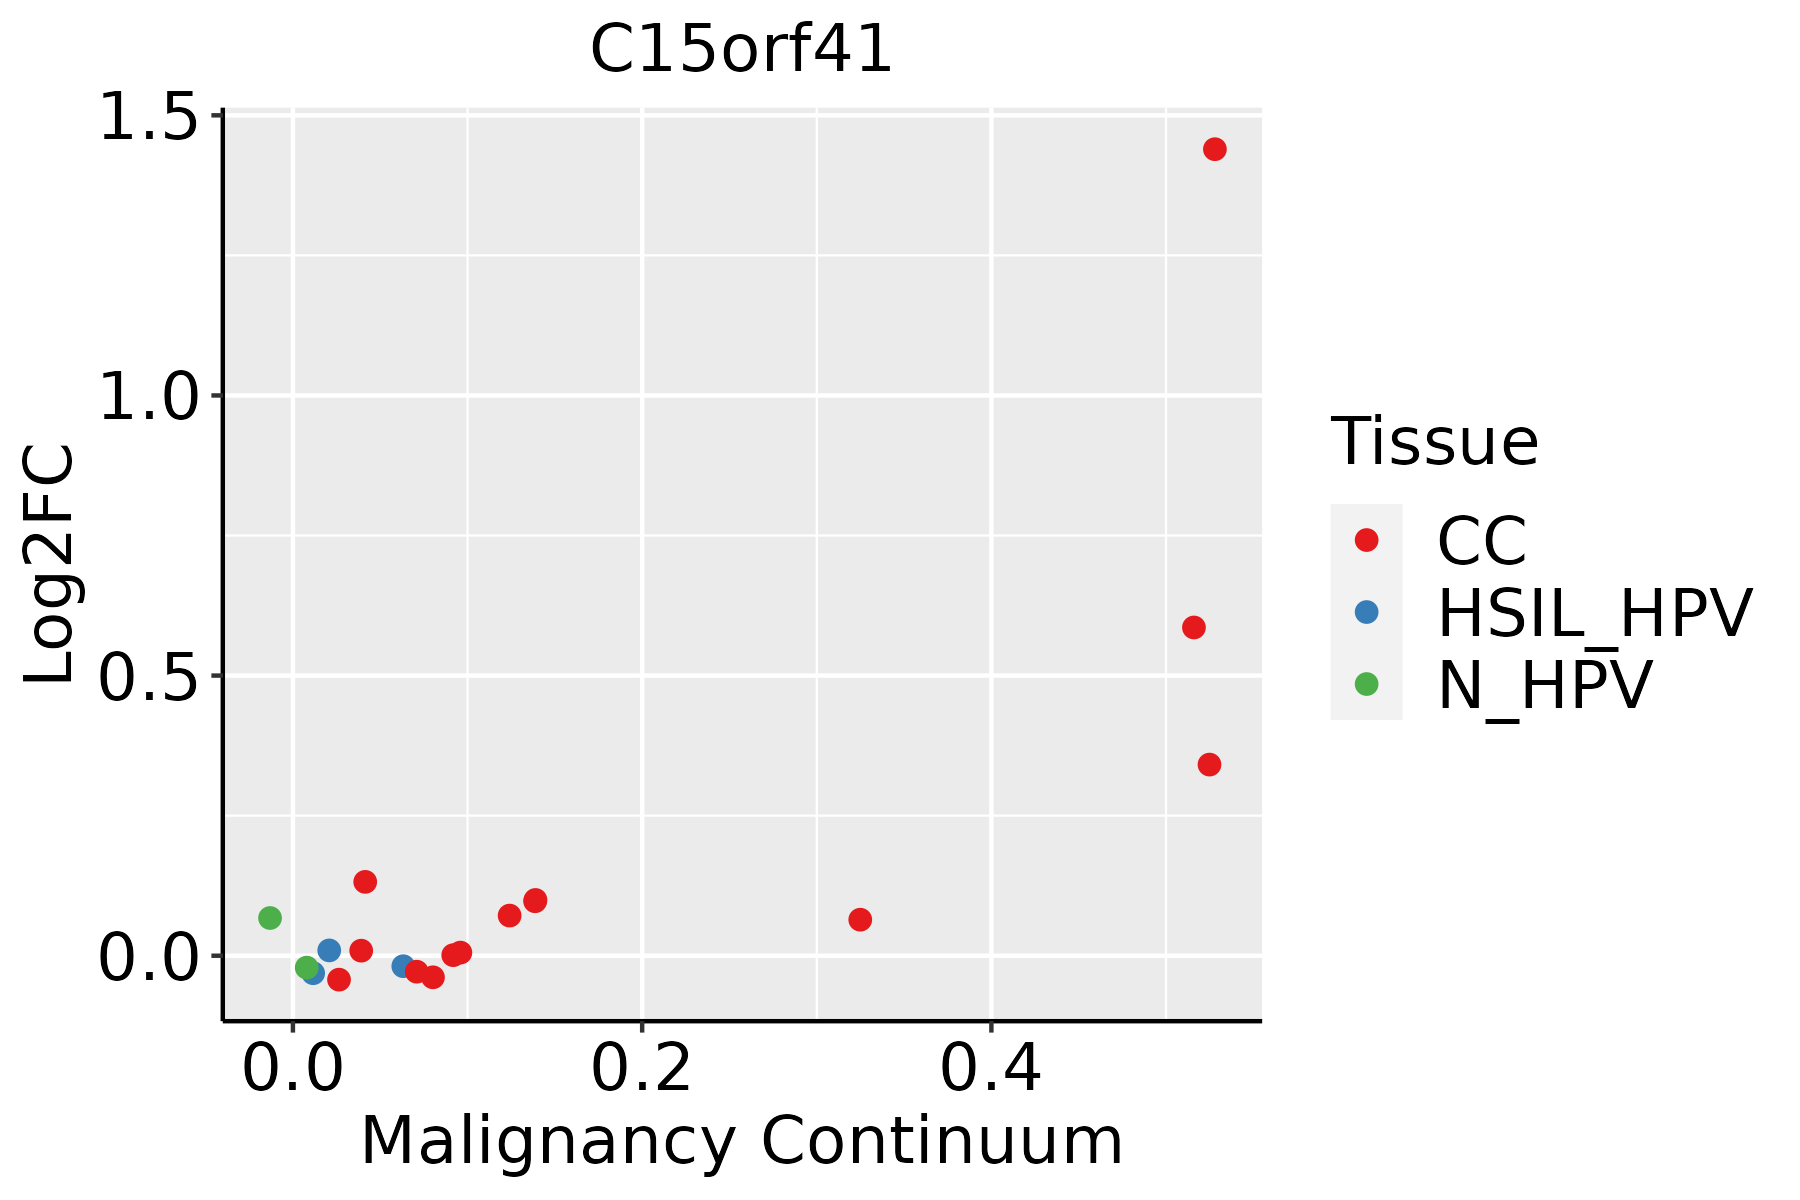 | CC: Cervix cancer |
| HSIL_HPV: HPV-infected high-grade squamous intraepithelial lesions | ||
| N_HPV: HPV-infected normal cervix | ||
| Esophagus |  | ESCC: Esophageal squamous cell carcinoma |
| HGIN: High-grade intraepithelial neoplasias | ||
| LGIN: Low-grade intraepithelial neoplasias |
| ∗log2FC in expression of this searched gene in stem-like cells from each diseased tissue sample relative to stem-like cells in normal samples in each tissue plotted against the malignancy continuum. Samples are colored based on if they are from different disease stage. |
Top |
Malignant transformation related pathway analysis |
| Find out the enriched GO biological processes and KEGG pathways involved in transition from healthy to precancer to cancer |
| Tissue | Disease Stage | Enriched GO biological Processes |
| Colorectum | AD |  |
| Colorectum | SER |  |
| Colorectum | MSS |  |
| Colorectum | MSI-H |  |
| Colorectum | FAP |  |
| ∗Top 15 enriched GO BP terms are showed in the bar plot of each disease state in each tissue. Each row represents a significant GO biological process which is colored according to the -log10(p.adjust). |
| Page: 1 2 3 4 5 6 7 8 9 |
| GO ID | Tissue | Disease Stage | Description | Gene Ratio | Bg Ratio | pvalue | p.adjust | Count |
| Page: 1 |
| Pathway ID | Tissue | Disease Stage | Description | Gene Ratio | Bg Ratio | pvalue | p.adjust | qvalue | Count |
| Page: 1 |
Top |
Cell-cell communication analysis |
| Identification of potential cell-cell interactions between two cell types and their ligand-receptor pairs for different disease states |
| Ligand | Receptor | LRpair | Pathway | Tissue | Disease Stage |
| Page: 1 |
Top |
Single-cell gene regulatory network inference analysis |
| Find out the significant the regulons (TFs) and the target genes of each regulon across cell types for different disease states |
| TF | Cell Type | Tissue | Disease Stage | Target Gene | RSS | Regulon Activity |
| ∗The dot plots of a searched regulon are shown for all cell subpopulations in each disease state of each tissue based on the regulon specific score inferred using pySCENIC and by calculating the average expression. |
| Page: 1 |
Top |
Somatic mutation of malignant transformation related genes |
| Annotation of somatic variants for genes involved in malignant transformation |
| Hugo Symbol | Variant Class | Variant Classification | dbSNP RS | HGVSc | HGVSp | HGVSp Short | SWISSPROT | BIOTYPE | SIFT | PolyPhen | Tumor Sample Barcode | Tissue | Histology | Sex | Age | Stage | Therapy Types | Drugs | Outcome |
| C15orf41 | insertion | Nonsense_Mutation | novel | c.821_822insGCTCACTCCATGTTTTTGAAAGTTTCAGTTATACAAAAAA | p.Cys274TrpfsTer7 | p.C274Wfs*7 | protein_coding | TCGA-A2-A0EO-01 | Breast | breast invasive carcinoma | Female | <65 | I/II | Hormone Therapy | tamoxiphen | SD | |||
| C15orf41 | SNV | Missense_Mutation | c.682G>A | p.Glu228Lys | p.E228K | protein_coding | tolerated(0.22) | probably_damaging(0.931) | TCGA-C5-A1BL-01 | Cervix | cervical & endocervical cancer | Female | <65 | I/II | Unknown | Unknown | SD | ||
| C15orf41 | SNV | Missense_Mutation | c.559C>T | p.Arg187Cys | p.R187C | protein_coding | deleterious(0) | probably_damaging(0.999) | TCGA-EK-A2GZ-01 | Cervix | cervical & endocervical cancer | Female | <65 | III/IV | Unknown | Unknown | SD | ||
| C15orf41 | SNV | Missense_Mutation | novel | c.319T>G | p.Phe107Val | p.F107V | protein_coding | tolerated(0.06) | benign(0.127) | TCGA-AA-3666-01 | Colorectum | colon adenocarcinoma | Male | >=65 | III/IV | Unknown | Unknown | PD | |
| C15orf41 | SNV | Missense_Mutation | c.591N>A | p.Phe197Leu | p.F197L | protein_coding | tolerated(0.18) | benign(0.187) | TCGA-CA-6718-01 | Colorectum | colon adenocarcinoma | Male | <65 | I/II | Unknown | Unknown | PD | ||
| C15orf41 | SNV | Missense_Mutation | c.304N>G | p.Leu102Val | p.L102V | protein_coding | tolerated(0.58) | benign(0.003) | TCGA-AG-A014-01 | Colorectum | rectum adenocarcinoma | Male | >=65 | I/II | Unknown | Unknown | SD | ||
| C15orf41 | SNV | Missense_Mutation | novel | c.751N>C | p.Val251Leu | p.V251L | protein_coding | deleterious(0) | possibly_damaging(0.833) | TCGA-AG-A014-01 | Colorectum | rectum adenocarcinoma | Male | >=65 | I/II | Unknown | Unknown | SD | |
| C15orf41 | SNV | Missense_Mutation | novel | c.178N>T | p.His60Tyr | p.H60Y | protein_coding | tolerated(0.61) | benign(0.011) | TCGA-AJ-A3EK-01 | Endometrium | uterine corpus endometrioid carcinoma | Female | <65 | I/II | Chemotherapy | carboplatin | CR | |
| C15orf41 | SNV | Missense_Mutation | c.39G>C | p.Gln13His | p.Q13H | protein_coding | deleterious(0.05) | possibly_damaging(0.482) | TCGA-AP-A0LM-01 | Endometrium | uterine corpus endometrioid carcinoma | Female | <65 | III/IV | Chemotherapy | cisplatin | SD | ||
| C15orf41 | SNV | Missense_Mutation | novel | c.169G>A | p.Ala57Thr | p.A57T | protein_coding | tolerated(0.34) | benign(0.007) | TCGA-AX-A1CE-01 | Endometrium | uterine corpus endometrioid carcinoma | Female | <65 | I/II | Unspecific | Paclitaxel | SD |
| Page: 1 2 3 |
Top |
Related drugs of malignant transformation related genes |
| Identification of chemicals and drugs interact with genes involved in malignant transfromation |
| (DGIdb 4.0) |
| Entrez ID | Symbol | Category | Interaction Types | Drug Claim Name | Drug Name | PMIDs |
| Page: 1 |

Copyright 2023-Present -The University of Texas Health Science Center at Houston |