
|
|||||
|
 | |
| |
| |
| |
| |
| |
|
Gene: C14orf93 |
Gene summary for C14ORF93 |
| Gene information | Species | Human | Gene symbol | C14orf93 | Gene ID | 60686 |
| Gene name | chromosome 14 open reading frame 93 | |
| Gene Alias | RTFC | |
| Cytomap | 14q11.2 | |
| Gene Type | protein-coding | GO ID | GO:0008150 | UniProtAcc | Q9H972 |
Top |
Malignant transformation analysis |
| Identification of the aberrant gene expression in precancerous and cancerous lesions by comparing the gene expression of stem-like cells in diseased tissues with normal stem cells |
| Entrez ID | Symbol | Replicates | Species | Organ | Tissue | Adj P-value | Log2FC | Malignancy |
| 60686 | C14orf93 | LZE4T | Human | Esophagus | ESCC | 4.72e-02 | 9.66e-02 | 0.0811 |
| 60686 | C14orf93 | LZE24T | Human | Esophagus | ESCC | 8.98e-07 | 2.02e-01 | 0.0596 |
| 60686 | C14orf93 | P2T-E | Human | Esophagus | ESCC | 2.66e-13 | 1.38e-01 | 0.1177 |
| 60686 | C14orf93 | P4T-E | Human | Esophagus | ESCC | 1.43e-03 | 1.32e-01 | 0.1323 |
| 60686 | C14orf93 | P5T-E | Human | Esophagus | ESCC | 3.74e-11 | 7.61e-02 | 0.1327 |
| 60686 | C14orf93 | P8T-E | Human | Esophagus | ESCC | 7.20e-13 | 1.33e-01 | 0.0889 |
| 60686 | C14orf93 | P9T-E | Human | Esophagus | ESCC | 2.57e-07 | 1.58e-01 | 0.1131 |
| 60686 | C14orf93 | P10T-E | Human | Esophagus | ESCC | 1.99e-19 | 2.31e-01 | 0.116 |
| 60686 | C14orf93 | P12T-E | Human | Esophagus | ESCC | 5.27e-25 | 4.03e-01 | 0.1122 |
| 60686 | C14orf93 | P15T-E | Human | Esophagus | ESCC | 1.33e-15 | 3.37e-01 | 0.1149 |
| 60686 | C14orf93 | P16T-E | Human | Esophagus | ESCC | 5.91e-14 | 1.25e-01 | 0.1153 |
| 60686 | C14orf93 | P20T-E | Human | Esophagus | ESCC | 3.99e-02 | 8.37e-02 | 0.1124 |
| 60686 | C14orf93 | P21T-E | Human | Esophagus | ESCC | 1.09e-10 | 1.07e-01 | 0.1617 |
| 60686 | C14orf93 | P22T-E | Human | Esophagus | ESCC | 3.09e-05 | 9.10e-02 | 0.1236 |
| 60686 | C14orf93 | P23T-E | Human | Esophagus | ESCC | 6.18e-08 | 2.25e-01 | 0.108 |
| 60686 | C14orf93 | P24T-E | Human | Esophagus | ESCC | 2.69e-10 | 8.17e-02 | 0.1287 |
| 60686 | C14orf93 | P26T-E | Human | Esophagus | ESCC | 8.54e-19 | 3.34e-01 | 0.1276 |
| 60686 | C14orf93 | P27T-E | Human | Esophagus | ESCC | 1.30e-18 | 2.44e-01 | 0.1055 |
| 60686 | C14orf93 | P28T-E | Human | Esophagus | ESCC | 1.83e-12 | 1.39e-01 | 0.1149 |
| 60686 | C14orf93 | P30T-E | Human | Esophagus | ESCC | 2.45e-06 | 2.57e-01 | 0.137 |
| Page: 1 2 3 |
| Tissue | Expression Dynamics | Abbreviation |
| Esophagus | 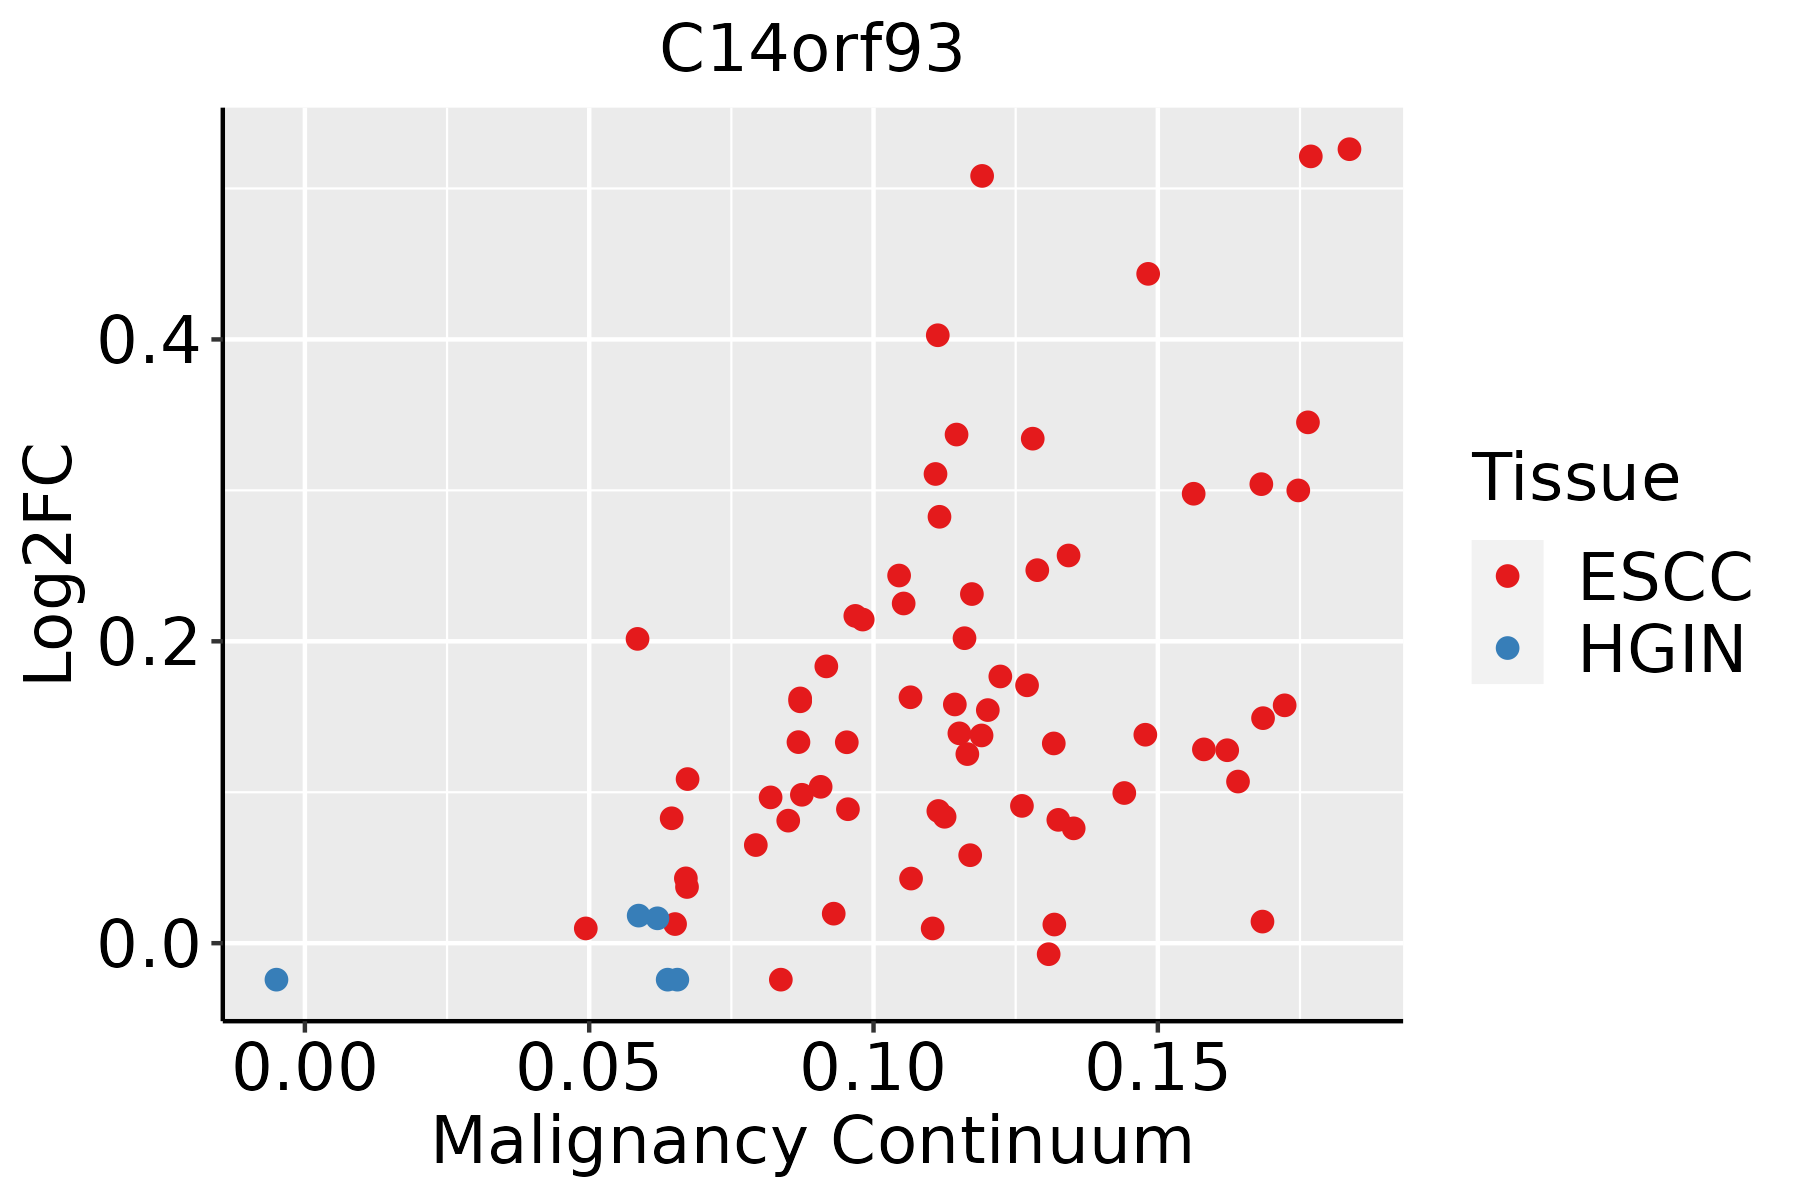 | ESCC: Esophageal squamous cell carcinoma |
| HGIN: High-grade intraepithelial neoplasias | ||
| LGIN: Low-grade intraepithelial neoplasias |
| ∗log2FC in expression of this searched gene in stem-like cells from each diseased tissue sample relative to stem-like cells in normal samples in each tissue plotted against the malignancy continuum. Samples are colored based on if they are from different disease stage. |
Top |
Malignant transformation related pathway analysis |
| Find out the enriched GO biological processes and KEGG pathways involved in transition from healthy to precancer to cancer |
| Tissue | Disease Stage | Enriched GO biological Processes |
| Colorectum | AD |  |
| Colorectum | SER |  |
| Colorectum | MSS |  |
| Colorectum | MSI-H |  |
| Colorectum | FAP |  |
| ∗Top 15 enriched GO BP terms are showed in the bar plot of each disease state in each tissue. Each row represents a significant GO biological process which is colored according to the -log10(p.adjust). |
| Page: 1 2 3 4 5 6 7 8 9 |
| GO ID | Tissue | Disease Stage | Description | Gene Ratio | Bg Ratio | pvalue | p.adjust | Count |
| Page: 1 |
| Pathway ID | Tissue | Disease Stage | Description | Gene Ratio | Bg Ratio | pvalue | p.adjust | qvalue | Count |
| Page: 1 |
Top |
Cell-cell communication analysis |
| Identification of potential cell-cell interactions between two cell types and their ligand-receptor pairs for different disease states |
| Ligand | Receptor | LRpair | Pathway | Tissue | Disease Stage |
| Page: 1 |
Top |
Single-cell gene regulatory network inference analysis |
| Find out the significant the regulons (TFs) and the target genes of each regulon across cell types for different disease states |
| TF | Cell Type | Tissue | Disease Stage | Target Gene | RSS | Regulon Activity |
| ∗The dot plots of a searched regulon are shown for all cell subpopulations in each disease state of each tissue based on the regulon specific score inferred using pySCENIC and by calculating the average expression. |
| Page: 1 |
Top |
Somatic mutation of malignant transformation related genes |
| Annotation of somatic variants for genes involved in malignant transformation |
| Hugo Symbol | Variant Class | Variant Classification | dbSNP RS | HGVSc | HGVSp | HGVSp Short | SWISSPROT | BIOTYPE | SIFT | PolyPhen | Tumor Sample Barcode | Tissue | Histology | Sex | Age | Stage | Therapy Types | Drugs | Outcome |
| C14orf93 | SNV | Missense_Mutation | c.984N>G | p.Ile328Met | p.I328M | Q9H972 | protein_coding | deleterious_low_confidence(0.05) | probably_damaging(0.994) | TCGA-A2-A0EQ-01 | Breast | breast invasive carcinoma | Female | <65 | I/II | Chemotherapy | adriamycin | SD | |
| C14orf93 | SNV | Missense_Mutation | novel | c.407N>G | p.Lys136Arg | p.K136R | Q9H972 | protein_coding | tolerated_low_confidence(0.29) | benign(0) | TCGA-AC-A23H-01 | Breast | breast invasive carcinoma | Female | >=65 | I/II | Unknown | Unknown | PD |
| C14orf93 | SNV | Missense_Mutation | rs766721014 | c.1531N>A | p.Gly511Ser | p.G511S | Q9H972 | protein_coding | tolerated_low_confidence(0.55) | benign(0.01) | TCGA-AC-A5XS-01 | Breast | breast invasive carcinoma | Female | >=65 | I/II | Hormone Therapy | femara | SD |
| C14orf93 | SNV | Missense_Mutation | rs17851131 | c.1181N>A | p.Arg394Gln | p.R394Q | Q9H972 | protein_coding | deleterious_low_confidence(0.01) | probably_damaging(0.979) | TCGA-AN-A046-01 | Breast | breast invasive carcinoma | Female | >=65 | I/II | Unknown | Unknown | SD |
| C14orf93 | SNV | Missense_Mutation | c.853T>C | p.Ser285Pro | p.S285P | Q9H972 | protein_coding | tolerated_low_confidence(0.08) | possibly_damaging(0.775) | TCGA-AR-A24S-01 | Breast | breast invasive carcinoma | Female | <65 | I/II | Hormone Therapy | anastrozole | SD | |
| C14orf93 | SNV | Missense_Mutation | c.1170G>C | p.Glu390Asp | p.E390D | Q9H972 | protein_coding | tolerated_low_confidence(0.08) | benign(0.003) | TCGA-D8-A27G-01 | Breast | breast invasive carcinoma | Female | >=65 | I/II | Unknown | Unknown | SD | |
| C14orf93 | SNV | Missense_Mutation | novel | c.1468N>A | p.Pro490Thr | p.P490T | Q9H972 | protein_coding | deleterious_low_confidence(0.02) | possibly_damaging(0.586) | TCGA-S3-AA12-01 | Breast | breast invasive carcinoma | Female | >=65 | III/IV | Hormone Therapy | anastrozole | SD |
| C14orf93 | insertion | Frame_Shift_Ins | novel | c.1350_1351insTACCTTTTGCTTCCCTGTGACTACTTGTCTTGCTCTGCAGTGGAAAC | p.Arg451TyrfsTer92 | p.R451Yfs*92 | Q9H972 | protein_coding | TCGA-BH-A0H7-01 | Breast | breast invasive carcinoma | Female | >=65 | III/IV | Chemotherapy | doxorubicin | SD | ||
| C14orf93 | deletion | Frame_Shift_Del | c.637delN | p.Arg213GlufsTer64 | p.R213Efs*64 | Q9H972 | protein_coding | TCGA-EW-A2FV-01 | Breast | breast invasive carcinoma | Female | <65 | III/IV | Chemotherapy | docetaxel | SD | |||
| C14orf93 | SNV | Missense_Mutation | rs775155549 | c.275N>A | p.Arg92His | p.R92H | Q9H972 | protein_coding | deleterious_low_confidence(0.01) | benign(0.001) | TCGA-DG-A2KK-01 | Cervix | cervical & endocervical cancer | Female | <65 | III/IV | Chemotherapy | cisplatin | SD |
| Page: 1 2 3 4 5 |
Top |
Related drugs of malignant transformation related genes |
| Identification of chemicals and drugs interact with genes involved in malignant transfromation |
| (DGIdb 4.0) |
| Entrez ID | Symbol | Category | Interaction Types | Drug Claim Name | Drug Name | PMIDs |
| Page: 1 |

Copyright 2023-Present -The University of Texas Health Science Center at Houston |