
|
|||||
|
 | |
| |
| |
| |
| |
| |
|
Gene: C12orf76 |
Gene summary for C12ORF76 |
| Gene information | Species | Human | Gene symbol | C12orf76 | Gene ID | 400073 |
| Gene name | chromosome 12 open reading frame 76 | |
| Gene Alias | C12orf76 | |
| Cytomap | 12q24.11 | |
| Gene Type | protein-coding | GO ID | NA | UniProtAcc | NA |
Top |
Malignant transformation analysis |
| Identification of the aberrant gene expression in precancerous and cancerous lesions by comparing the gene expression of stem-like cells in diseased tissues with normal stem cells |
| Entrez ID | Symbol | Replicates | Species | Organ | Tissue | Adj P-value | Log2FC | Malignancy |
| 400073 | C12orf76 | LZE4T | Human | Esophagus | ESCC | 4.53e-04 | 1.19e-01 | 0.0811 |
| 400073 | C12orf76 | LZE7T | Human | Esophagus | ESCC | 1.02e-03 | 1.90e-01 | 0.0667 |
| 400073 | C12orf76 | LZE8T | Human | Esophagus | ESCC | 1.10e-02 | 1.44e-01 | 0.067 |
| 400073 | C12orf76 | LZE22D1 | Human | Esophagus | HGIN | 8.03e-04 | 1.59e-01 | 0.0595 |
| 400073 | C12orf76 | LZE22T | Human | Esophagus | ESCC | 1.48e-05 | 3.40e-01 | 0.068 |
| 400073 | C12orf76 | LZE24T | Human | Esophagus | ESCC | 7.06e-21 | 4.27e-01 | 0.0596 |
| 400073 | C12orf76 | LZE6T | Human | Esophagus | ESCC | 2.96e-03 | 1.33e-01 | 0.0845 |
| 400073 | C12orf76 | P1T-E | Human | Esophagus | ESCC | 2.65e-12 | 4.40e-01 | 0.0875 |
| 400073 | C12orf76 | P2T-E | Human | Esophagus | ESCC | 1.19e-33 | 5.40e-01 | 0.1177 |
| 400073 | C12orf76 | P4T-E | Human | Esophagus | ESCC | 8.80e-28 | 5.32e-01 | 0.1323 |
| 400073 | C12orf76 | P5T-E | Human | Esophagus | ESCC | 7.40e-05 | 1.07e-01 | 0.1327 |
| 400073 | C12orf76 | P8T-E | Human | Esophagus | ESCC | 1.34e-30 | 5.27e-01 | 0.0889 |
| 400073 | C12orf76 | P9T-E | Human | Esophagus | ESCC | 1.08e-07 | 1.59e-01 | 0.1131 |
| 400073 | C12orf76 | P10T-E | Human | Esophagus | ESCC | 1.98e-25 | 4.76e-01 | 0.116 |
| 400073 | C12orf76 | P11T-E | Human | Esophagus | ESCC | 1.23e-16 | 5.50e-01 | 0.1426 |
| 400073 | C12orf76 | P12T-E | Human | Esophagus | ESCC | 6.96e-19 | 2.85e-01 | 0.1122 |
| 400073 | C12orf76 | P15T-E | Human | Esophagus | ESCC | 3.15e-16 | 2.98e-01 | 0.1149 |
| 400073 | C12orf76 | P16T-E | Human | Esophagus | ESCC | 2.64e-24 | 4.42e-01 | 0.1153 |
| 400073 | C12orf76 | P17T-E | Human | Esophagus | ESCC | 4.48e-07 | 2.61e-01 | 0.1278 |
| 400073 | C12orf76 | P19T-E | Human | Esophagus | ESCC | 2.24e-09 | 4.95e-01 | 0.1662 |
| Page: 1 2 3 4 5 |
| Tissue | Expression Dynamics | Abbreviation |
| Esophagus | 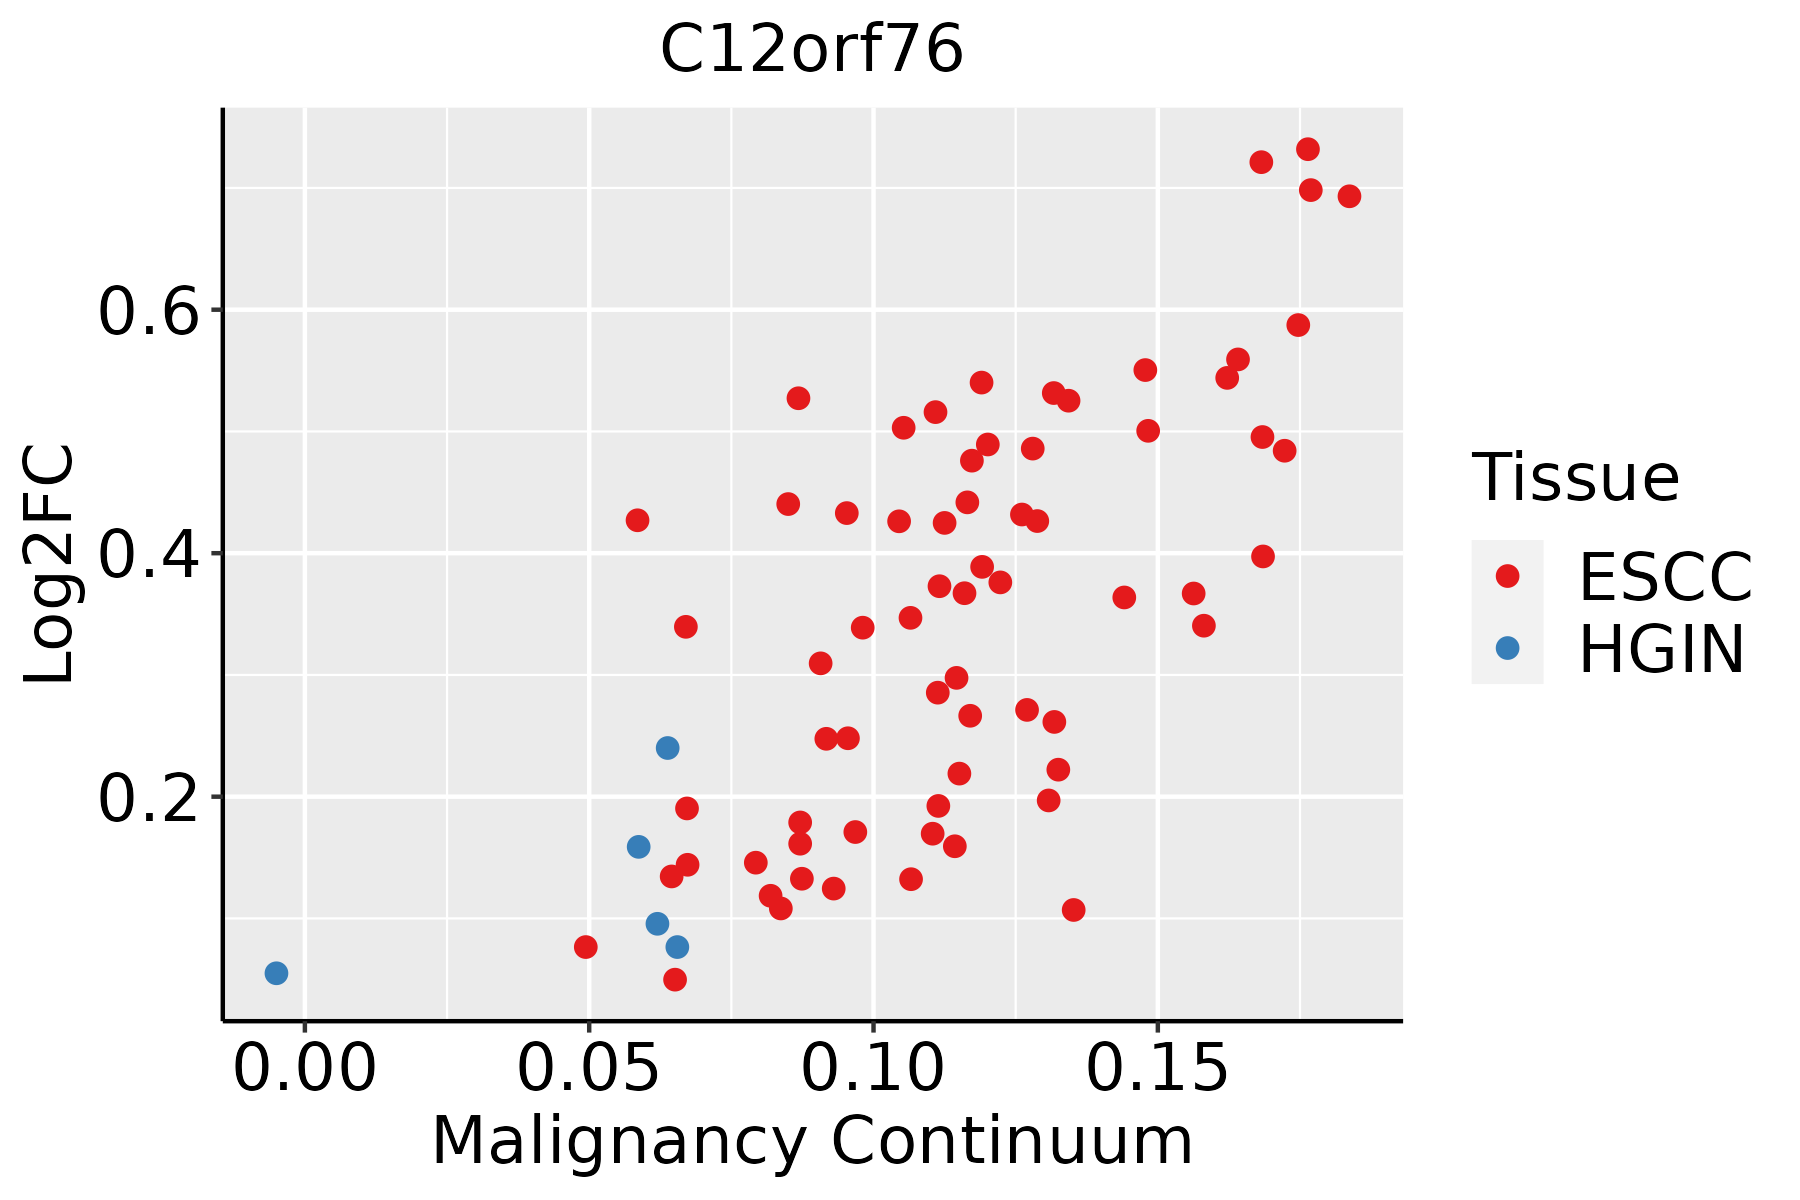 | ESCC: Esophageal squamous cell carcinoma |
| HGIN: High-grade intraepithelial neoplasias | ||
| LGIN: Low-grade intraepithelial neoplasias | ||
| Liver |  | HCC: Hepatocellular carcinoma |
| NAFLD: Non-alcoholic fatty liver disease | ||
| Thyroid | 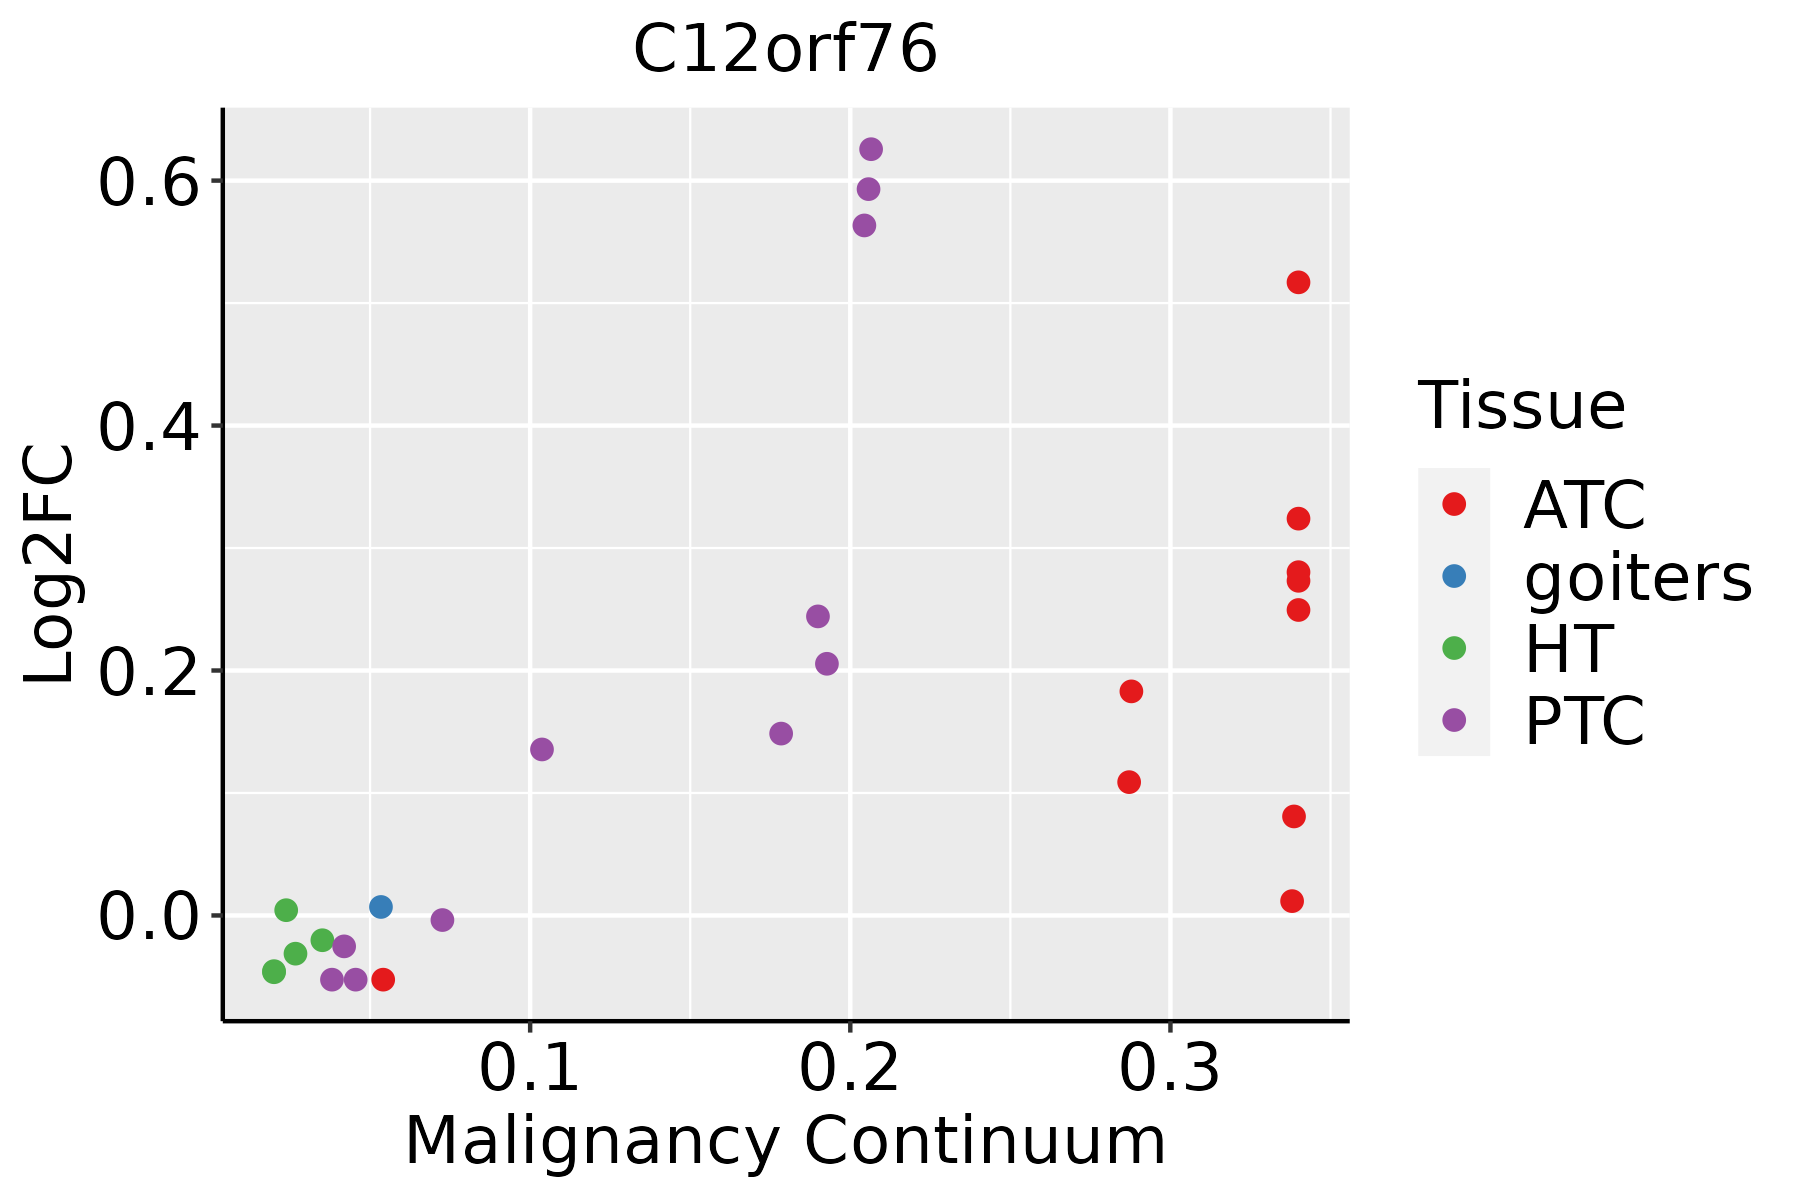 | ATC: Anaplastic thyroid cancer |
| HT: Hashimoto's thyroiditis | ||
| PTC: Papillary thyroid cancer |
| ∗log2FC in expression of this searched gene in stem-like cells from each diseased tissue sample relative to stem-like cells in normal samples in each tissue plotted against the malignancy continuum. Samples are colored based on if they are from different disease stage. |
Top |
Malignant transformation related pathway analysis |
| Find out the enriched GO biological processes and KEGG pathways involved in transition from healthy to precancer to cancer |
| Tissue | Disease Stage | Enriched GO biological Processes |
| Colorectum | AD |  |
| Colorectum | SER |  |
| Colorectum | MSS |  |
| Colorectum | MSI-H |  |
| Colorectum | FAP |  |
| ∗Top 15 enriched GO BP terms are showed in the bar plot of each disease state in each tissue. Each row represents a significant GO biological process which is colored according to the -log10(p.adjust). |
| Page: 1 2 3 4 5 6 7 8 9 |
| GO ID | Tissue | Disease Stage | Description | Gene Ratio | Bg Ratio | pvalue | p.adjust | Count |
| Page: 1 |
| Pathway ID | Tissue | Disease Stage | Description | Gene Ratio | Bg Ratio | pvalue | p.adjust | qvalue | Count |
| Page: 1 |
Top |
Cell-cell communication analysis |
| Identification of potential cell-cell interactions between two cell types and their ligand-receptor pairs for different disease states |
| Ligand | Receptor | LRpair | Pathway | Tissue | Disease Stage |
| Page: 1 |
Top |
Single-cell gene regulatory network inference analysis |
| Find out the significant the regulons (TFs) and the target genes of each regulon across cell types for different disease states |
| TF | Cell Type | Tissue | Disease Stage | Target Gene | RSS | Regulon Activity |
| ∗The dot plots of a searched regulon are shown for all cell subpopulations in each disease state of each tissue based on the regulon specific score inferred using pySCENIC and by calculating the average expression. |
| Page: 1 |
Top |
Somatic mutation of malignant transformation related genes |
| Annotation of somatic variants for genes involved in malignant transformation |
| Hugo Symbol | Variant Class | Variant Classification | dbSNP RS | HGVSc | HGVSp | HGVSp Short | SWISSPROT | BIOTYPE | SIFT | PolyPhen | Tumor Sample Barcode | Tissue | Histology | Sex | Age | Stage | Therapy Types | Drugs | Outcome |
| C12orf76 | SNV | Missense_Mutation | rs374197115 | c.176C>T | p.Ser59Leu | p.S59L | Q8N812 | protein_coding | deleterious_low_confidence(0) | benign(0.019) | TCGA-D5-5538-01 | Colorectum | colon adenocarcinoma | Female | <65 | III/IV | Chemotherapy | calcium | PD |
| C12orf76 | SNV | Missense_Mutation | novel | c.224N>T | p.Arg75Met | p.R75M | Q8N812 | protein_coding | deleterious_low_confidence(0) | possibly_damaging(0.452) | TCGA-AG-A002-01 | Colorectum | rectum adenocarcinoma | Male | <65 | I/II | Unknown | Unknown | SD |
| C12orf76 | SNV | Missense_Mutation | rs764372891 | c.377C>T | p.Ala126Val | p.A126V | Q8N812 | protein_coding | deleterious_low_confidence(0) | probably_damaging(0.977) | TCGA-A5-A0VP-01 | Endometrium | uterine corpus endometrioid carcinoma | Female | >=65 | I/II | Unknown | Unknown | SD |
| C12orf76 | SNV | Missense_Mutation | novel | c.173N>A | p.Cys58Tyr | p.C58Y | Q8N812 | protein_coding | deleterious_low_confidence(0) | benign(0) | TCGA-AJ-A3EK-01 | Endometrium | uterine corpus endometrioid carcinoma | Female | <65 | I/II | Chemotherapy | carboplatin | CR |
| C12orf76 | SNV | Missense_Mutation | c.392N>T | p.Arg131Ile | p.R131I | Q8N812 | protein_coding | deleterious_low_confidence(0.01) | benign(0.095) | TCGA-AP-A059-01 | Endometrium | uterine corpus endometrioid carcinoma | Female | >=65 | I/II | Unknown | Unknown | SD | |
| C12orf76 | SNV | Missense_Mutation | rs374648805 | c.116G>A | p.Arg39His | p.R39H | Q8N812 | protein_coding | deleterious_low_confidence(0) | benign(0) | TCGA-EO-A22R-01 | Endometrium | uterine corpus endometrioid carcinoma | Female | <65 | I/II | Unknown | Unknown | SD |
| C12orf76 | SNV | Missense_Mutation | novel | c.400N>A | p.Leu134Ile | p.L134I | Q8N812 | protein_coding | possibly_damaging(0.494) | TCGA-EO-A22X-01 | Endometrium | uterine corpus endometrioid carcinoma | Female | <65 | III/IV | Unspecific | Carboplatin | Complete Response | |
| C12orf76 | SNV | Missense_Mutation | rs751712422 | c.103G>A | p.Val35Ile | p.V35I | Q8N812 | protein_coding | tolerated_low_confidence(1) | benign(0) | TCGA-FI-A2D0-01 | Endometrium | uterine corpus endometrioid carcinoma | Female | <65 | I/II | Unknown | Unknown | SD |
| C12orf76 | SNV | Missense_Mutation | novel | c.158N>A | p.Ile53Asn | p.I53N | Q8N812 | protein_coding | deleterious_low_confidence(0) | benign(0.227) | TCGA-ZP-A9CY-01 | Liver | liver hepatocellular carcinoma | Female | >=65 | I/II | Unknown | Unknown | SD |
| C12orf76 | SNV | Missense_Mutation | novel | c.205N>A | p.Glu69Lys | p.E69K | Q8N812 | protein_coding | deleterious_low_confidence(0) | benign(0) | TCGA-D6-6516-01 | Oral cavity | head & neck squamous cell carcinoma | Male | >=65 | I/II | Unknown | Unknown | SD |
| Page: 1 |
Top |
Related drugs of malignant transformation related genes |
| Identification of chemicals and drugs interact with genes involved in malignant transfromation |
| (DGIdb 4.0) |
| Entrez ID | Symbol | Category | Interaction Types | Drug Claim Name | Drug Name | PMIDs |
| Page: 1 |

Copyright 2023-Present -The University of Texas Health Science Center at Houston |