
|
|||||
|
 | |
| |
| |
| |
| |
| |
|
Gene: C12orf75 |
Gene summary for C12ORF75 |
| Gene information | Species | Human | Gene symbol | C12orf75 | Gene ID | 387882 |
| Gene name | chromosome 12 open reading frame 75 | |
| Gene Alias | AGD3 | |
| Cytomap | 12q23.3 | |
| Gene Type | protein-coding | GO ID | NA | UniProtAcc | Q8TAD7 |
Top |
Malignant transformation analysis |
| Identification of the aberrant gene expression in precancerous and cancerous lesions by comparing the gene expression of stem-like cells in diseased tissues with normal stem cells |
| Entrez ID | Symbol | Replicates | Species | Organ | Tissue | Adj P-value | Log2FC | Malignancy |
| 387882 | C12orf75 | CA_HPV_1 | Human | Cervix | CC | 2.41e-09 | 3.95e-01 | 0.0264 |
| 387882 | C12orf75 | HSIL_HPV_2 | Human | Cervix | HSIL_HPV | 7.40e-14 | 5.30e-01 | 0.0208 |
| 387882 | C12orf75 | CCI_2 | Human | Cervix | CC | 1.72e-11 | 1.69e+00 | 0.5249 |
| 387882 | C12orf75 | Tumor | Human | Cervix | CC | 3.74e-07 | 2.35e-01 | 0.1241 |
| 387882 | C12orf75 | sample3 | Human | Cervix | CC | 1.21e-03 | 2.28e-01 | 0.1387 |
| 387882 | C12orf75 | H2 | Human | Cervix | HSIL_HPV | 8.58e-03 | 2.26e-01 | 0.0632 |
| 387882 | C12orf75 | T3 | Human | Cervix | CC | 3.94e-05 | 2.39e-01 | 0.1389 |
| 387882 | C12orf75 | HTA11_2487_2000001011 | Human | Colorectum | SER | 5.25e-03 | 4.68e-01 | -0.1808 |
| 387882 | C12orf75 | HTA11_1938_2000001011 | Human | Colorectum | AD | 1.14e-03 | 4.16e-01 | -0.0811 |
| 387882 | C12orf75 | HTA11_78_2000001011 | Human | Colorectum | AD | 4.84e-04 | 4.00e-01 | -0.1088 |
| 387882 | C12orf75 | HTA11_347_2000001011 | Human | Colorectum | AD | 2.96e-06 | 4.05e-01 | -0.1954 |
| 387882 | C12orf75 | HTA11_411_2000001011 | Human | Colorectum | SER | 6.48e-03 | 8.72e-01 | -0.2602 |
| 387882 | C12orf75 | HTA11_2992_2000001011 | Human | Colorectum | SER | 2.48e-02 | 4.31e-01 | -0.1706 |
| 387882 | C12orf75 | HTA11_5212_2000001011 | Human | Colorectum | AD | 1.25e-04 | 7.61e-01 | -0.2061 |
| 387882 | C12orf75 | HTA11_6818_2000001021 | Human | Colorectum | AD | 1.29e-08 | 6.10e-01 | 0.0588 |
| 387882 | C12orf75 | HTA11_99999970781_79442 | Human | Colorectum | MSS | 3.07e-12 | 5.81e-01 | 0.294 |
| 387882 | C12orf75 | HTA11_99999965104_69814 | Human | Colorectum | MSS | 1.70e-06 | 4.82e-01 | 0.281 |
| 387882 | C12orf75 | HTA11_99999971662_82457 | Human | Colorectum | MSS | 1.67e-04 | 4.29e-01 | 0.3859 |
| 387882 | C12orf75 | A015-C-203 | Human | Colorectum | FAP | 2.11e-02 | -1.10e-01 | -0.1294 |
| 387882 | C12orf75 | A002-C-114 | Human | Colorectum | FAP | 2.12e-03 | -1.73e-01 | -0.1561 |
| Page: 1 2 3 4 5 6 7 8 9 10 |
| Tissue | Expression Dynamics | Abbreviation |
| Cervix | 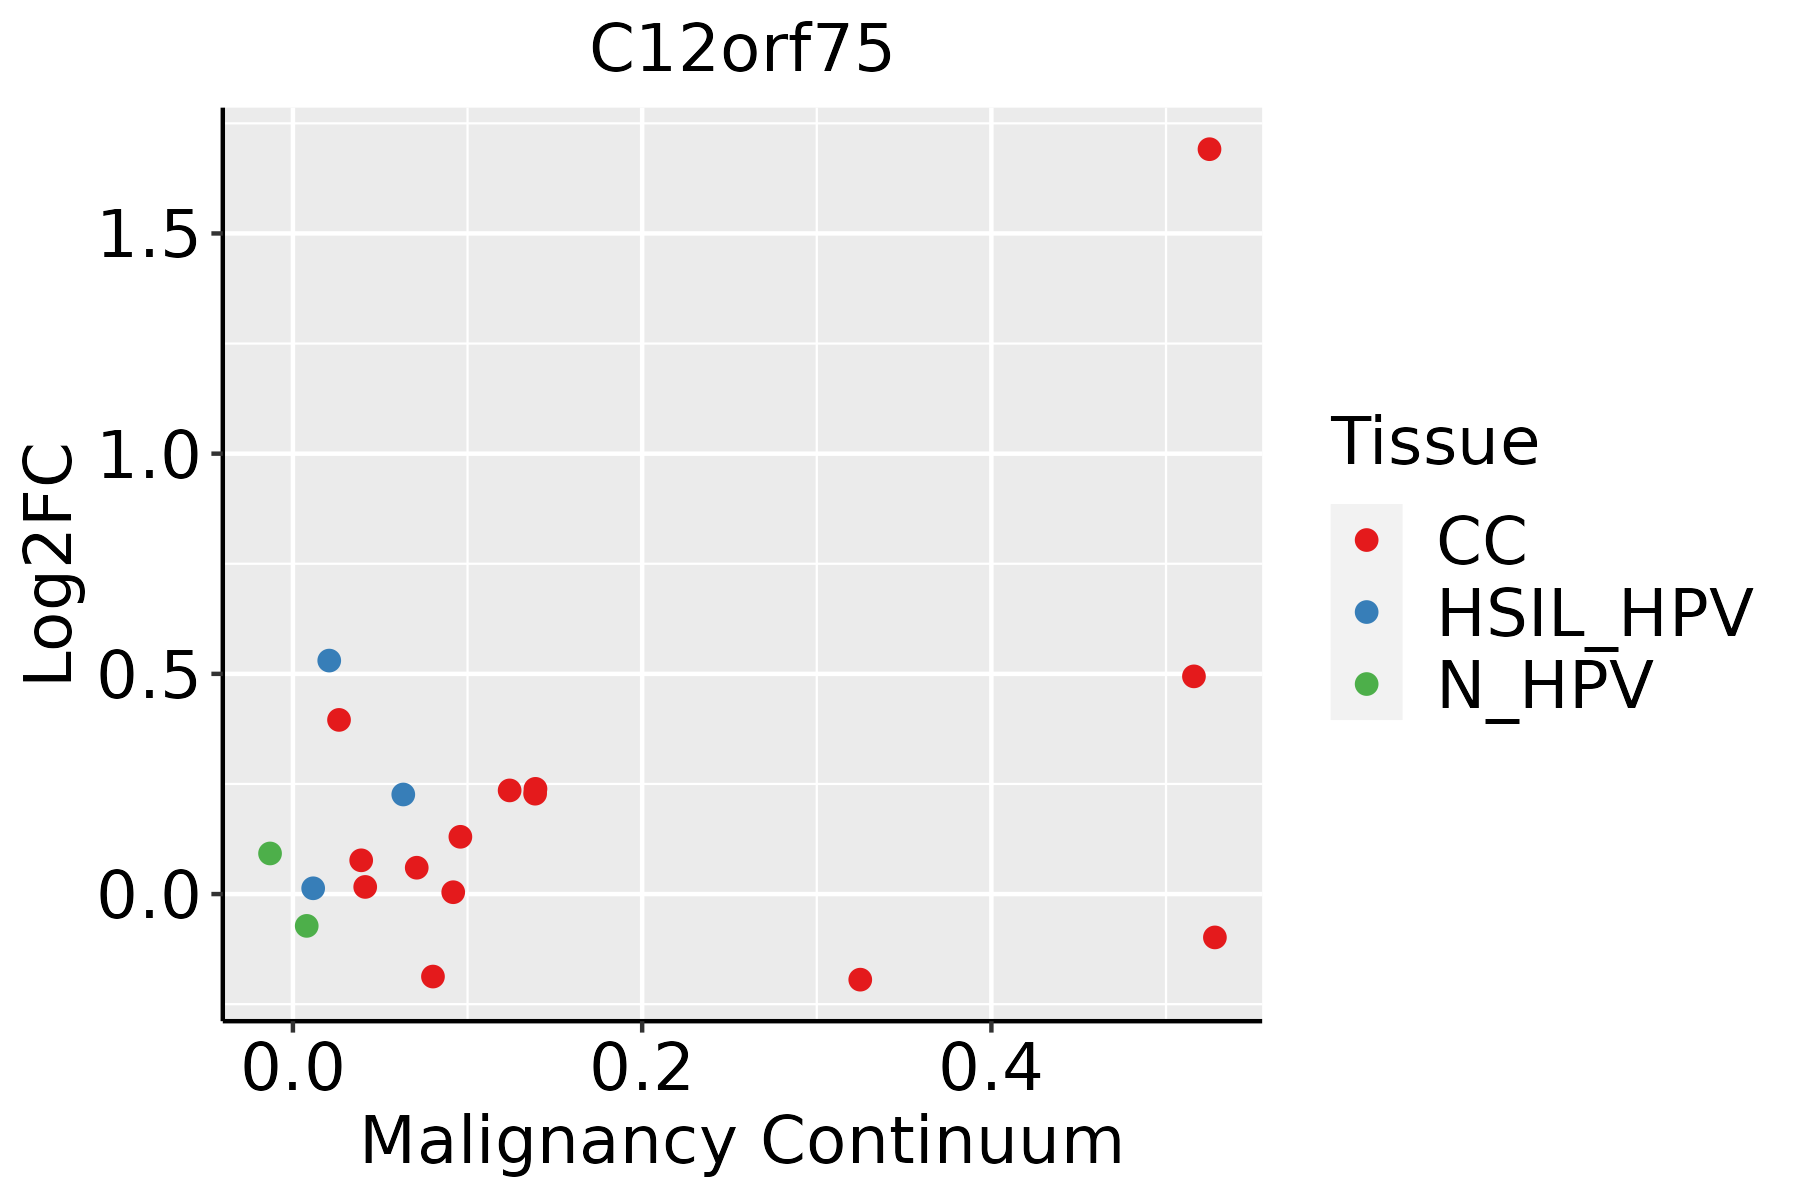 | CC: Cervix cancer |
| HSIL_HPV: HPV-infected high-grade squamous intraepithelial lesions | ||
| N_HPV: HPV-infected normal cervix | ||
| Colorectum (GSE201348) | 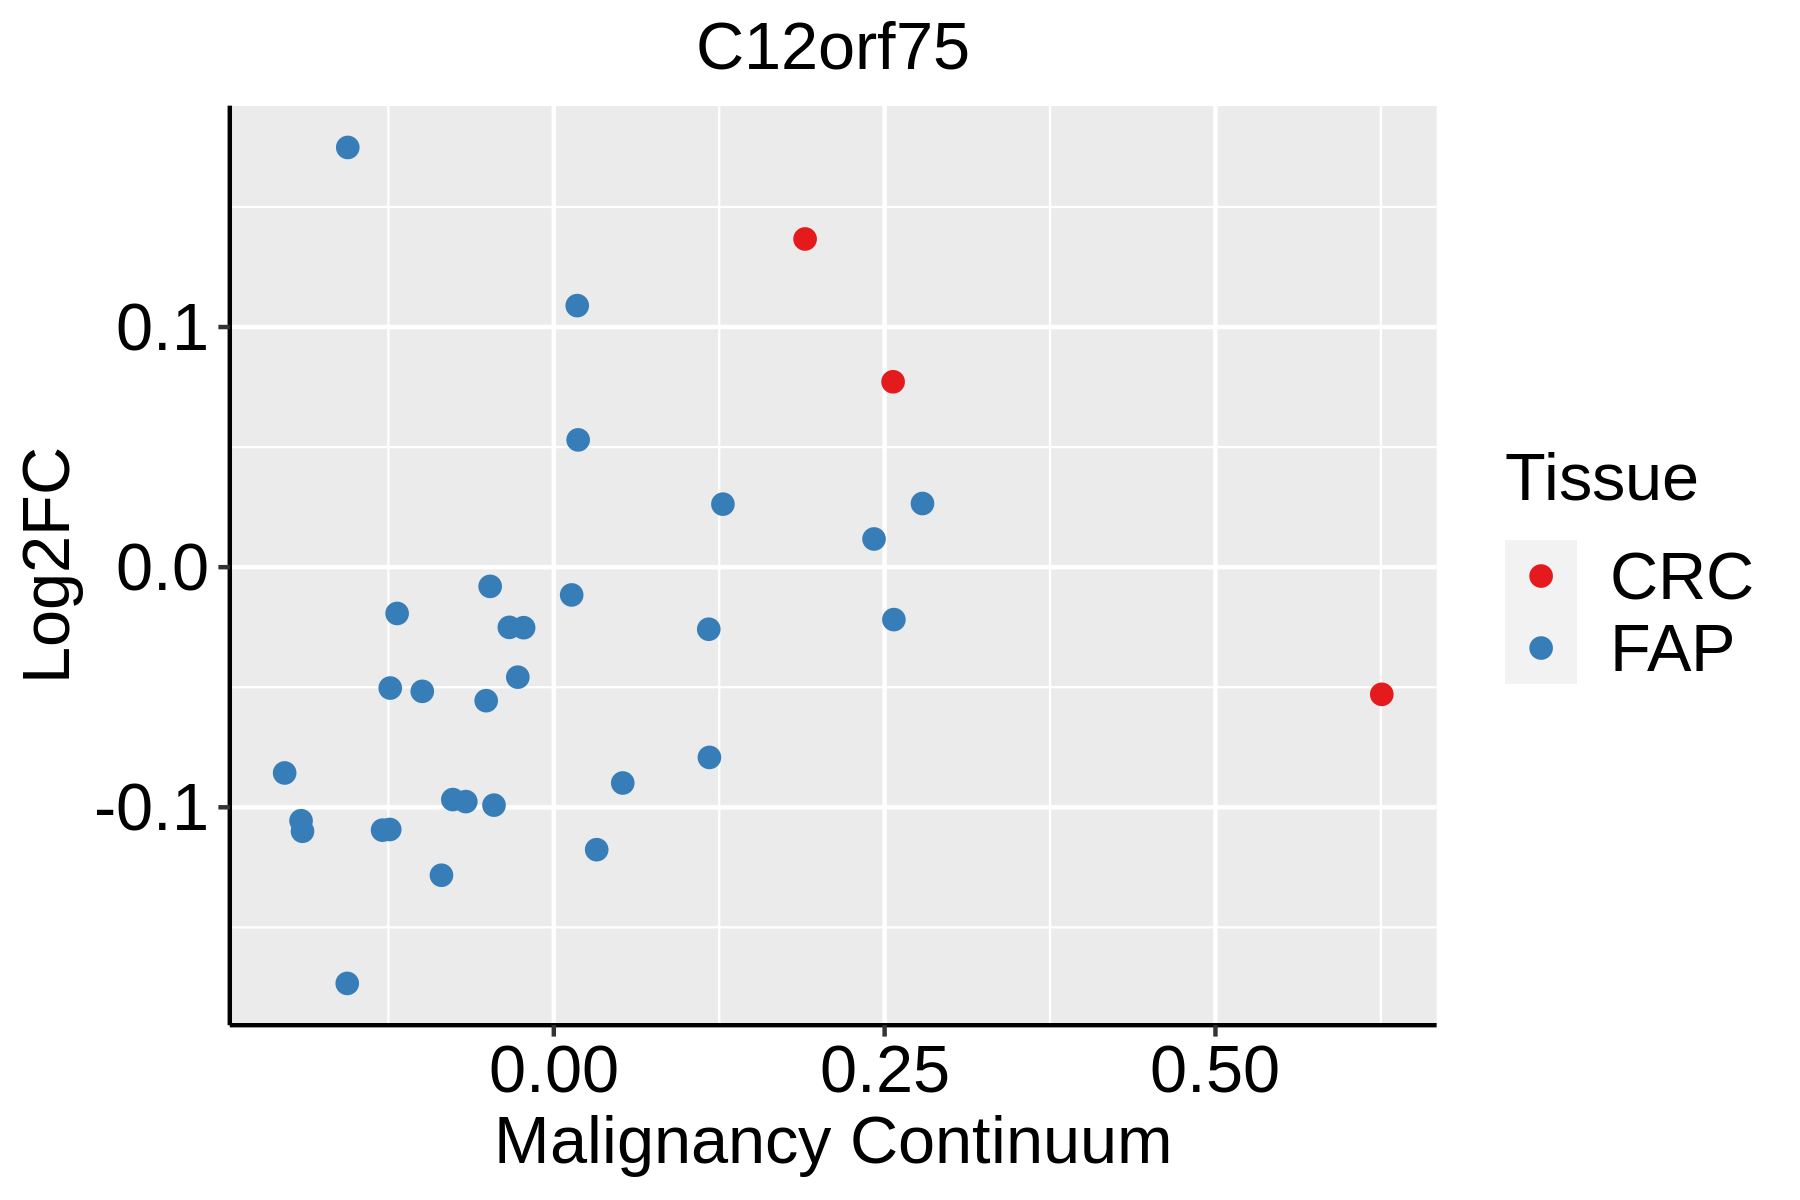 | FAP: Familial adenomatous polyposis |
| CRC: Colorectal cancer | ||
| Colorectum (HTA11) |  | AD: Adenomas |
| SER: Sessile serrated lesions | ||
| MSI-H: Microsatellite-high colorectal cancer | ||
| MSS: Microsatellite stable colorectal cancer | ||
| Endometrium |  | AEH: Atypical endometrial hyperplasia |
| EEC: Endometrioid Cancer | ||
| Esophagus |  | ESCC: Esophageal squamous cell carcinoma |
| HGIN: High-grade intraepithelial neoplasias | ||
| LGIN: Low-grade intraepithelial neoplasias | ||
| GC | 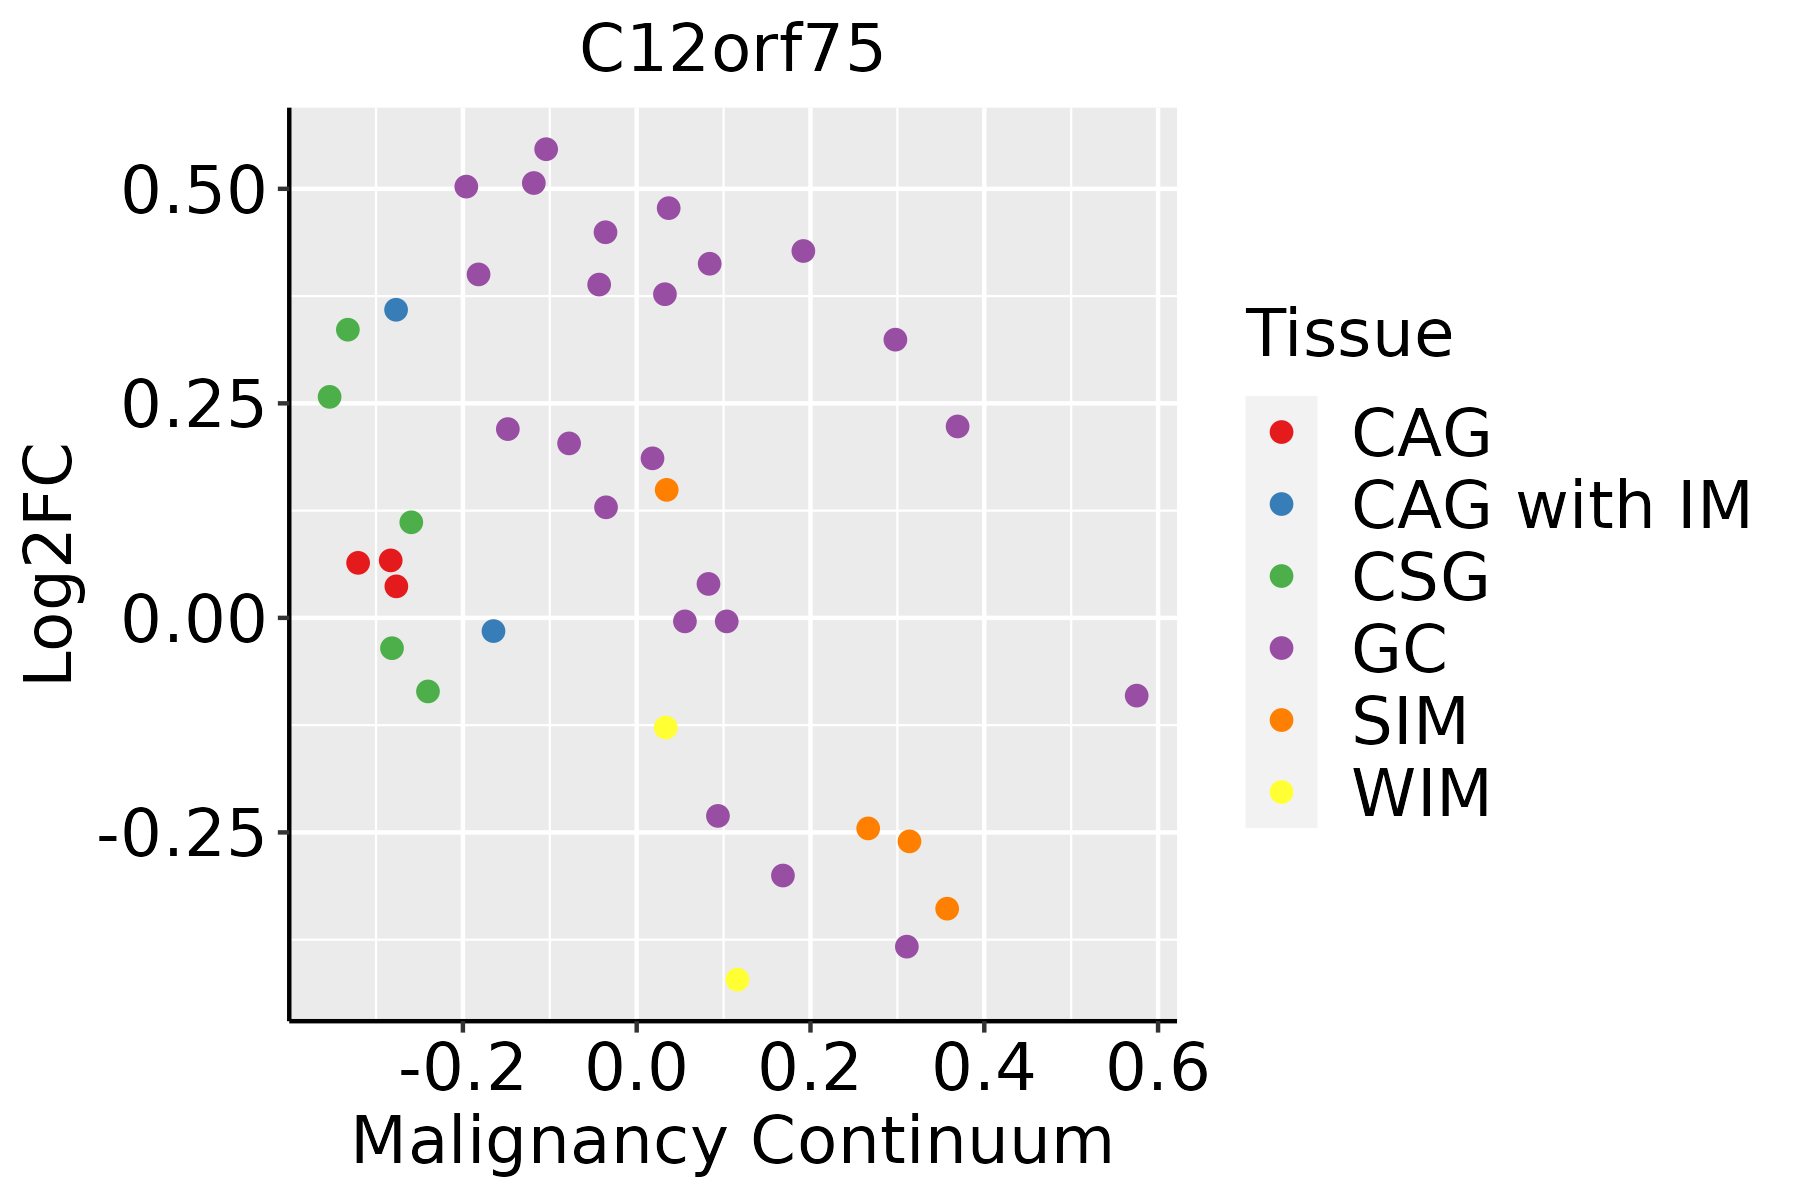 | CAG: Chronic atrophic gastritis |
| CAG with IM: Chronic atrophic gastritis with intestinal metaplasia | ||
| CSG: Chronic superficial gastritis | ||
| GC: Gastric cancer | ||
| SIM: Severe intestinal metaplasia | ||
| WIM: Wild intestinal metaplasia | ||
| Liver |  | HCC: Hepatocellular carcinoma |
| NAFLD: Non-alcoholic fatty liver disease | ||
| Oral Cavity |  | EOLP: Erosive Oral lichen planus |
| LP: leukoplakia | ||
| NEOLP: Non-erosive oral lichen planus | ||
| OSCC: Oral squamous cell carcinoma | ||
| Skin | 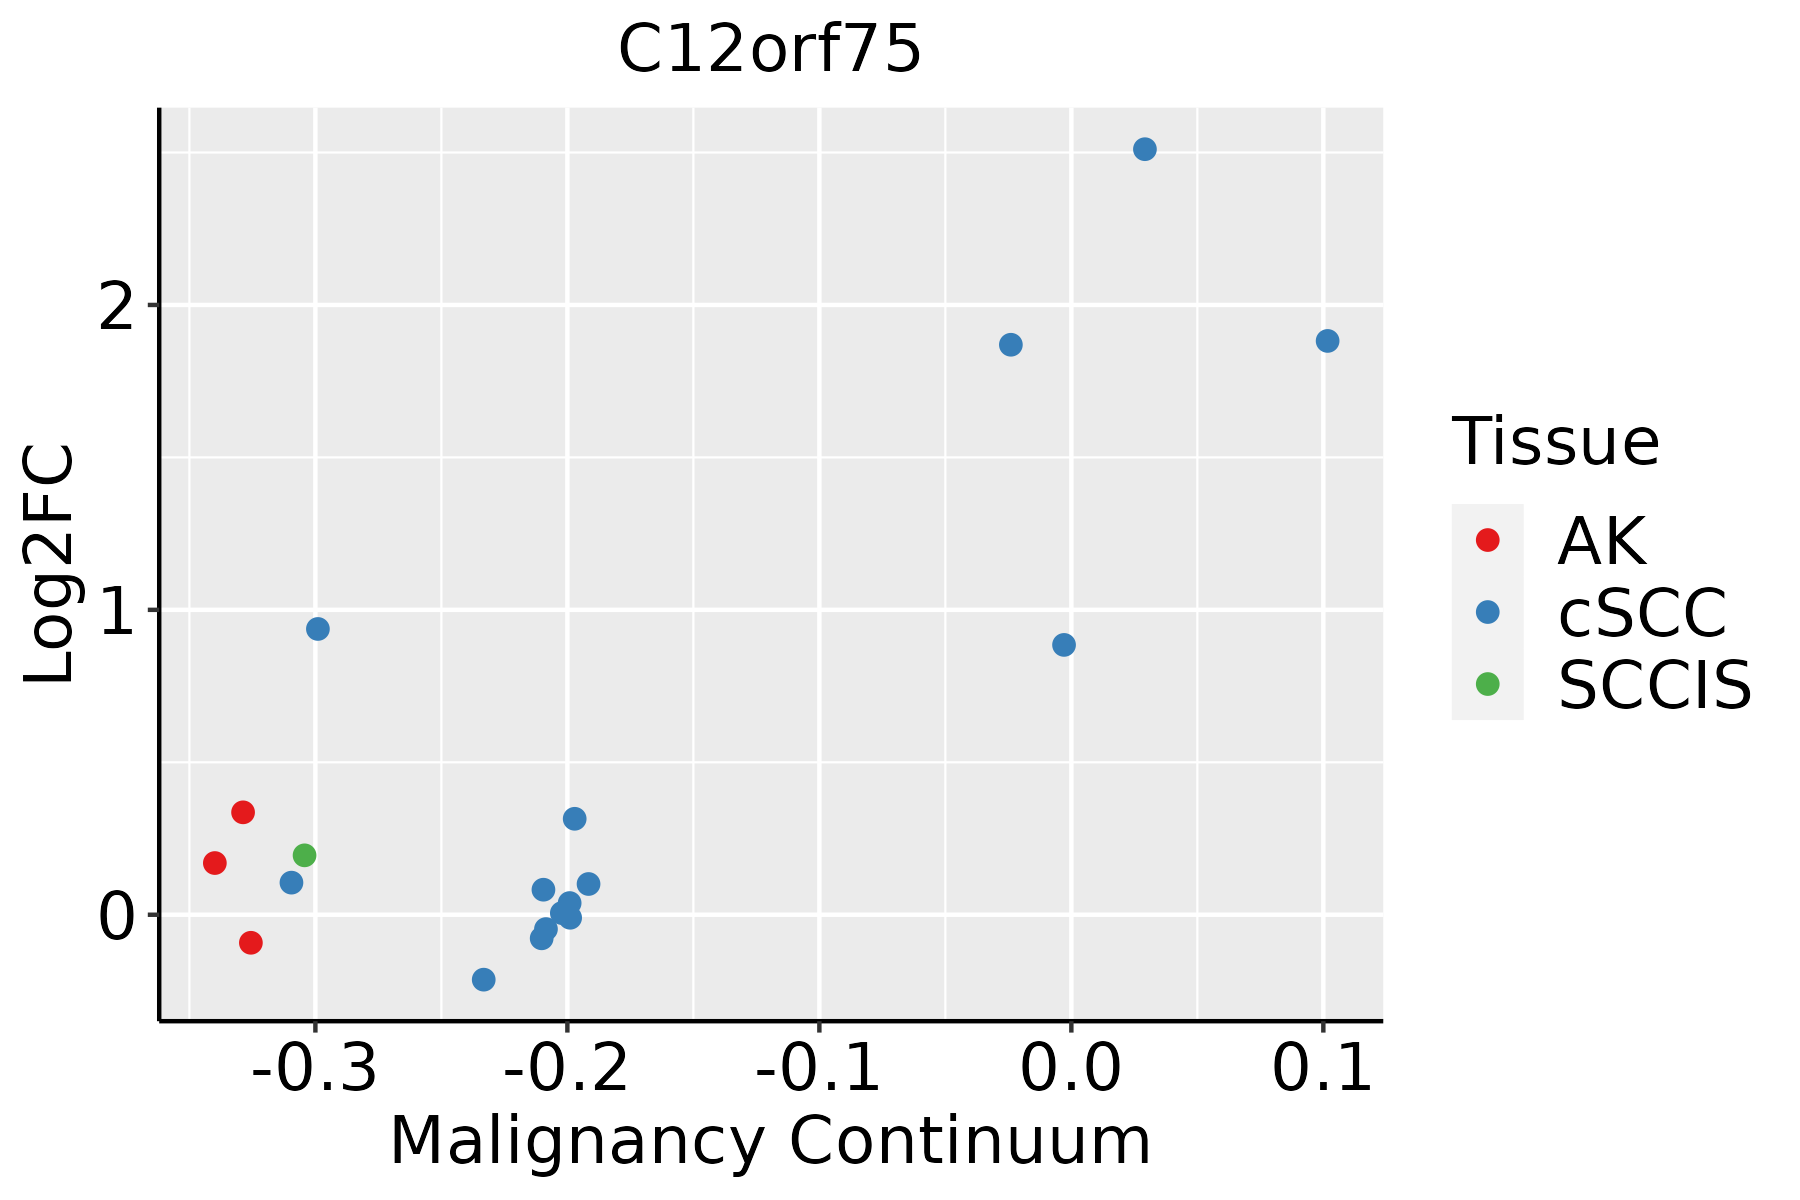 | AK: Actinic keratosis |
| cSCC: Cutaneous squamous cell carcinoma | ||
| SCCIS:squamous cell carcinoma in situ | ||
| Thyroid |  | ATC: Anaplastic thyroid cancer |
| HT: Hashimoto's thyroiditis | ||
| PTC: Papillary thyroid cancer |
| ∗log2FC in expression of this searched gene in stem-like cells from each diseased tissue sample relative to stem-like cells in normal samples in each tissue plotted against the malignancy continuum. Samples are colored based on if they are from different disease stage. |
Top |
Malignant transformation related pathway analysis |
| Find out the enriched GO biological processes and KEGG pathways involved in transition from healthy to precancer to cancer |
| Tissue | Disease Stage | Enriched GO biological Processes |
| Colorectum | AD |  |
| Colorectum | SER |  |
| Colorectum | MSS |  |
| Colorectum | MSI-H |  |
| Colorectum | FAP |  |
| ∗Top 15 enriched GO BP terms are showed in the bar plot of each disease state in each tissue. Each row represents a significant GO biological process which is colored according to the -log10(p.adjust). |
| Page: 1 2 3 4 5 6 7 8 9 |
| GO ID | Tissue | Disease Stage | Description | Gene Ratio | Bg Ratio | pvalue | p.adjust | Count |
| Page: 1 |
| Pathway ID | Tissue | Disease Stage | Description | Gene Ratio | Bg Ratio | pvalue | p.adjust | qvalue | Count |
| Page: 1 |
Top |
Cell-cell communication analysis |
| Identification of potential cell-cell interactions between two cell types and their ligand-receptor pairs for different disease states |
| Ligand | Receptor | LRpair | Pathway | Tissue | Disease Stage |
| Page: 1 |
Top |
Single-cell gene regulatory network inference analysis |
| Find out the significant the regulons (TFs) and the target genes of each regulon across cell types for different disease states |
| TF | Cell Type | Tissue | Disease Stage | Target Gene | RSS | Regulon Activity |
| ∗The dot plots of a searched regulon are shown for all cell subpopulations in each disease state of each tissue based on the regulon specific score inferred using pySCENIC and by calculating the average expression. |
| Page: 1 |
Top |
Somatic mutation of malignant transformation related genes |
| Annotation of somatic variants for genes involved in malignant transformation |
| Hugo Symbol | Variant Class | Variant Classification | dbSNP RS | HGVSc | HGVSp | HGVSp Short | SWISSPROT | BIOTYPE | SIFT | PolyPhen | Tumor Sample Barcode | Tissue | Histology | Sex | Age | Stage | Therapy Types | Drugs | Outcome |
| C12orf75 | SNV | Missense_Mutation | c.161C>G | p.Ser54Cys | p.S54C | Q8TAD7 | protein_coding | tolerated(0.06) | possibly_damaging(0.526) | TCGA-E9-A22E-01 | Breast | breast invasive carcinoma | Female | <65 | III/IV | Chemotherapy | cyclophosphane | SD | |
| C12orf75 | SNV | Missense_Mutation | c.67G>T | p.Asp23Tyr | p.D23Y | Q8TAD7 | protein_coding | deleterious(0) | possibly_damaging(0.873) | TCGA-BK-A6W3-01 | Endometrium | uterine corpus endometrioid carcinoma | Female | <65 | I/II | Unknown | Unknown | SD |
| Page: 1 |
Top |
Related drugs of malignant transformation related genes |
| Identification of chemicals and drugs interact with genes involved in malignant transfromation |
| (DGIdb 4.0) |
| Entrez ID | Symbol | Category | Interaction Types | Drug Claim Name | Drug Name | PMIDs |
| Page: 1 |

Copyright 2023-Present -The University of Texas Health Science Center at Houston |