Schematic overview of the cellular and molecular mechanisms involved in the cancer progression, including the proposed cellular and molecular mechanisms in cancer cells trajectory. AT1: alveolar type 1 cells; AT2: alveolar type 2 cells; AAH: atypical adenomatous hyperplasia; AIS: adenocarcinoma in situ; MIA: minimally invasive adenocarcinoma; IA: invasive adenocarcinoma; EMT: epithelial-mesenchymal transition

Home

Download

Statistics

Help

Contact

Center for Computational Systems Medicine
leaf

Gene summary

leaf

Malignant transformation analysis

leaf

Malignant transformation related pathway analysis

leaf

Cell-cell communication analysis

leaf

Single-cell gene regulatory network inference analysis

leaf

Somatic mutation of malignant transformation related genes

leaf

Related drugs of malignant transformation related genes

Gene: C12orf57

Gene summary for C12ORF57

check button Gene summary.

Gene informationSpeciesHuman
Gene symbol

C12orf57

Gene ID

113246

Gene namechromosome 12 open reading frame 57
Gene AliasC10
Cytomap12p13.31
Gene Typeprotein-coding
GO ID

GO:0000902

UniProtAcc

Q99622


Top

Malignant transformation analysis

check button Identification of the aberrant gene expression in precancerous and cancerous lesions by comparing the gene expression of stem-like cells in diseased tissues with normal stem cells
check button Malignant transformation involving gene list.
Entrez IDSymbolReplicatesSpeciesOrganTissueAdj P-valueLog2FCMalignancy
113246C12orf57CA_HPV_1HumanCervixCC1.57e-14-4.14e-010.0264
113246C12orf57CA_HPV_3HumanCervixCC5.84e-071.35e-010.0414
113246C12orf57CCI_1HumanCervixCC3.64e-12-8.02e-010.528
113246C12orf57CCI_2HumanCervixCC1.60e-08-6.95e-010.5249
113246C12orf57CCI_3HumanCervixCC2.77e-15-7.91e-010.516
113246C12orf57CCII_1HumanCervixCC5.24e-22-7.99e-010.3249
113246C12orf57sample3HumanCervixCC4.92e-02-1.44e-010.1387
113246C12orf57H2HumanCervixHSIL_HPV3.75e-05-4.11e-010.0632
113246C12orf57L1HumanCervixCC2.86e-06-4.14e-010.0802
113246C12orf57T3HumanCervixCC4.96e-03-1.18e-010.1389
113246C12orf57HTA11_3410_2000001011HumanColorectumAD2.68e-112.47e-010.0155
113246C12orf57HTA11_2487_2000001011HumanColorectumSER1.16e-124.40e-01-0.1808
113246C12orf57HTA11_2951_2000001011HumanColorectumAD1.15e-053.67e-010.0216
113246C12orf57HTA11_1938_2000001011HumanColorectumAD4.30e-134.67e-01-0.0811
113246C12orf57HTA11_78_2000001011HumanColorectumAD4.12e-029.98e-02-0.1088
113246C12orf57HTA11_347_2000001011HumanColorectumAD4.13e-224.93e-01-0.1954
113246C12orf57HTA11_411_2000001011HumanColorectumSER7.66e-128.05e-01-0.2602
113246C12orf57HTA11_2112_2000001011HumanColorectumSER3.17e-118.17e-01-0.2196
113246C12orf57HTA11_3361_2000001011HumanColorectumAD1.08e-104.43e-01-0.1207
113246C12orf57HTA11_83_2000001011HumanColorectumSER1.66e-073.49e-01-0.1526
Page: 1 2 3 4 5 6 7 8 9 10 11 12 13 

check button Transcriptomic changes along malignancy continuum.
TissueExpression DynamicsAbbreviation
CervixThe image shows the transcriptomic changes along malignancy continuum.log2FC in expression of this searched gene in stem-like cells from each diseased tissue sample relative to stem-like cells in normal samples in each tissue plotted against the malignancy continuum. Samples are colored based on if they are from different disease stage.CC: Cervix cancer
HSIL_HPV: HPV-infected high-grade squamous intraepithelial lesions
N_HPV: HPV-infected normal cervix
Colorectum (GSE201348)The image shows the transcriptomic changes along malignancy continuum.log2FC in expression of this searched gene in stem-like cells from each diseased tissue sample relative to stem-like cells in normal samples in each tissue plotted against the malignancy continuum. Samples are colored based on if they are from different disease stage.FAP: Familial adenomatous polyposis
CRC: Colorectal cancer
Colorectum (HTA11)The image shows the transcriptomic changes along malignancy continuum.log2FC in expression of this searched gene in stem-like cells from each diseased tissue sample relative to stem-like cells in normal samples in each tissue plotted against the malignancy continuum. Samples are colored based on if they are from different disease stage.AD: Adenomas
SER: Sessile serrated lesions
MSI-H: Microsatellite-high colorectal cancer
MSS: Microsatellite stable colorectal cancer
EndometriumThe image shows the transcriptomic changes along malignancy continuum.log2FC in expression of this searched gene in stem-like cells from each diseased tissue sample relative to stem-like cells in normal samples in each tissue plotted against the malignancy continuum. Samples are colored based on if they are from different disease stage.
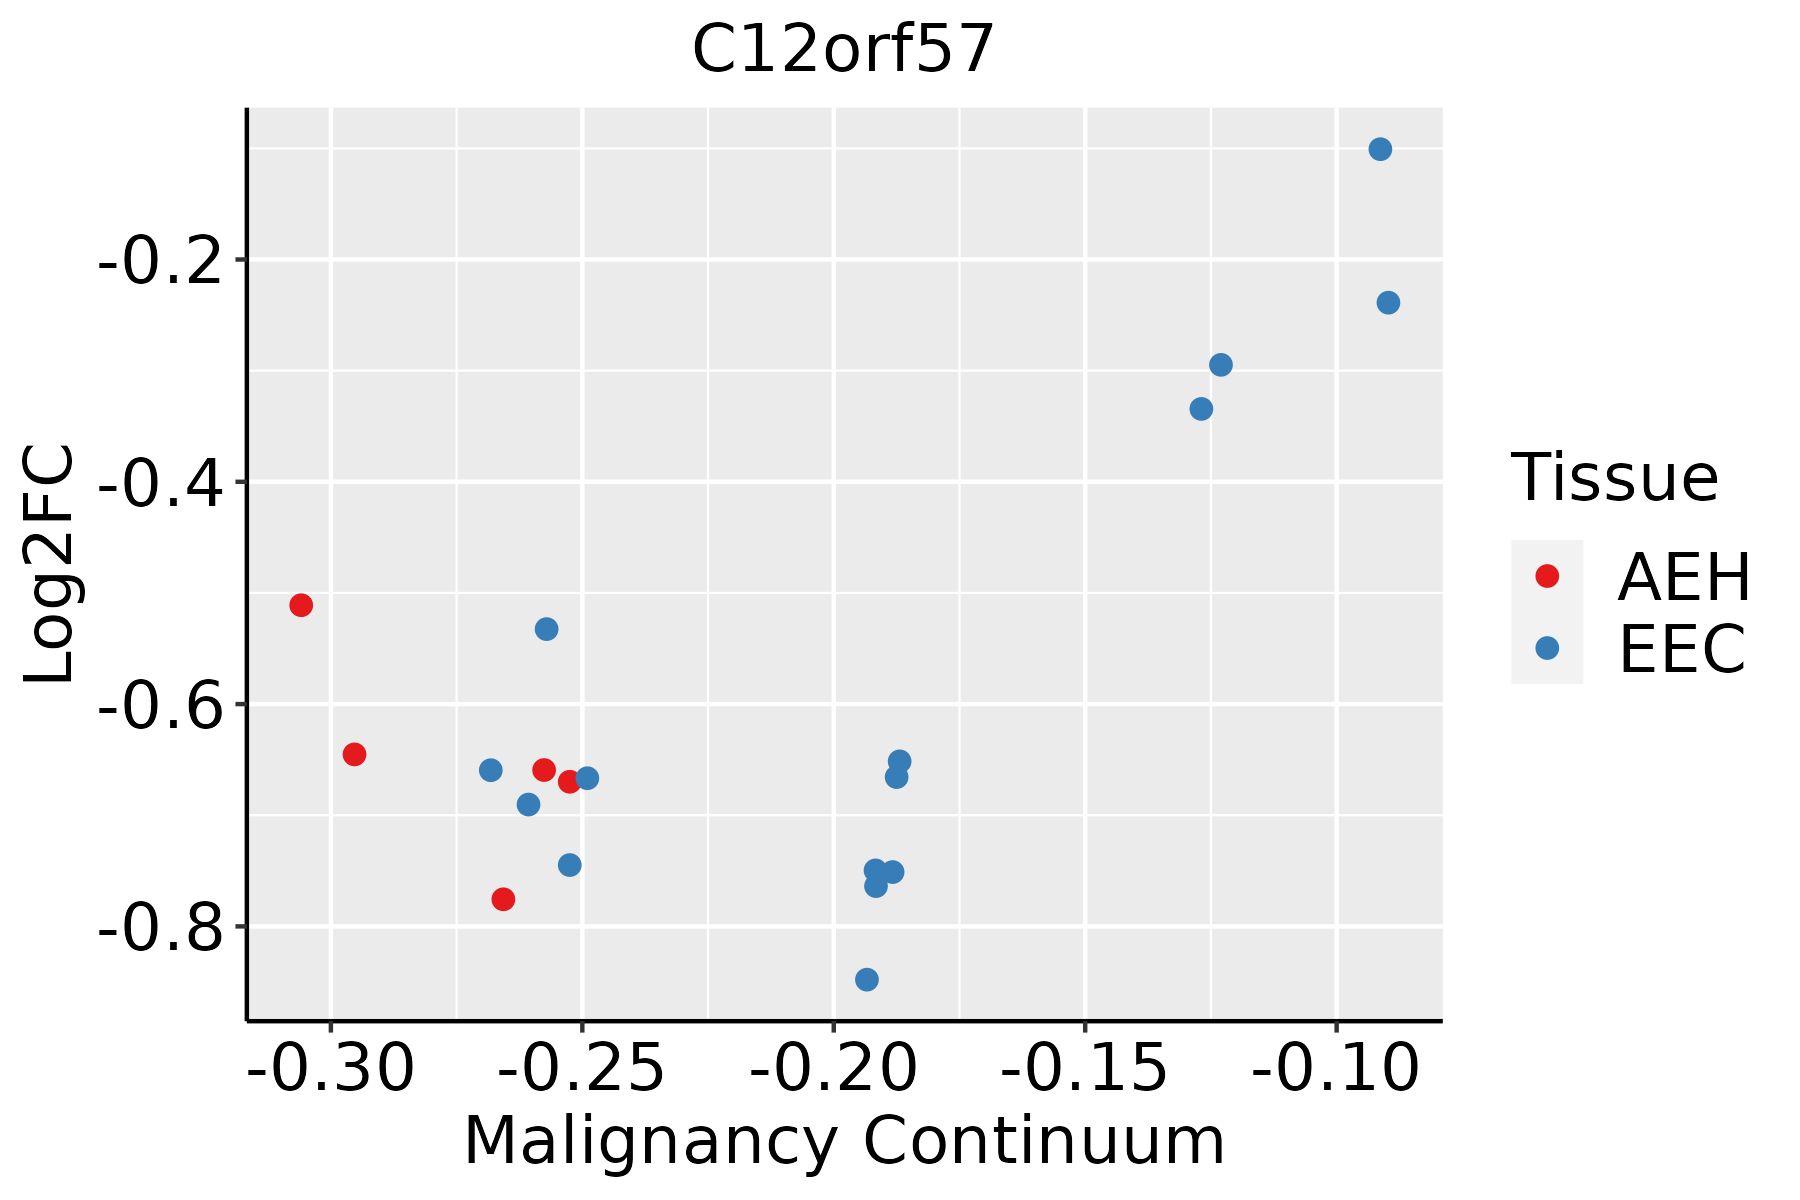
AEH: Atypical endometrial hyperplasia
EEC: Endometrioid Cancer
EsophagusThe image shows the transcriptomic changes along malignancy continuum.log2FC in expression of this searched gene in stem-like cells from each diseased tissue sample relative to stem-like cells in normal samples in each tissue plotted against the malignancy continuum. Samples are colored based on if they are from different disease stage.
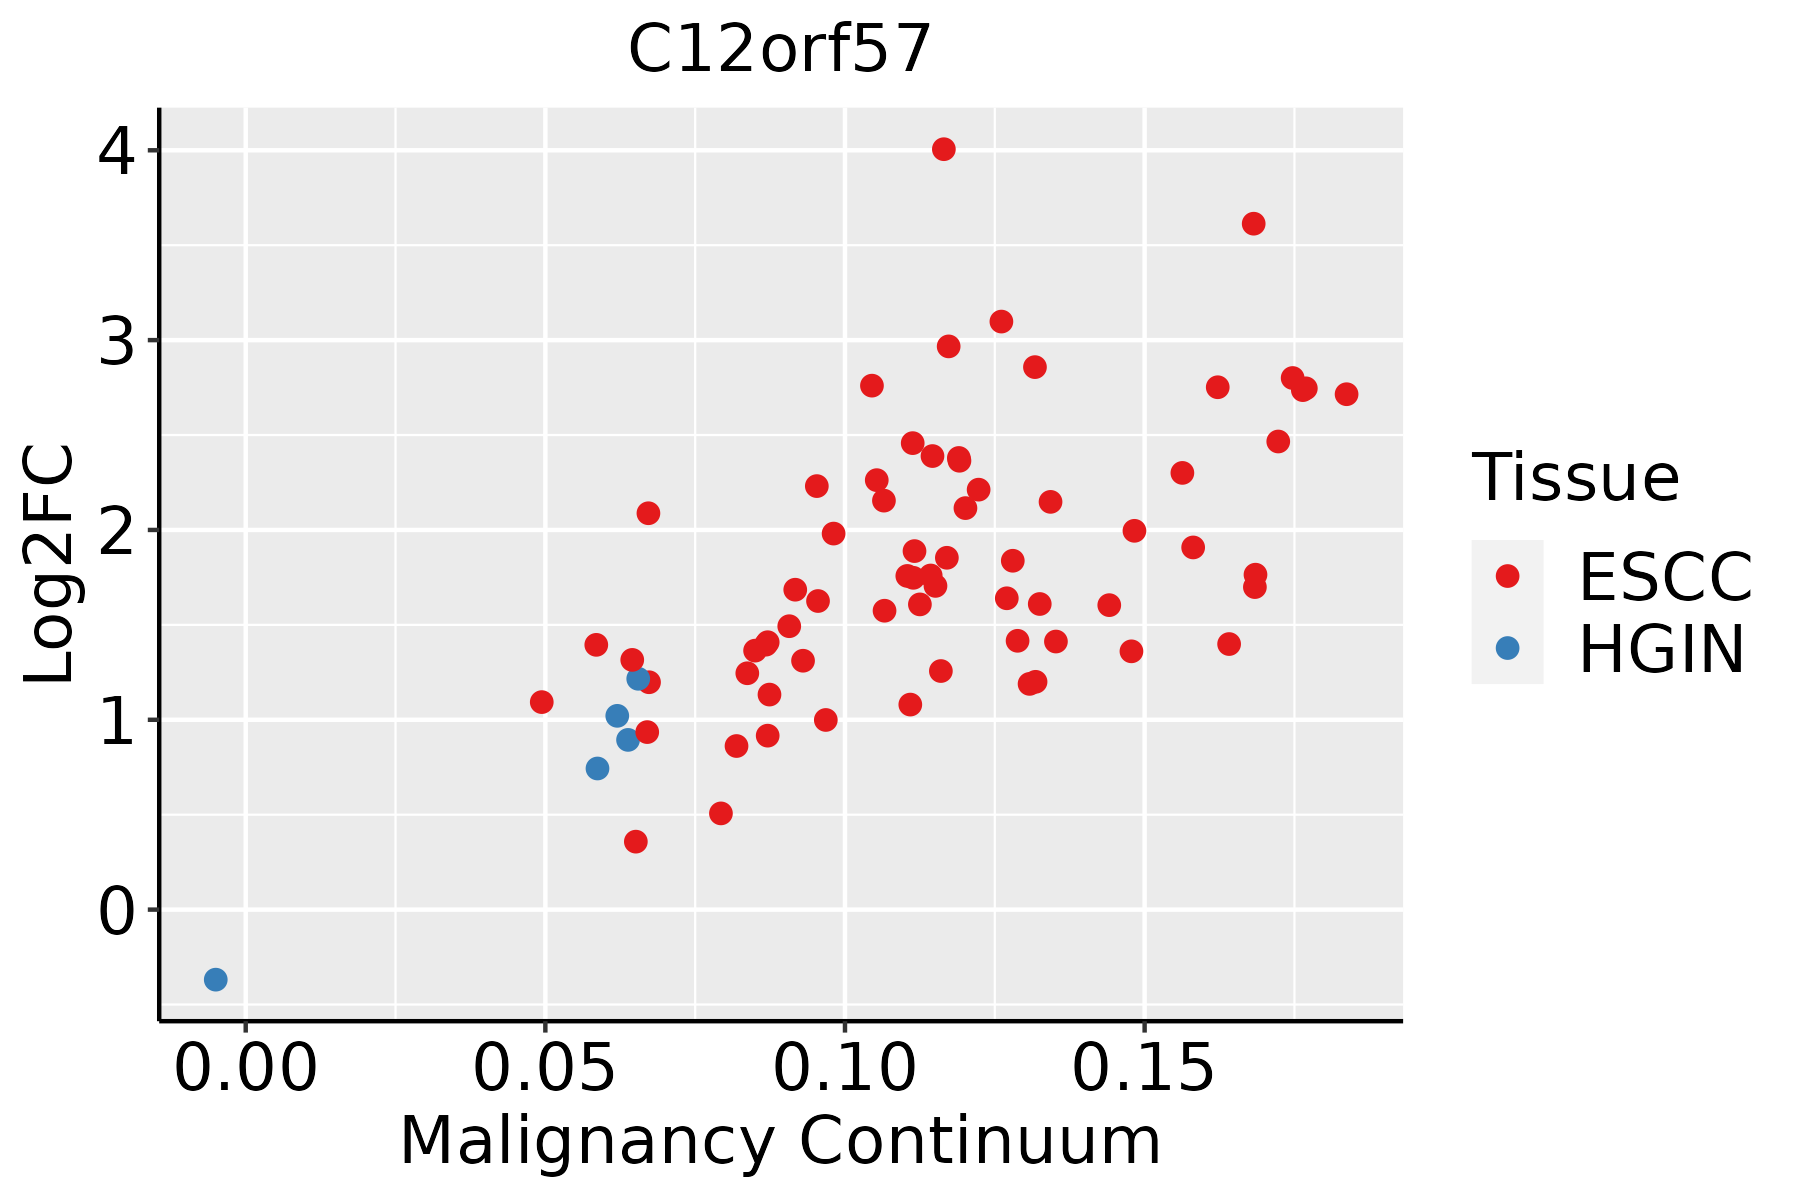
ESCC: Esophageal squamous cell carcinoma
HGIN: High-grade intraepithelial neoplasias
LGIN: Low-grade intraepithelial neoplasias
GCThe image shows the transcriptomic changes along malignancy continuum.log2FC in expression of this searched gene in stem-like cells from each diseased tissue sample relative to stem-like cells in normal samples in each tissue plotted against the malignancy continuum. Samples are colored based on if they are from different disease stage.CAG: Chronic atrophic gastritis
CAG with IM: Chronic atrophic gastritis with intestinal metaplasia
CSG: Chronic superficial gastritis
GC: Gastric cancer
SIM: Severe intestinal metaplasia
WIM: Wild intestinal metaplasia
LiverThe image shows the transcriptomic changes along malignancy continuum.log2FC in expression of this searched gene in stem-like cells from each diseased tissue sample relative to stem-like cells in normal samples in each tissue plotted against the malignancy continuum. Samples are colored based on if they are from different disease stage.
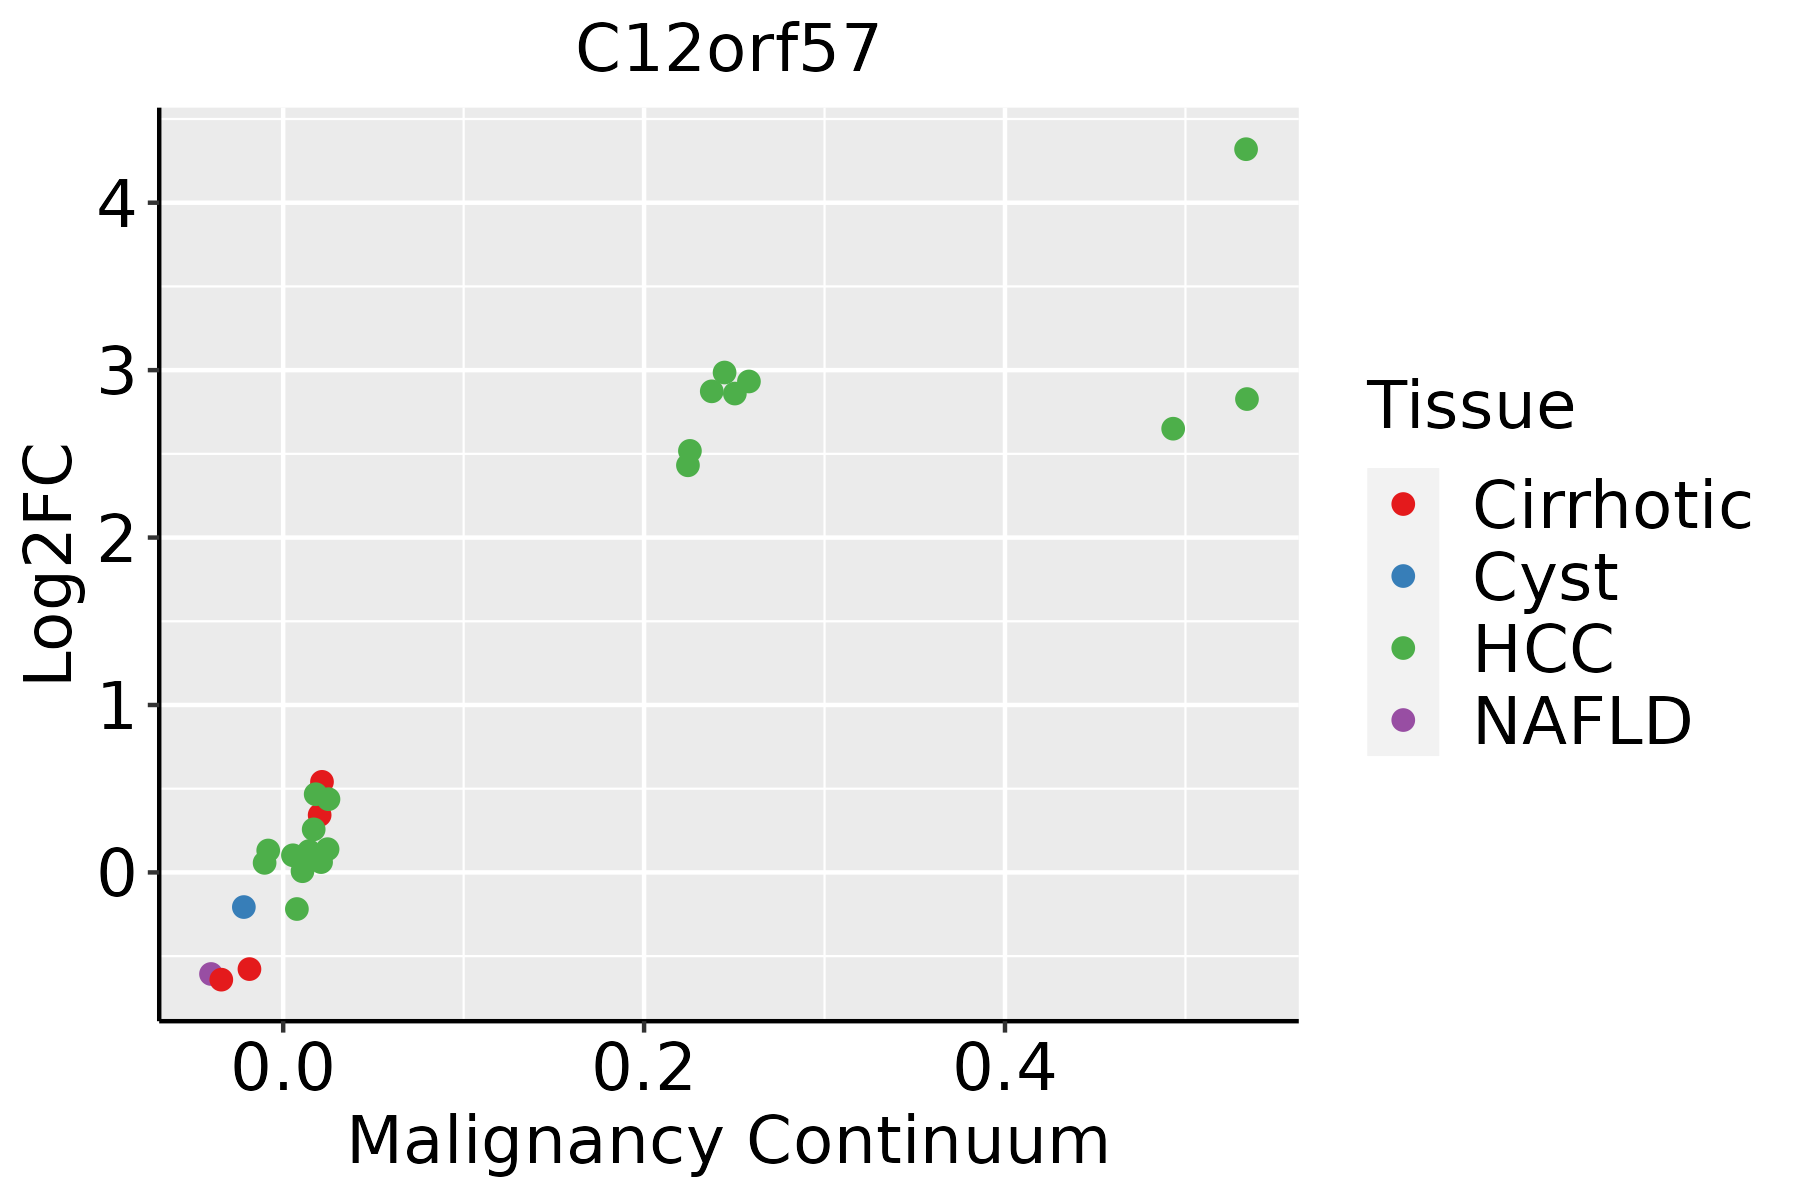
HCC: Hepatocellular carcinoma
NAFLD: Non-alcoholic fatty liver disease
Oral CavityThe image shows the transcriptomic changes along malignancy continuum.log2FC in expression of this searched gene in stem-like cells from each diseased tissue sample relative to stem-like cells in normal samples in each tissue plotted against the malignancy continuum. Samples are colored based on if they are from different disease stage.EOLP: Erosive Oral lichen planus
LP: leukoplakia
NEOLP: Non-erosive oral lichen planus
OSCC: Oral squamous cell carcinoma
ProstateThe image shows the transcriptomic changes along malignancy continuum.log2FC in expression of this searched gene in stem-like cells from each diseased tissue sample relative to stem-like cells in normal samples in each tissue plotted against the malignancy continuum. Samples are colored based on if they are from different disease stage.
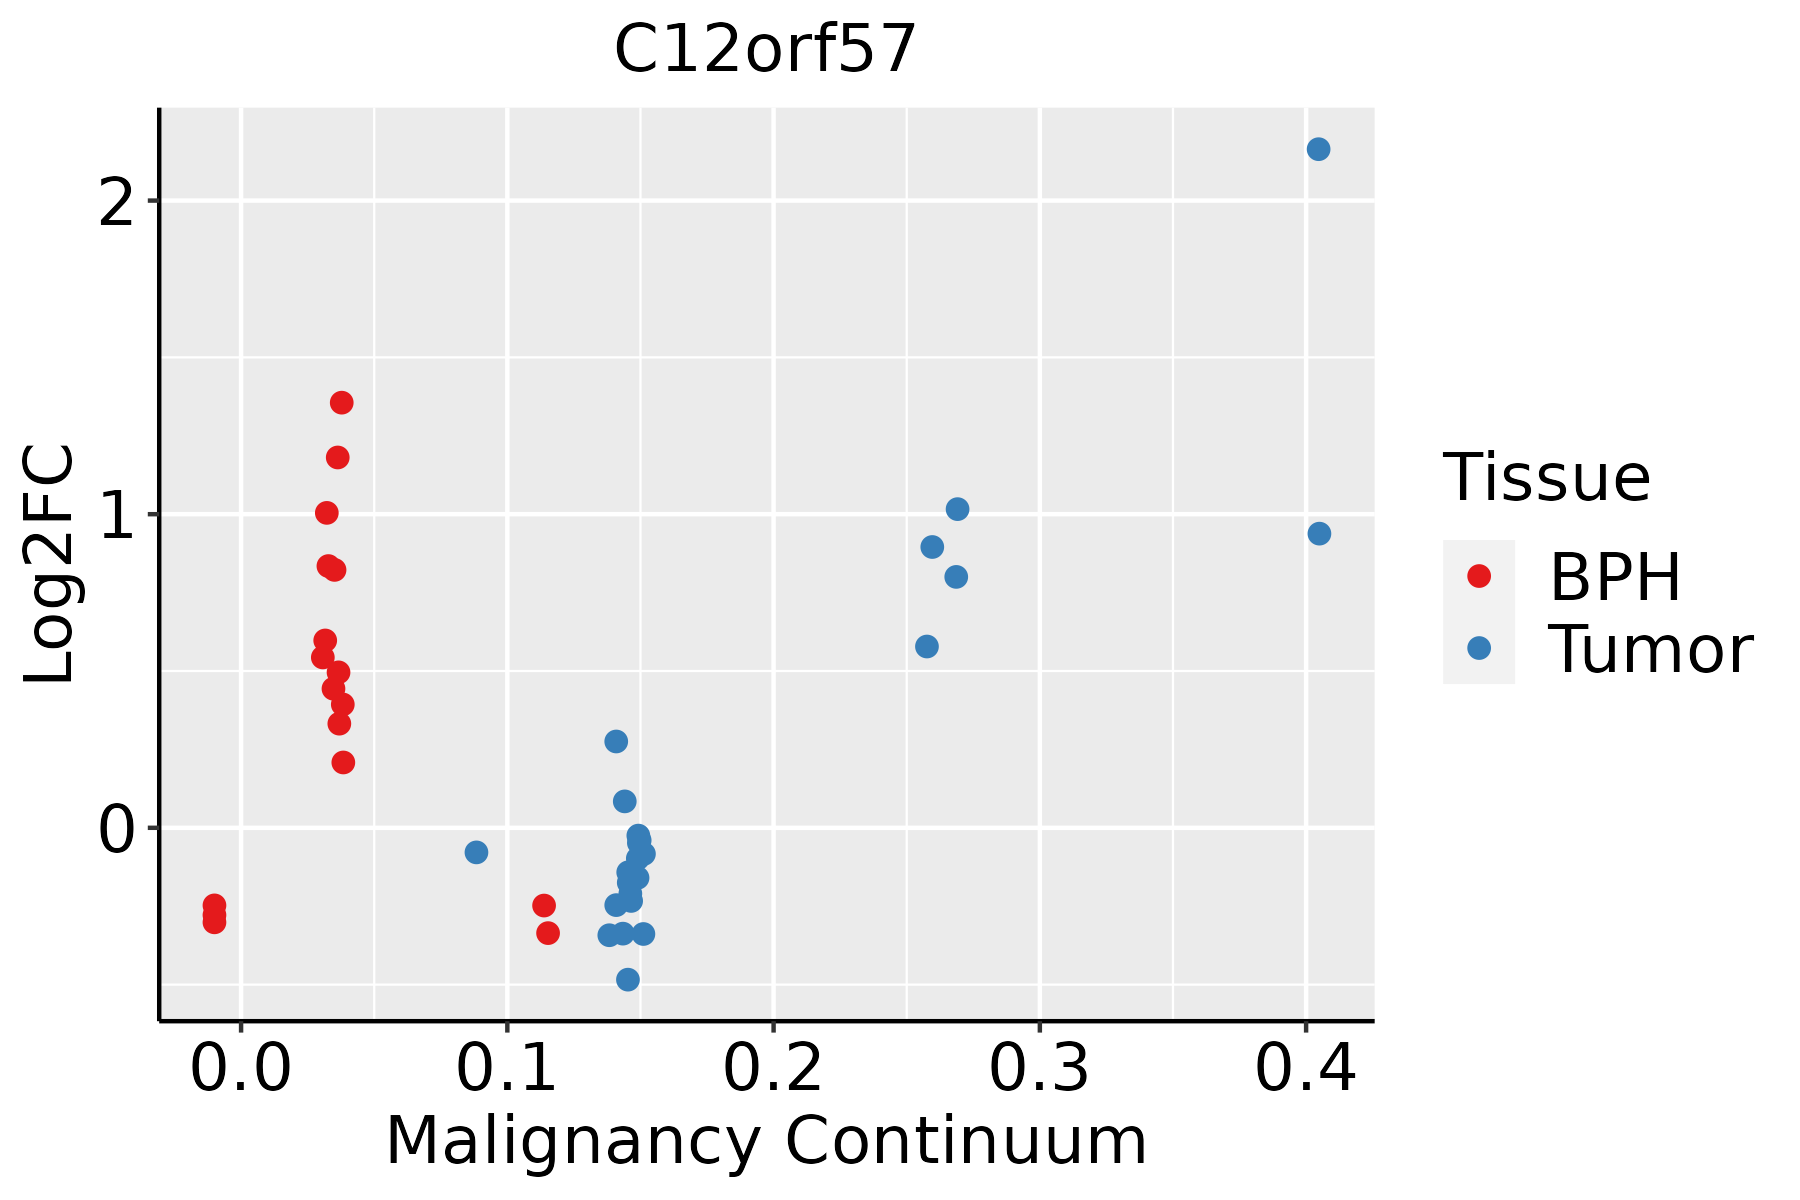
BPH: Benign Prostatic Hyperplasia
SkinThe image shows the transcriptomic changes along malignancy continuum.log2FC in expression of this searched gene in stem-like cells from each diseased tissue sample relative to stem-like cells in normal samples in each tissue plotted against the malignancy continuum. Samples are colored based on if they are from different disease stage.
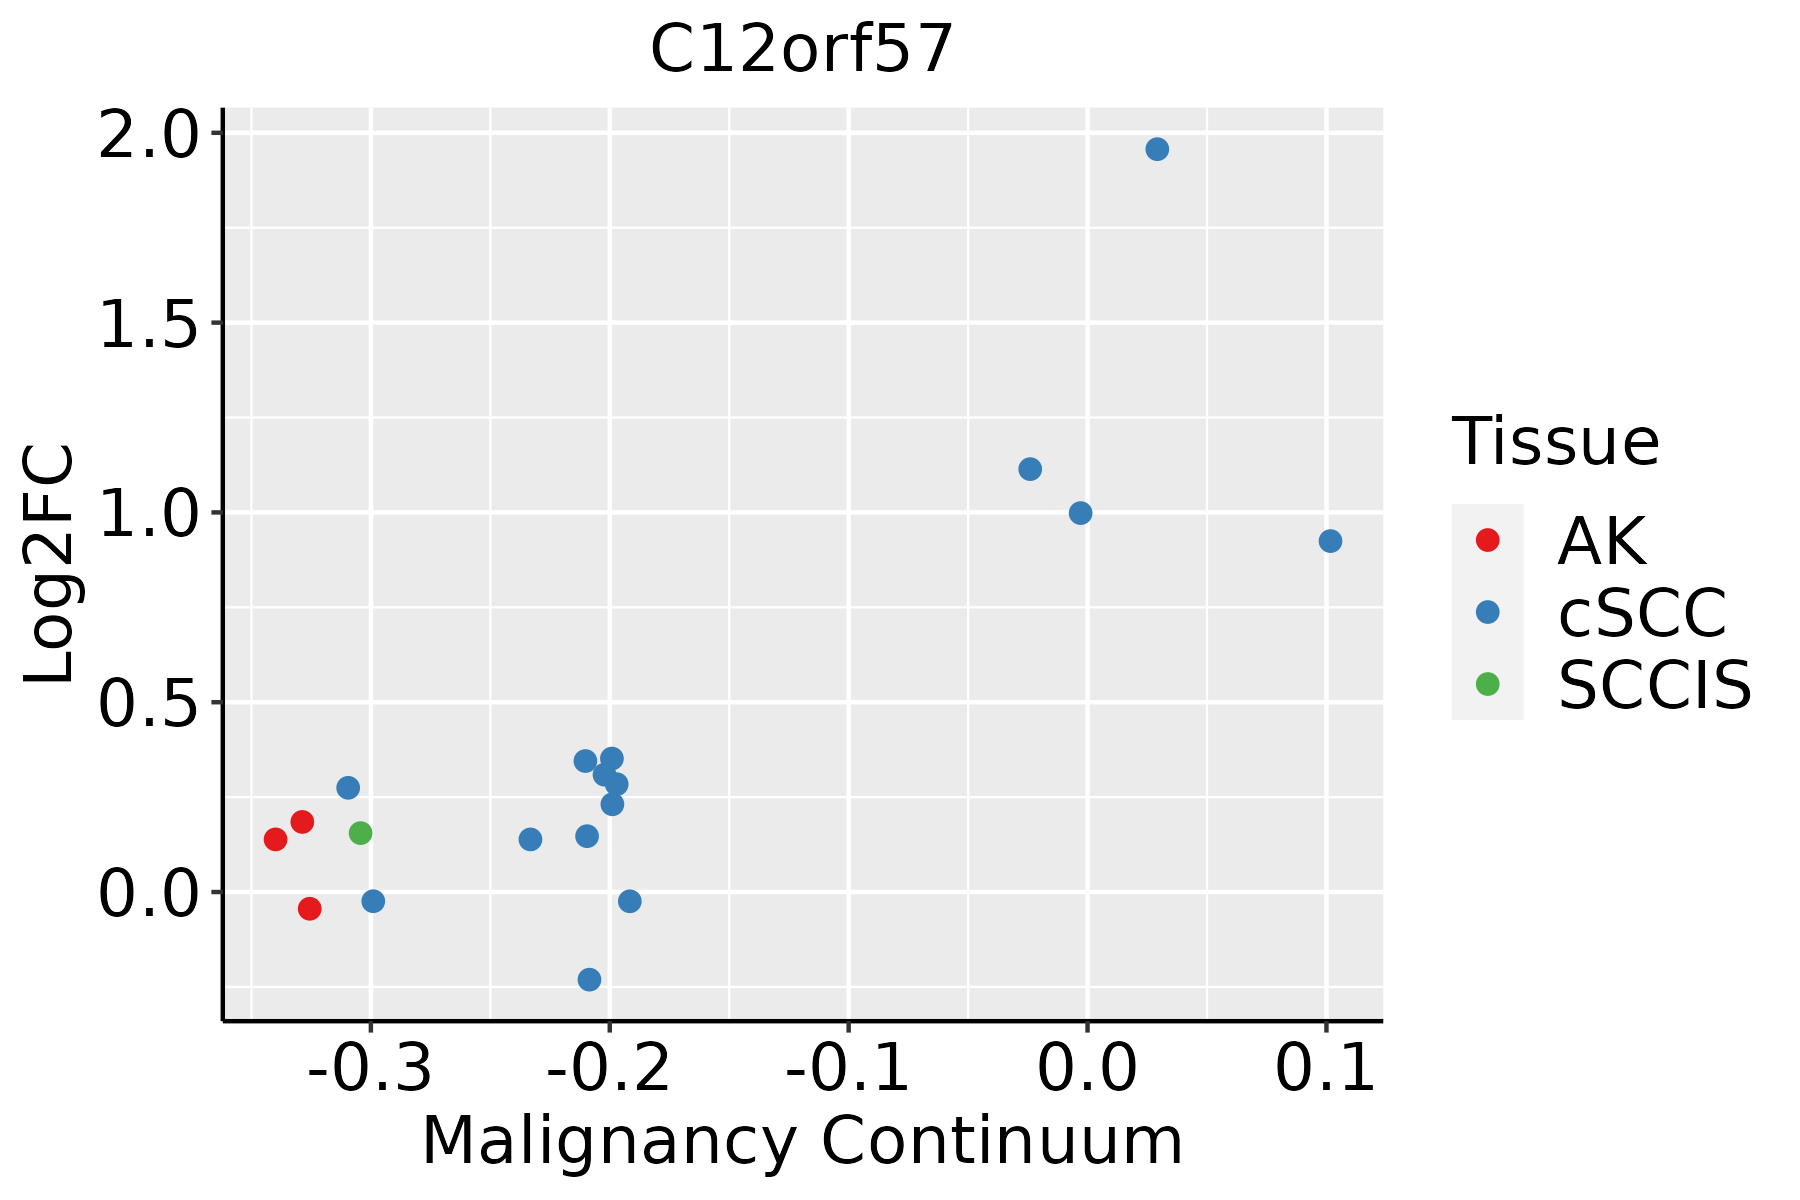
AK: Actinic keratosis
cSCC: Cutaneous squamous cell carcinoma
SCCIS:squamous cell carcinoma in situ
ThyroidThe image shows the transcriptomic changes along malignancy continuum.log2FC in expression of this searched gene in stem-like cells from each diseased tissue sample relative to stem-like cells in normal samples in each tissue plotted against the malignancy continuum. Samples are colored based on if they are from different disease stage.
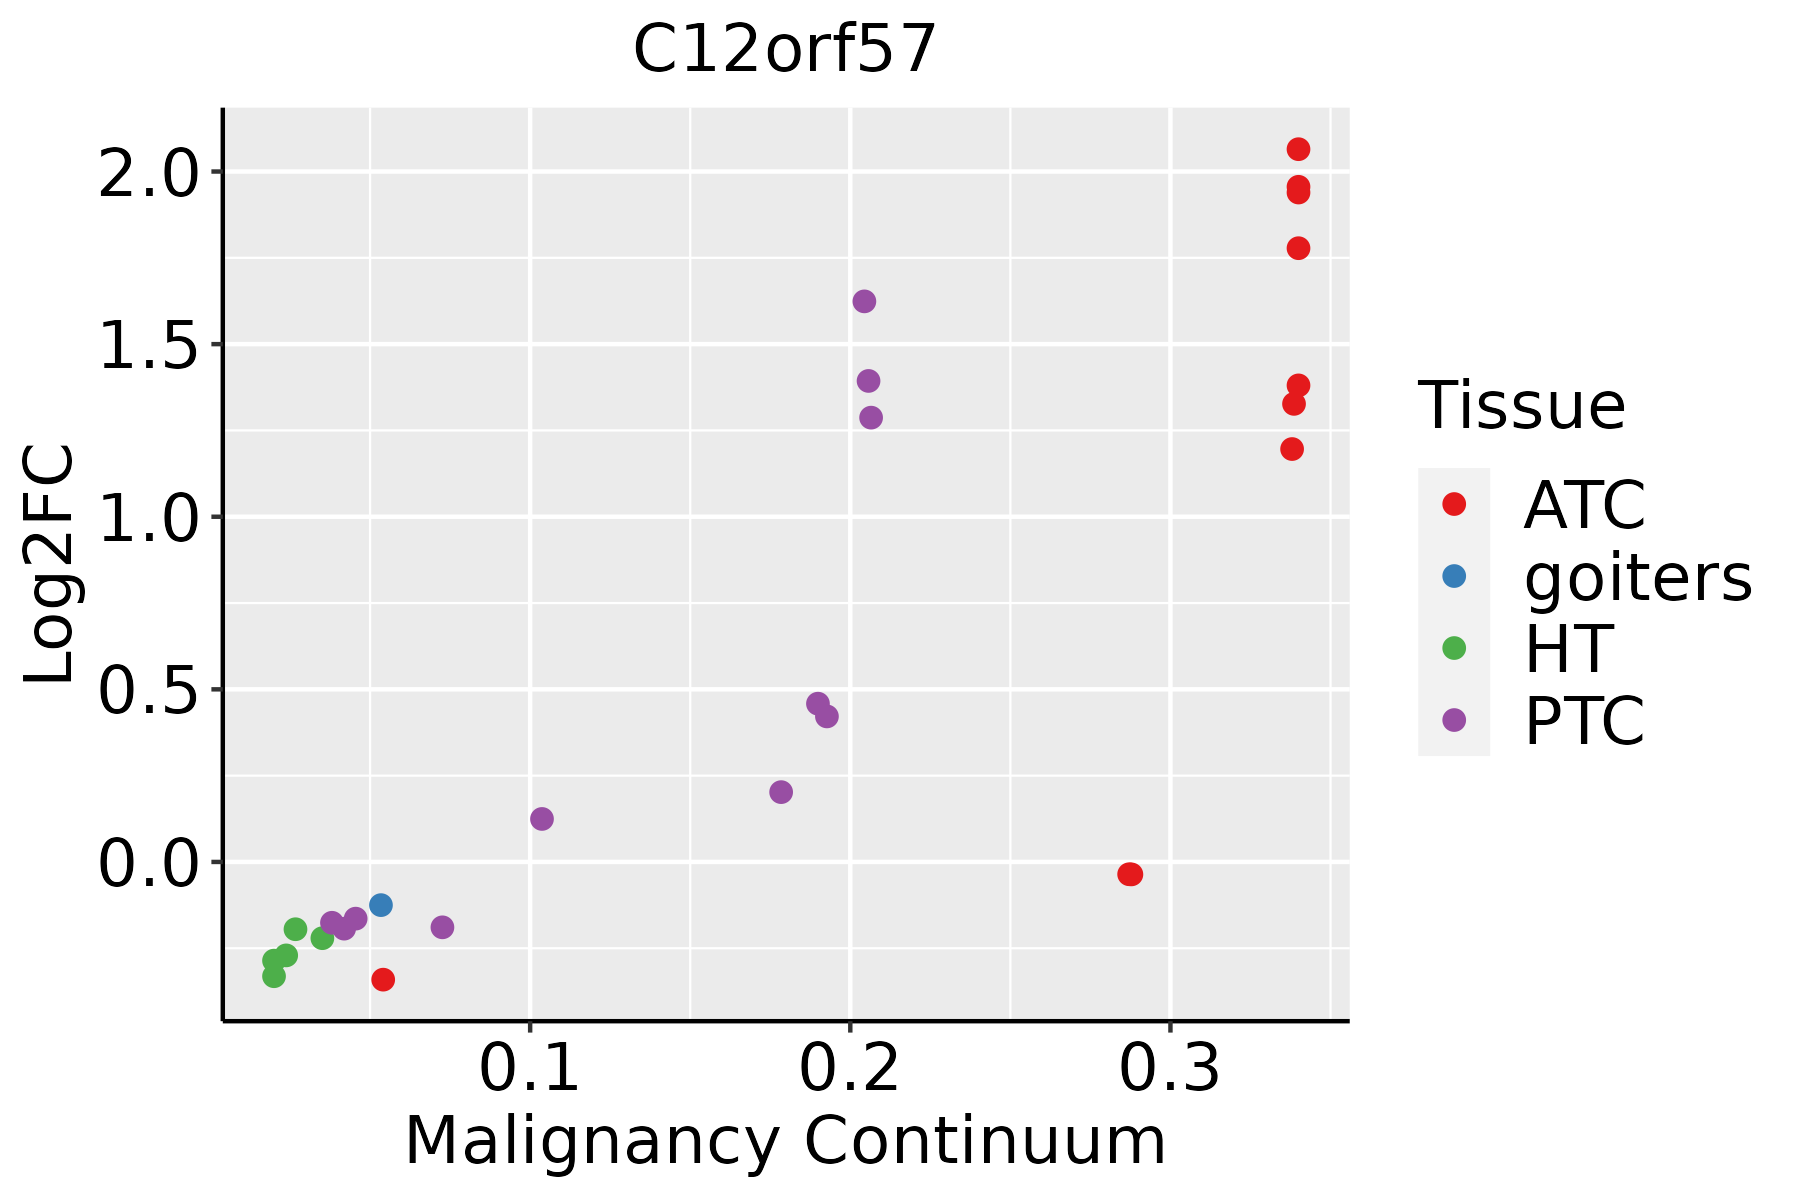
ATC: Anaplastic thyroid cancer
HT: Hashimoto's thyroiditis
PTC: Papillary thyroid cancer
∗log2FC in expression of this searched gene in stem-like cells from each diseased tissue sample relative to stem-like cells in normal samples in each tissue plotted against the malignancy continuum. Samples are colored based on if they are from different disease stage.

Top

Malignant transformation related pathway analysis

check buttonFind out the enriched GO biological processes and KEGG pathways involved in transition from healthy to precancer to cancer
check button Figure of enriched GO biological processes.
TissueDisease StageEnriched GO biological Processes
ColorectumADGO analysis - Figure of enriched GO biological processes: Top 15 enriched GO BP terms are showed in the bar plot of each disease state in each tissue. Each row represents a significant GO biological process which is colored according to the -log10(p.adjust).
ColorectumSERGO analysis - Figure of enriched GO biological processes: Top 15 enriched GO BP terms are showed in the bar plot of each disease state in each tissue. Each row represents a significant GO biological process which is colored according to the -log10(p.adjust).
ColorectumMSSGO analysis - Figure of enriched GO biological processes: Top 15 enriched GO BP terms are showed in the bar plot of each disease state in each tissue. Each row represents a significant GO biological process which is colored according to the -log10(p.adjust).
ColorectumMSI-HGO analysis - Figure of enriched GO biological processes: Top 15 enriched GO BP terms are showed in the bar plot of each disease state in each tissue. Each row represents a significant GO biological process which is colored according to the -log10(p.adjust).
ColorectumFAPGO analysis - Figure of enriched GO biological processes: Top 15 enriched GO BP terms are showed in the bar plot of each disease state in each tissue. Each row represents a significant GO biological process which is colored according to the -log10(p.adjust).
∗Top 15 enriched GO BP terms are showed in the bar plot of each disease state in each tissue. Each row represents a significant GO biological process which is colored according to the -log10(p.adjust).
Page: 1 2 3 4 5 6 7 8 9 

check button Enriched GO biological processes.
GO IDTissueDisease StageDescriptionGene RatioBg Ratiopvaluep.adjustCount
GO:00615647CervixCCaxon development89/2311467/187231.71e-053.27e-0489
GO:00074097CervixCCaxonogenesis78/2311418/187231.14e-041.43e-0378
GO:00097915CervixCCpost-embryonic development20/231180/187231.40e-031.10e-0220
GO:00219541CervixCCcentral nervous system neuron development19/231181/187233.96e-032.48e-0219
GO:00309003CervixCCforebrain development64/2311379/187235.53e-033.19e-0264
GO:0150063CervixCCvisual system development63/2311375/187236.58e-033.65e-0263
GO:00902578CervixCCregulation of muscle system process45/2311252/187236.73e-033.70e-0245
GO:0001654CervixCCeye development62/2311371/187237.83e-034.13e-0262
GO:0048880CervixCCsensory system development63/2311381/187239.29e-034.66e-0263
GO:0007409ColorectumADaxonogenesis122/3918418/187233.36e-056.15e-04122
GO:0061564ColorectumADaxon development132/3918467/187238.40e-051.31e-03132
GO:0009791ColorectumADpost-embryonic development29/391880/187231.13e-031.03e-0229
GO:0090257ColorectumADregulation of muscle system process73/3918252/187231.46e-031.24e-0273
GO:00902571ColorectumSERregulation of muscle system process60/2897252/187233.28e-045.22e-0360
GO:0003012ColorectumSERmuscle system process92/2897452/187232.98e-032.63e-0292
GO:00615641ColorectumSERaxon development94/2897467/187233.78e-033.13e-0294
GO:00097911ColorectumSERpost-embryonic development22/289780/187234.12e-033.36e-0222
GO:00074091ColorectumSERaxonogenesis84/2897418/187236.20e-034.49e-0284
GO:00074092ColorectumMSSaxonogenesis105/3467418/187234.32e-045.23e-03105
GO:00615642ColorectumMSSaxon development115/3467467/187235.33e-046.00e-03115
Page: 1 2 3 4 5 6 

check button Enriched KEGG pathways.
Pathway IDTissueDisease StageDescriptionGene RatioBg Ratiopvaluep.adjustqvalueCount
Page: 1 

Top

Cell-cell communication analysis

check buttonIdentification of potential cell-cell interactions between two cell types and their ligand-receptor pairs for different disease states
LigandReceptorLRpairPathwayTissueDisease Stage
Page: 1 

Top

Single-cell gene regulatory network inference analysis

check buttonFind out the significant the regulons (TFs) and the target genes of each regulon across cell types for different disease states
TFCell TypeTissueDisease StageTarget GeneRSSRegulon Activity
∗The dot plots of a searched regulon are shown for all cell subpopulations in each disease state of each tissue based on the regulon specific score inferred using pySCENIC and by calculating the average expression.
Page: 1 

Top

Somatic mutation of malignant transformation related genes

check buttonAnnotation of somatic variants for genes involved in malignant transformation
Hugo SymbolVariant ClassVariant ClassificationdbSNP RSHGVScHGVSpHGVSp ShortSWISSPROTBIOTYPESIFTPolyPhenTumor Sample BarcodeTissueHistologySexAgeStageTherapy TypesDrugsOutcome
C12orf57SNVMissense_Mutationc.160N>Ap.Val54Metp.V54MQ99622protein_codingdeleterious(0.04)benign(0.332)TCGA-A2-A0CW-01Breastbreast invasive carcinomaFemale>=65I/IIHormone TherapyanastrozoleSD
C12orf57SNVMissense_Mutationrs782133839c.291N>Ap.Ser97Argp.S97RQ99622protein_codingtolerated(0.76)benign(0.01)TCGA-E2-A152-01Breastbreast invasive carcinomaFemale<65I/IITargeted Molecular therapytrastuzumabPD
C12orf57SNVMissense_Mutationrs782133839c.291C>Ap.Ser97Argp.S97RQ99622protein_codingtolerated(0.76)benign(0.01)TCGA-AA-3867-01Colorectumcolon adenocarcinomaMale>=65III/IVUnknownUnknownPD
C12orf57SNVMissense_Mutationnovelc.98C>Tp.Ala33Valp.A33VQ99622protein_codingtolerated(0.27)benign(0.003)TCGA-A5-A0G2-01Endometriumuterine corpus endometrioid carcinomaFemale<65III/IVUnknownUnknownSD
C12orf57SNVMissense_Mutationnovelc.347G>Tp.Gly116Valp.G116VQ99622protein_codingdeleterious_low_confidence(0.01)possibly_damaging(0.778)TCGA-AX-A2HA-01Endometriumuterine corpus endometrioid carcinomaFemale<65I/IIUnknownUnknownSD
C12orf57SNVMissense_Mutationc.42N>Tp.Glu14Aspp.E14DQ99622protein_codingtolerated(0.18)probably_damaging(0.978)TCGA-D1-A103-01Endometriumuterine corpus endometrioid carcinomaFemale>=65I/IIUnknownUnknownSD
C12orf57SNVMissense_Mutationnovelc.94A>Cp.Asn32Hisp.N32HQ99622protein_codingdeleterious(0.02)probably_damaging(0.957)TCGA-EO-A22R-01Endometriumuterine corpus endometrioid carcinomaFemale<65I/IIUnknownUnknownSD
C12orf57SNVMissense_Mutationrs374751929c.373N>Ap.Ala125Thrp.A125TQ99622protein_codingtolerated_low_confidence(0.1)benign(0.034)TCGA-EO-A22U-01Endometriumuterine corpus endometrioid carcinomaFemale>=65I/IIUnknownUnknownSD
C12orf57SNVMissense_Mutationrs144915095c.328A>Gp.Met110Valp.M110VQ99622protein_codingtolerated(0.84)benign(0.015)TCGA-PG-A917-01Endometriumuterine corpus endometrioid carcinomaFemale>=65I/IIUnknownUnknownSD
C12orf57SNVMissense_Mutationc.74N>Tp.Gln25Leup.Q25LQ99622protein_codingtolerated(0.26)benign(0.024)TCGA-50-5930-01Lunglung adenocarcinomaMale<65III/IVChemotherapytaxoterePD
Page: 1 2 

Top

Related drugs of malignant transformation related genes

check buttonIdentification of chemicals and drugs interact with genes involved in malignant transfromation
(DGIdb 4.0)
Entrez IDSymbolCategoryInteraction TypesDrug Claim NameDrug NamePMIDs
Page: 1