
|
|||||
|
 | |
| |
| |
| |
| |
| |
|
Gene: C12orf56 |
Gene summary for C12ORF56 |
| Gene information | Species | Human | Gene symbol | C12orf56 | Gene ID | 115749 |
| Gene name | chromosome 12 open reading frame 56 | |
| Gene Alias | C12orf56 | |
| Cytomap | 12q14.2 | |
| Gene Type | protein-coding | GO ID | NA | UniProtAcc | Q8IXR9 |
Top |
Malignant transformation analysis |
| Identification of the aberrant gene expression in precancerous and cancerous lesions by comparing the gene expression of stem-like cells in diseased tissues with normal stem cells |
| Entrez ID | Symbol | Replicates | Species | Organ | Tissue | Adj P-value | Log2FC | Malignancy |
| 115749 | C12orf56 | LZE24T | Human | Esophagus | ESCC | 9.53e-03 | 1.46e-01 | 0.0596 |
| 115749 | C12orf56 | P2T-E | Human | Esophagus | ESCC | 2.63e-06 | 1.35e-01 | 0.1177 |
| 115749 | C12orf56 | P4T-E | Human | Esophagus | ESCC | 1.93e-08 | 1.84e-01 | 0.1323 |
| 115749 | C12orf56 | P5T-E | Human | Esophagus | ESCC | 6.86e-04 | 1.05e-01 | 0.1327 |
| 115749 | C12orf56 | P8T-E | Human | Esophagus | ESCC | 5.67e-25 | 4.25e-01 | 0.0889 |
| 115749 | C12orf56 | P10T-E | Human | Esophagus | ESCC | 4.33e-19 | 3.50e-01 | 0.116 |
| 115749 | C12orf56 | P12T-E | Human | Esophagus | ESCC | 1.01e-23 | 4.28e-01 | 0.1122 |
| 115749 | C12orf56 | P15T-E | Human | Esophagus | ESCC | 2.25e-22 | 5.29e-01 | 0.1149 |
| 115749 | C12orf56 | P16T-E | Human | Esophagus | ESCC | 8.53e-08 | 9.56e-02 | 0.1153 |
| 115749 | C12orf56 | P20T-E | Human | Esophagus | ESCC | 1.16e-14 | 3.15e-01 | 0.1124 |
| 115749 | C12orf56 | P21T-E | Human | Esophagus | ESCC | 4.39e-06 | 1.46e-01 | 0.1617 |
| 115749 | C12orf56 | P22T-E | Human | Esophagus | ESCC | 5.00e-08 | 1.13e-01 | 0.1236 |
| 115749 | C12orf56 | P23T-E | Human | Esophagus | ESCC | 6.88e-13 | 3.75e-01 | 0.108 |
| 115749 | C12orf56 | P26T-E | Human | Esophagus | ESCC | 1.60e-08 | 1.07e-01 | 0.1276 |
| 115749 | C12orf56 | P27T-E | Human | Esophagus | ESCC | 9.30e-25 | 5.01e-01 | 0.1055 |
| 115749 | C12orf56 | P28T-E | Human | Esophagus | ESCC | 1.81e-07 | 1.81e-01 | 0.1149 |
| 115749 | C12orf56 | P30T-E | Human | Esophagus | ESCC | 1.10e-07 | 3.36e-01 | 0.137 |
| 115749 | C12orf56 | P31T-E | Human | Esophagus | ESCC | 4.61e-07 | 7.96e-02 | 0.1251 |
| 115749 | C12orf56 | P32T-E | Human | Esophagus | ESCC | 1.94e-08 | 1.60e-01 | 0.1666 |
| 115749 | C12orf56 | P36T-E | Human | Esophagus | ESCC | 1.12e-05 | 2.97e-01 | 0.1187 |
| Page: 1 2 3 |
| Tissue | Expression Dynamics | Abbreviation |
| Esophagus | 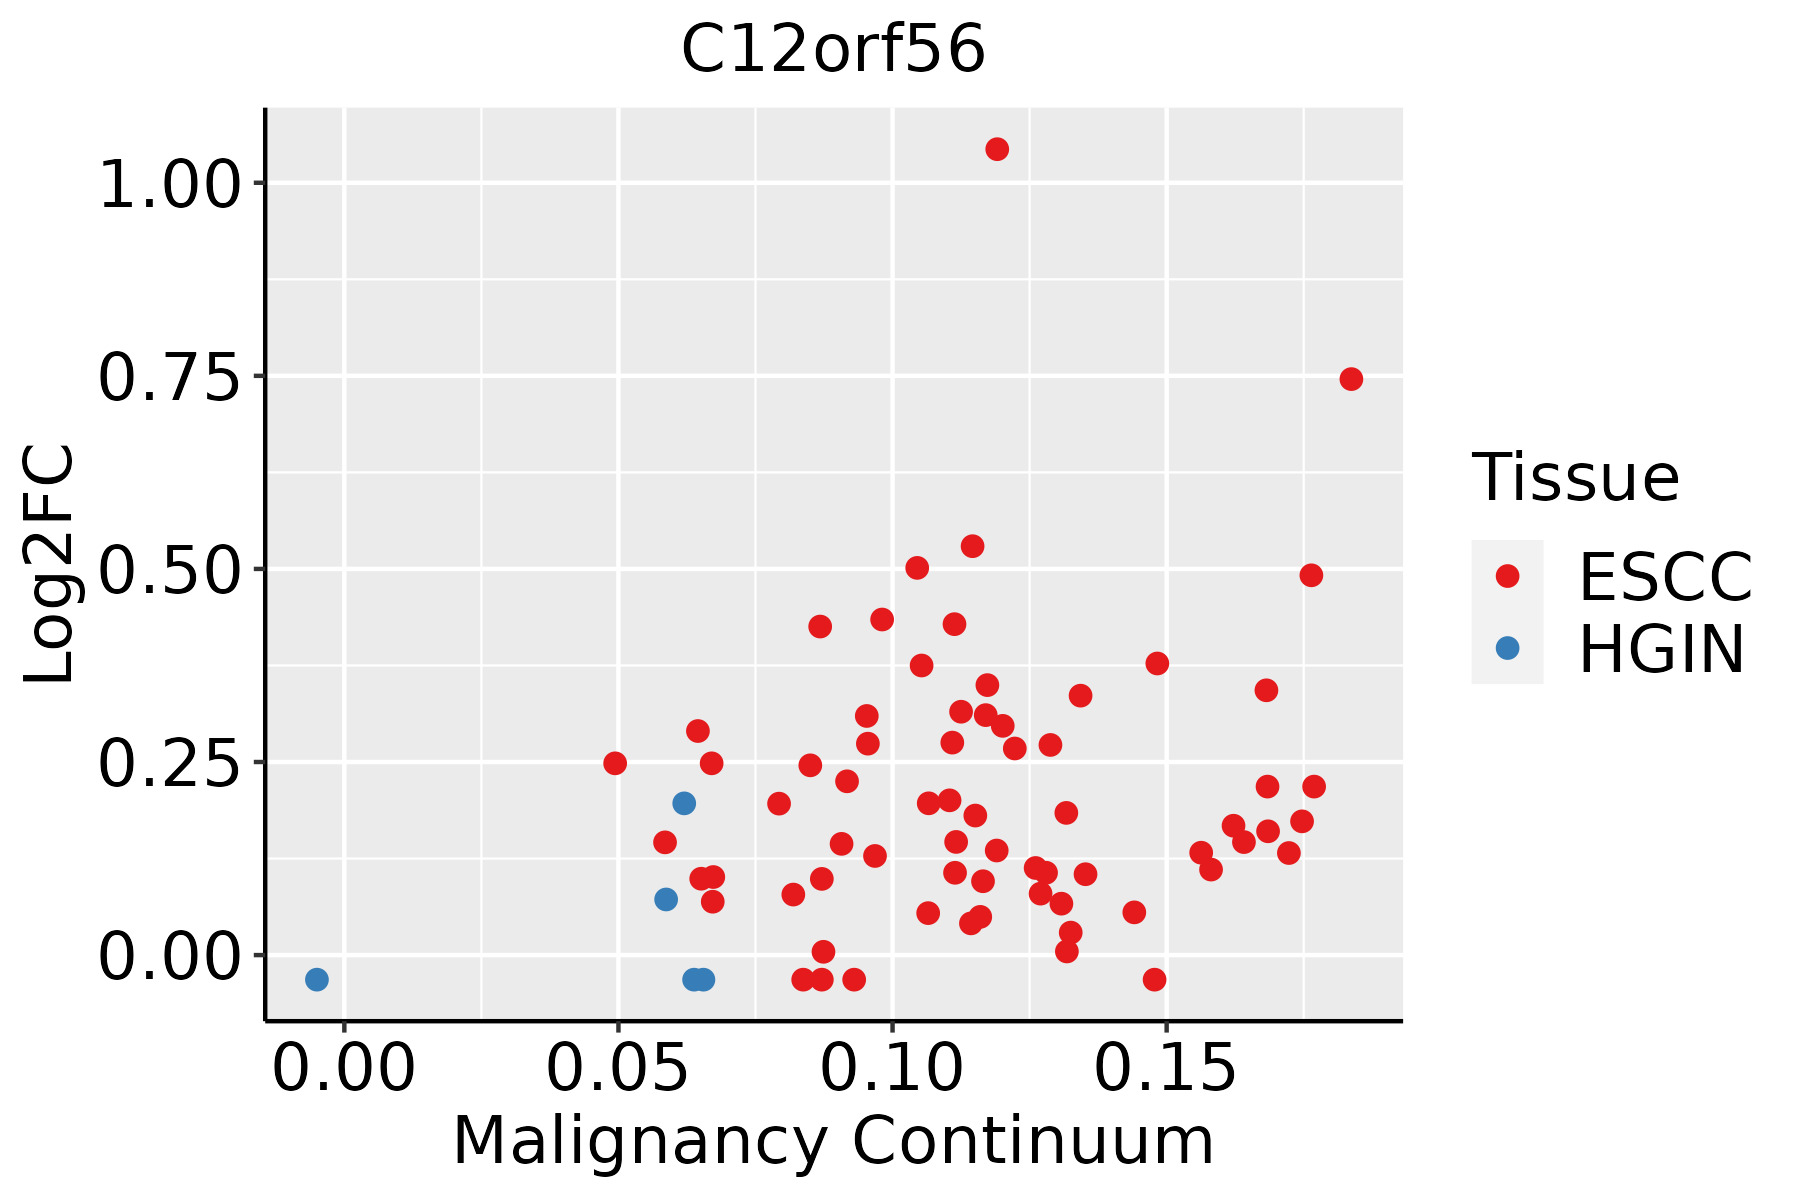 | ESCC: Esophageal squamous cell carcinoma |
| HGIN: High-grade intraepithelial neoplasias | ||
| LGIN: Low-grade intraepithelial neoplasias | ||
| Oral Cavity | 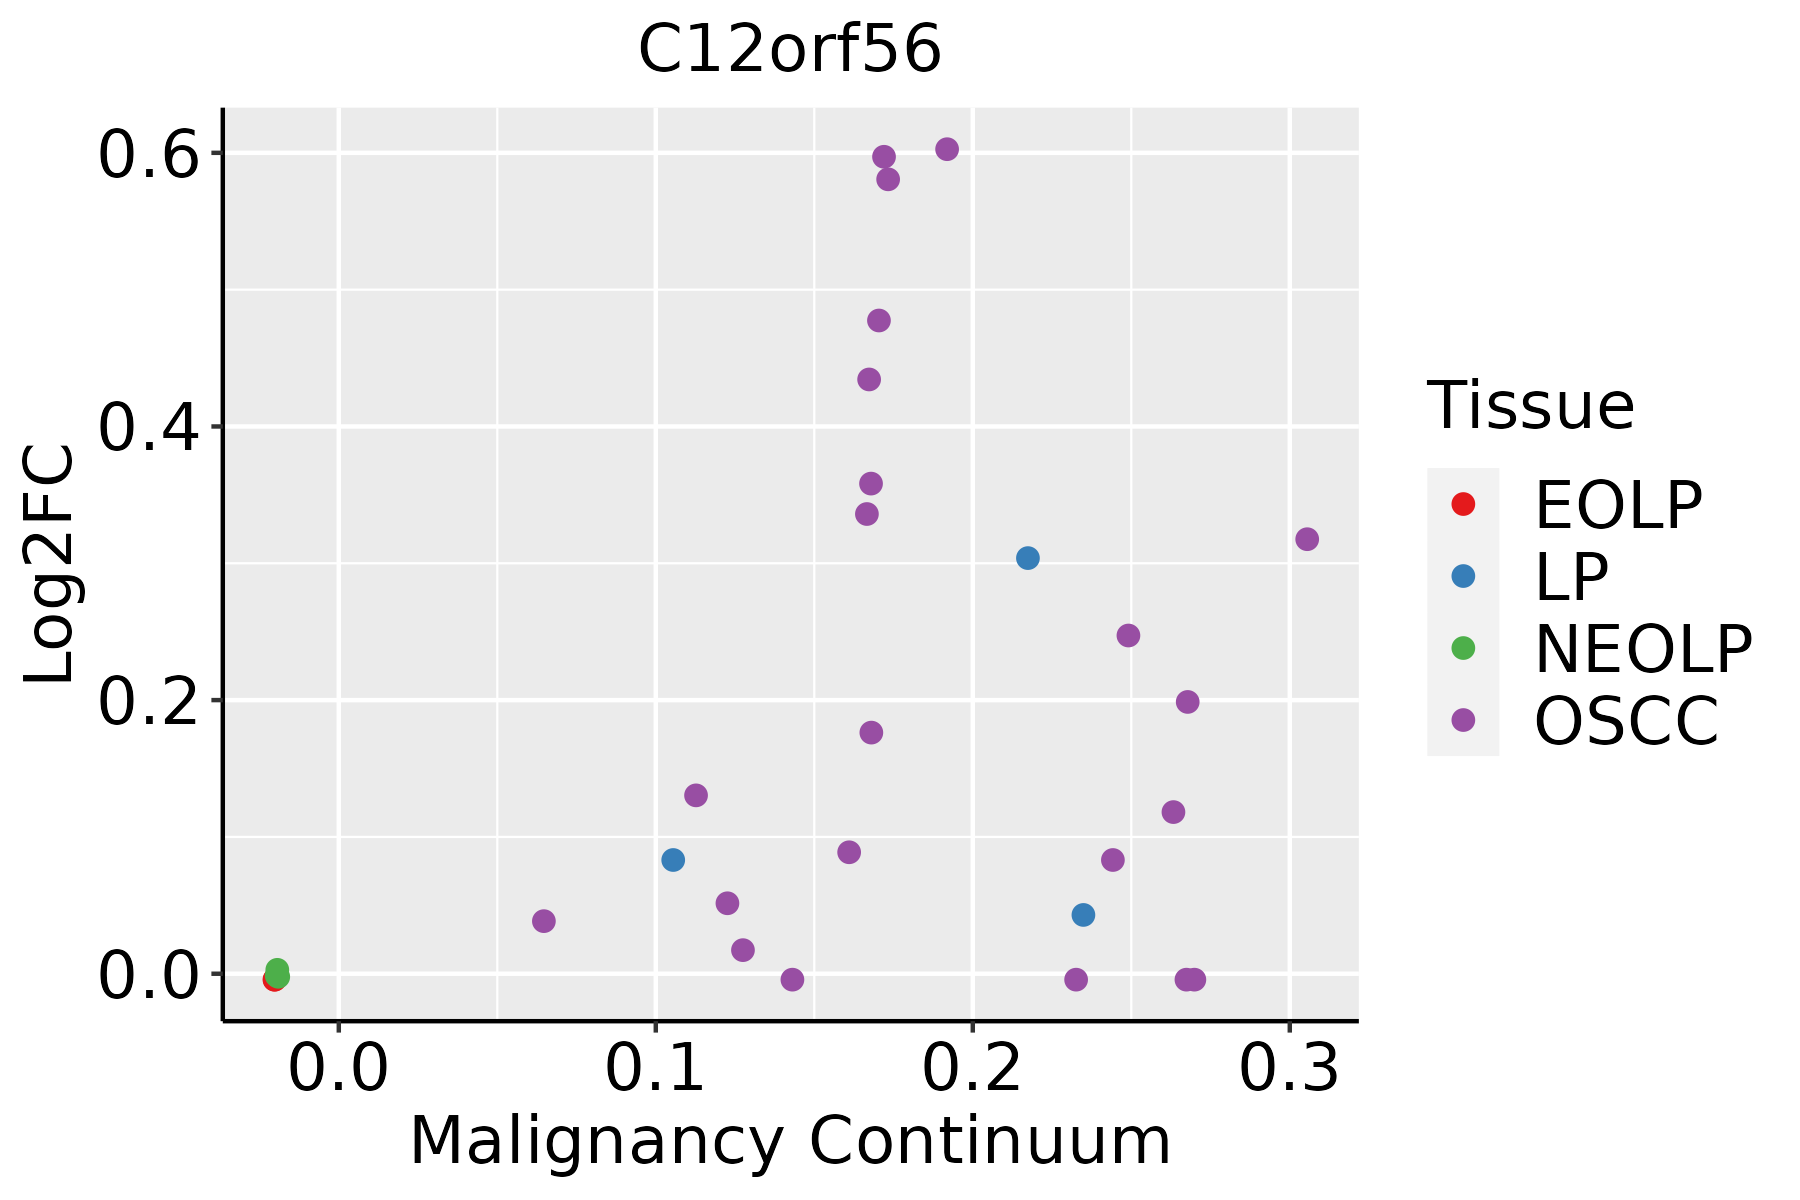 | EOLP: Erosive Oral lichen planus |
| LP: leukoplakia | ||
| NEOLP: Non-erosive oral lichen planus | ||
| OSCC: Oral squamous cell carcinoma |
| ∗log2FC in expression of this searched gene in stem-like cells from each diseased tissue sample relative to stem-like cells in normal samples in each tissue plotted against the malignancy continuum. Samples are colored based on if they are from different disease stage. |
Top |
Malignant transformation related pathway analysis |
| Find out the enriched GO biological processes and KEGG pathways involved in transition from healthy to precancer to cancer |
| Tissue | Disease Stage | Enriched GO biological Processes |
| Colorectum | AD |  |
| Colorectum | SER |  |
| Colorectum | MSS |  |
| Colorectum | MSI-H |  |
| Colorectum | FAP |  |
| ∗Top 15 enriched GO BP terms are showed in the bar plot of each disease state in each tissue. Each row represents a significant GO biological process which is colored according to the -log10(p.adjust). |
| Page: 1 2 3 4 5 6 7 8 9 |
| GO ID | Tissue | Disease Stage | Description | Gene Ratio | Bg Ratio | pvalue | p.adjust | Count |
| Page: 1 |
| Pathway ID | Tissue | Disease Stage | Description | Gene Ratio | Bg Ratio | pvalue | p.adjust | qvalue | Count |
| Page: 1 |
Top |
Cell-cell communication analysis |
| Identification of potential cell-cell interactions between two cell types and their ligand-receptor pairs for different disease states |
| Ligand | Receptor | LRpair | Pathway | Tissue | Disease Stage |
| Page: 1 |
Top |
Single-cell gene regulatory network inference analysis |
| Find out the significant the regulons (TFs) and the target genes of each regulon across cell types for different disease states |
| TF | Cell Type | Tissue | Disease Stage | Target Gene | RSS | Regulon Activity |
| ∗The dot plots of a searched regulon are shown for all cell subpopulations in each disease state of each tissue based on the regulon specific score inferred using pySCENIC and by calculating the average expression. |
| Page: 1 |
Top |
Somatic mutation of malignant transformation related genes |
| Annotation of somatic variants for genes involved in malignant transformation |
| Hugo Symbol | Variant Class | Variant Classification | dbSNP RS | HGVSc | HGVSp | HGVSp Short | SWISSPROT | BIOTYPE | SIFT | PolyPhen | Tumor Sample Barcode | Tissue | Histology | Sex | Age | Stage | Therapy Types | Drugs | Outcome |
| C12orf56 | SNV | Missense_Mutation | novel | c.424N>A | p.Glu142Lys | p.E142K | Q8IXR9 | protein_coding | tolerated(0.28) | benign(0.204) | TCGA-5L-AAT0-01 | Breast | breast invasive carcinoma | Female | <65 | I/II | Hormone Therapy | tamoxiphen | SD |
| C12orf56 | SNV | Missense_Mutation | c.369N>T | p.Arg123Ser | p.R123S | Q8IXR9 | protein_coding | tolerated(0.22) | benign(0) | TCGA-A8-A0A4-01 | Breast | breast invasive carcinoma | Female | >=65 | I/II | Hormone Therapy | tamoxiphen | CR | |
| C12orf56 | SNV | Missense_Mutation | novel | c.1031N>A | p.Ser344Tyr | p.S344Y | Q8IXR9 | protein_coding | deleterious(0) | benign(0.136) | TCGA-AN-A046-01 | Breast | breast invasive carcinoma | Female | >=65 | I/II | Unknown | Unknown | SD |
| C12orf56 | SNV | Missense_Mutation | novel | c.541C>A | p.Pro181Thr | p.P181T | Q8IXR9 | protein_coding | tolerated(0.19) | benign(0.096) | TCGA-AO-A128-01 | Breast | breast invasive carcinoma | Female | <65 | I/II | Chemotherapy | doxorubicin | SD |
| C12orf56 | SNV | Missense_Mutation | c.1535N>C | p.Lys512Thr | p.K512T | Q8IXR9 | protein_coding | tolerated(0.31) | benign(0.025) | TCGA-BH-A18G-01 | Breast | breast invasive carcinoma | Female | >=65 | I/II | Unknown | Unknown | SD | |
| C12orf56 | SNV | Missense_Mutation | c.350N>C | p.Lys117Thr | p.K117T | Q8IXR9 | protein_coding | tolerated(0.15) | benign(0.023) | TCGA-EW-A1PD-01 | Breast | breast invasive carcinoma | Male | <65 | I/II | Chemotherapy | docetaxel | SD | |
| C12orf56 | SNV | Missense_Mutation | novel | c.346N>G | p.Cys116Gly | p.C116G | Q8IXR9 | protein_coding | tolerated(0.37) | benign(0) | TCGA-EW-A3U0-01 | Breast | breast invasive carcinoma | Female | <65 | III/IV | Chemotherapy | cisplatin | CR |
| C12orf56 | SNV | Missense_Mutation | novel | c.515N>T | p.Ser172Phe | p.S172F | Q8IXR9 | protein_coding | tolerated(0.71) | probably_damaging(0.984) | TCGA-OL-A5RW-01 | Breast | breast invasive carcinoma | Female | <65 | I/II | Chemotherapy | adriamycin | CR |
| C12orf56 | insertion | Frame_Shift_Ins | novel | c.168_169insCACCAAAAGTACAAAAATTACCCAG | p.Asp57HisfsTer35 | p.D57Hfs*35 | Q8IXR9 | protein_coding | TCGA-A8-A08H-01 | Breast | breast invasive carcinoma | Female | >=65 | I/II | Unknown | Unknown | SD | ||
| C12orf56 | insertion | Nonsense_Mutation | novel | c.33_34insGAGACTTAGGTAACCTAGCAAGACACCGTCTCTACAAAA | p.Ala11_Arg12insGluThrTerValThrTerGlnAspThrValSerThrLys | p.A11_R12insET*VT*QDTVSTK | Q8IXR9 | protein_coding | TCGA-BH-A0H7-01 | Breast | breast invasive carcinoma | Female | >=65 | III/IV | Chemotherapy | doxorubicin | SD |
| Page: 1 2 3 4 5 6 |
Top |
Related drugs of malignant transformation related genes |
| Identification of chemicals and drugs interact with genes involved in malignant transfromation |
| (DGIdb 4.0) |
| Entrez ID | Symbol | Category | Interaction Types | Drug Claim Name | Drug Name | PMIDs |
| Page: 1 |

Copyright 2023-Present -The University of Texas Health Science Center at Houston |