
|
|||||
|
 | |
| |
| |
| |
| |
| |
|
Gene: C12orf54 |
Gene summary for C12ORF54 |
| Gene information | Species | Human | Gene symbol | C12orf54 | Gene ID | 121273 |
| Gene name | chromosome 12 open reading frame 54 | |
| Gene Alias | HSD-29 | |
| Cytomap | 12q13.11 | |
| Gene Type | protein-coding | GO ID | NA | UniProtAcc | A0A024R0Z1 |
Top |
Malignant transformation analysis |
| Identification of the aberrant gene expression in precancerous and cancerous lesions by comparing the gene expression of stem-like cells in diseased tissues with normal stem cells |
| Entrez ID | Symbol | Replicates | Species | Organ | Tissue | Adj P-value | Log2FC | Malignancy |
| 121273 | C12orf54 | C04 | Human | Oral cavity | OSCC | 2.97e-11 | 6.88e-01 | 0.2633 |
| 121273 | C12orf54 | C21 | Human | Oral cavity | OSCC | 9.13e-27 | 6.86e-01 | 0.2678 |
| 121273 | C12orf54 | C30 | Human | Oral cavity | OSCC | 9.31e-07 | 4.06e-01 | 0.3055 |
| 121273 | C12orf54 | C43 | Human | Oral cavity | OSCC | 6.05e-06 | 1.95e-01 | 0.1704 |
| 121273 | C12orf54 | C46 | Human | Oral cavity | OSCC | 4.45e-12 | 2.72e-01 | 0.1673 |
| 121273 | C12orf54 | C51 | Human | Oral cavity | OSCC | 1.03e-06 | 4.06e-01 | 0.2674 |
| 121273 | C12orf54 | C57 | Human | Oral cavity | OSCC | 4.50e-06 | 2.60e-01 | 0.1679 |
| 121273 | C12orf54 | C06 | Human | Oral cavity | OSCC | 6.48e-03 | 3.90e-01 | 0.2699 |
| 121273 | C12orf54 | LN22 | Human | Oral cavity | OSCC | 8.32e-13 | 7.99e-01 | 0.1733 |
| 121273 | C12orf54 | LN46 | Human | Oral cavity | OSCC | 2.71e-04 | 2.23e-01 | 0.1666 |
| 121273 | C12orf54 | LP15 | Human | Oral cavity | LP | 2.33e-06 | 7.28e-01 | 0.2174 |
| 121273 | C12orf54 | SYSMH1 | Human | Oral cavity | OSCC | 4.33e-07 | 1.64e-01 | 0.1127 |
| 121273 | C12orf54 | SYSMH2 | Human | Oral cavity | OSCC | 6.13e-04 | 1.25e-01 | 0.2326 |
| 121273 | C12orf54 | SYSMH3 | Human | Oral cavity | OSCC | 1.49e-05 | 1.92e-01 | 0.2442 |
| Page: 1 |
| Tissue | Expression Dynamics | Abbreviation |
| Oral Cavity | 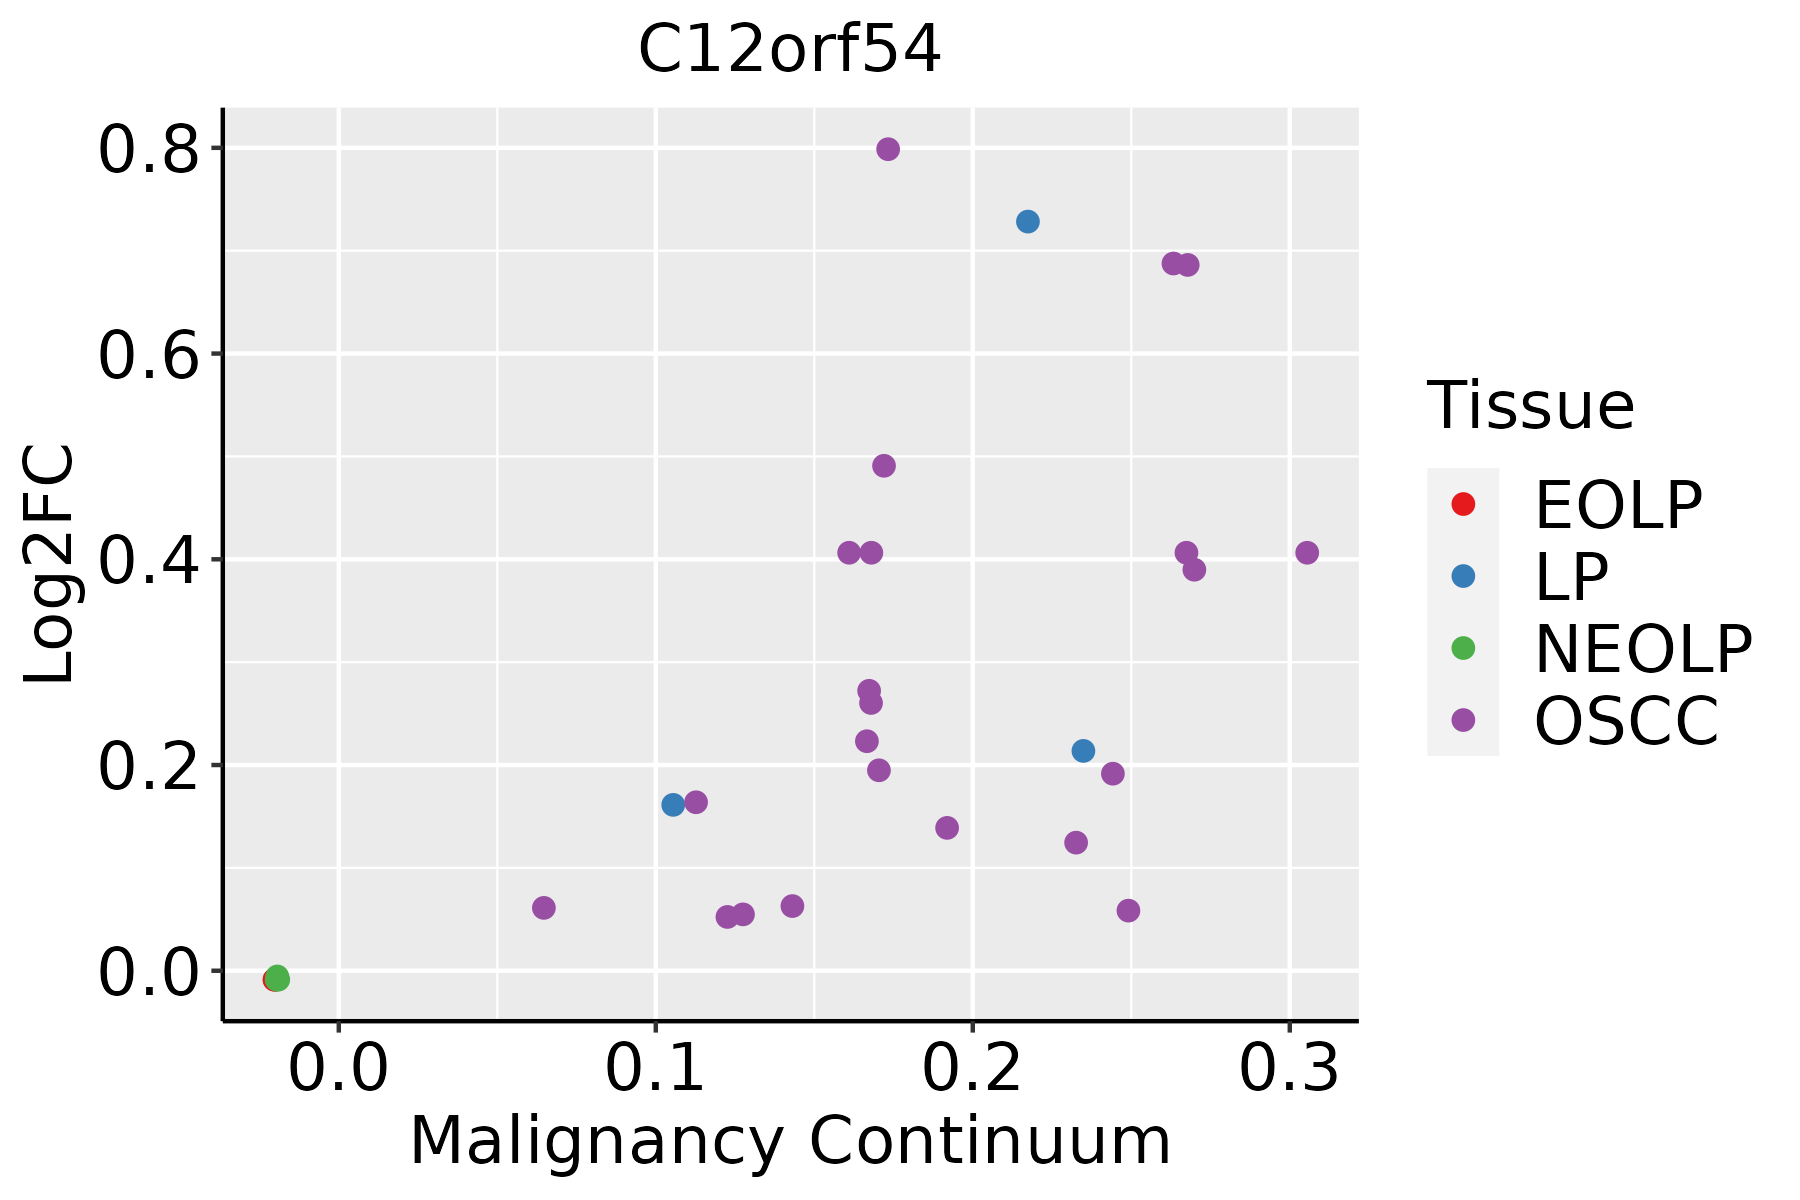 | EOLP: Erosive Oral lichen planus |
| LP: leukoplakia | ||
| NEOLP: Non-erosive oral lichen planus | ||
| OSCC: Oral squamous cell carcinoma |
| ∗log2FC in expression of this searched gene in stem-like cells from each diseased tissue sample relative to stem-like cells in normal samples in each tissue plotted against the malignancy continuum. Samples are colored based on if they are from different disease stage. |
Top |
Malignant transformation related pathway analysis |
| Find out the enriched GO biological processes and KEGG pathways involved in transition from healthy to precancer to cancer |
| Tissue | Disease Stage | Enriched GO biological Processes |
| Colorectum | AD |  |
| Colorectum | SER |  |
| Colorectum | MSS |  |
| Colorectum | MSI-H |  |
| Colorectum | FAP |  |
| ∗Top 15 enriched GO BP terms are showed in the bar plot of each disease state in each tissue. Each row represents a significant GO biological process which is colored according to the -log10(p.adjust). |
| Page: 1 2 3 4 5 6 7 8 9 |
| GO ID | Tissue | Disease Stage | Description | Gene Ratio | Bg Ratio | pvalue | p.adjust | Count |
| Page: 1 |
| Pathway ID | Tissue | Disease Stage | Description | Gene Ratio | Bg Ratio | pvalue | p.adjust | qvalue | Count |
| Page: 1 |
Top |
Cell-cell communication analysis |
| Identification of potential cell-cell interactions between two cell types and their ligand-receptor pairs for different disease states |
| Ligand | Receptor | LRpair | Pathway | Tissue | Disease Stage |
| Page: 1 |
Top |
Single-cell gene regulatory network inference analysis |
| Find out the significant the regulons (TFs) and the target genes of each regulon across cell types for different disease states |
| TF | Cell Type | Tissue | Disease Stage | Target Gene | RSS | Regulon Activity |
| ∗The dot plots of a searched regulon are shown for all cell subpopulations in each disease state of each tissue based on the regulon specific score inferred using pySCENIC and by calculating the average expression. |
| Page: 1 |
Top |
Somatic mutation of malignant transformation related genes |
| Annotation of somatic variants for genes involved in malignant transformation |
| Hugo Symbol | Variant Class | Variant Classification | dbSNP RS | HGVSc | HGVSp | HGVSp Short | SWISSPROT | BIOTYPE | SIFT | PolyPhen | Tumor Sample Barcode | Tissue | Histology | Sex | Age | Stage | Therapy Types | Drugs | Outcome |
| C12orf54 | SNV | Missense_Mutation | rs755348383 | c.198G>C | p.Met66Ile | p.M66I | Q6X4T0 | protein_coding | tolerated(0.08) | probably_damaging(0.996) | TCGA-AN-A0XW-01 | Breast | breast invasive carcinoma | Female | <65 | III/IV | Unknown | Unknown | SD |
| C12orf54 | SNV | Missense_Mutation | novel | c.59N>G | p.Gln20Arg | p.Q20R | Q6X4T0 | protein_coding | tolerated(0.16) | benign(0.106) | TCGA-VS-A8EC-01 | Cervix | cervical & endocervical cancer | Female | <65 | III/IV | Chemotherapy | carboplatin | CR |
| C12orf54 | SNV | Missense_Mutation | c.134N>T | p.Gln45Leu | p.Q45L | Q6X4T0 | protein_coding | deleterious(0) | probably_damaging(0.948) | TCGA-AA-3678-01 | Colorectum | colon adenocarcinoma | Female | <65 | III/IV | Chemotherapy | folinic | CR | |
| C12orf54 | SNV | Missense_Mutation | novel | c.214N>G | p.Thr72Ala | p.T72A | Q6X4T0 | protein_coding | tolerated(0.1) | benign(0.077) | TCGA-AA-3984-01 | Colorectum | colon adenocarcinoma | Female | <65 | I/II | Unknown | Unknown | SD |
| C12orf54 | SNV | Missense_Mutation | c.280N>G | p.Leu94Val | p.L94V | Q6X4T0 | protein_coding | tolerated(0.38) | benign(0.112) | TCGA-AG-3892-01 | Colorectum | rectum adenocarcinoma | Female | <65 | I/II | Unknown | Unknown | SD | |
| C12orf54 | SNV | Missense_Mutation | c.323N>A | p.Gly108Asp | p.G108D | Q6X4T0 | protein_coding | tolerated(0.28) | benign(0.025) | TCGA-AX-A0J0-01 | Endometrium | uterine corpus endometrioid carcinoma | Female | <65 | I/II | Unknown | Unknown | SD | |
| C12orf54 | SNV | Missense_Mutation | novel | c.254N>A | p.Pro85His | p.P85H | Q6X4T0 | protein_coding | tolerated(0.06) | possibly_damaging(0.646) | TCGA-AX-A1CE-01 | Endometrium | uterine corpus endometrioid carcinoma | Female | <65 | I/II | Unspecific | Paclitaxel | SD |
| C12orf54 | SNV | Missense_Mutation | c.248N>C | p.Ile83Thr | p.I83T | Q6X4T0 | protein_coding | tolerated(0.29) | benign(0) | TCGA-D1-A174-01 | Endometrium | uterine corpus endometrioid carcinoma | Female | <65 | I/II | Unknown | Unknown | SD | |
| C12orf54 | SNV | Missense_Mutation | novel | c.349C>T | p.Leu117Phe | p.L117F | Q6X4T0 | protein_coding | tolerated(0.57) | benign(0.007) | TCGA-EO-A3B0-01 | Endometrium | uterine corpus endometrioid carcinoma | Female | <65 | III/IV | Unknown | Unknown | SD |
| C12orf54 | SNV | Missense_Mutation | novel | c.27N>T | p.Gln9His | p.Q9H | Q6X4T0 | protein_coding | deleterious_low_confidence(0) | benign(0.106) | TCGA-FI-A2EY-01 | Endometrium | uterine corpus endometrioid carcinoma | Female | <65 | III/IV | Chemotherapy | carboplatinum | PD |
| Page: 1 2 |
Top |
Related drugs of malignant transformation related genes |
| Identification of chemicals and drugs interact with genes involved in malignant transfromation |
| (DGIdb 4.0) |
| Entrez ID | Symbol | Category | Interaction Types | Drug Claim Name | Drug Name | PMIDs |
| Page: 1 |

Copyright 2023-Present -The University of Texas Health Science Center at Houston |