
|
|||||
|
 | |
| |
| |
| |
| |
| |
|
Gene: C12orf49 |
Gene summary for C12ORF49 |
| Gene information | Species | Human | Gene symbol | C12orf49 | Gene ID | 79794 |
| Gene name | SREBF pathway regulator in golgi 1 | |
| Gene Alias | C12orf49 | |
| Cytomap | 12q24.22 | |
| Gene Type | protein-coding | GO ID | GO:0006950 | UniProtAcc | A0A024RBQ8 |
Top |
Malignant transformation analysis |
| Identification of the aberrant gene expression in precancerous and cancerous lesions by comparing the gene expression of stem-like cells in diseased tissues with normal stem cells |
| Entrez ID | Symbol | Replicates | Species | Organ | Tissue | Adj P-value | Log2FC | Malignancy |
| 79794 | C12orf49 | LZE24T | Human | Esophagus | ESCC | 8.80e-06 | 1.22e-01 | 0.0596 |
| 79794 | C12orf49 | P1T-E | Human | Esophagus | ESCC | 4.72e-04 | 2.44e-01 | 0.0875 |
| 79794 | C12orf49 | P2T-E | Human | Esophagus | ESCC | 4.09e-35 | 5.15e-01 | 0.1177 |
| 79794 | C12orf49 | P4T-E | Human | Esophagus | ESCC | 7.78e-18 | 4.22e-01 | 0.1323 |
| 79794 | C12orf49 | P5T-E | Human | Esophagus | ESCC | 4.12e-18 | 2.33e-01 | 0.1327 |
| 79794 | C12orf49 | P8T-E | Human | Esophagus | ESCC | 3.81e-15 | 3.09e-01 | 0.0889 |
| 79794 | C12orf49 | P9T-E | Human | Esophagus | ESCC | 1.59e-05 | 8.62e-02 | 0.1131 |
| 79794 | C12orf49 | P10T-E | Human | Esophagus | ESCC | 9.31e-16 | 1.22e-01 | 0.116 |
| 79794 | C12orf49 | P12T-E | Human | Esophagus | ESCC | 2.81e-11 | 8.00e-02 | 0.1122 |
| 79794 | C12orf49 | P15T-E | Human | Esophagus | ESCC | 1.79e-07 | 1.05e-01 | 0.1149 |
| 79794 | C12orf49 | P16T-E | Human | Esophagus | ESCC | 6.01e-17 | 1.73e-01 | 0.1153 |
| 79794 | C12orf49 | P17T-E | Human | Esophagus | ESCC | 2.04e-02 | 8.80e-02 | 0.1278 |
| 79794 | C12orf49 | P20T-E | Human | Esophagus | ESCC | 6.91e-12 | 1.45e-01 | 0.1124 |
| 79794 | C12orf49 | P21T-E | Human | Esophagus | ESCC | 2.26e-18 | 2.47e-01 | 0.1617 |
| 79794 | C12orf49 | P22T-E | Human | Esophagus | ESCC | 1.30e-05 | 9.16e-02 | 0.1236 |
| 79794 | C12orf49 | P23T-E | Human | Esophagus | ESCC | 1.95e-11 | 1.93e-01 | 0.108 |
| 79794 | C12orf49 | P24T-E | Human | Esophagus | ESCC | 9.42e-06 | 6.66e-02 | 0.1287 |
| 79794 | C12orf49 | P26T-E | Human | Esophagus | ESCC | 2.78e-14 | 1.90e-01 | 0.1276 |
| 79794 | C12orf49 | P27T-E | Human | Esophagus | ESCC | 4.26e-10 | 1.05e-01 | 0.1055 |
| 79794 | C12orf49 | P28T-E | Human | Esophagus | ESCC | 1.03e-10 | 1.87e-01 | 0.1149 |
| Page: 1 2 3 4 5 |
| Tissue | Expression Dynamics | Abbreviation |
| Esophagus | 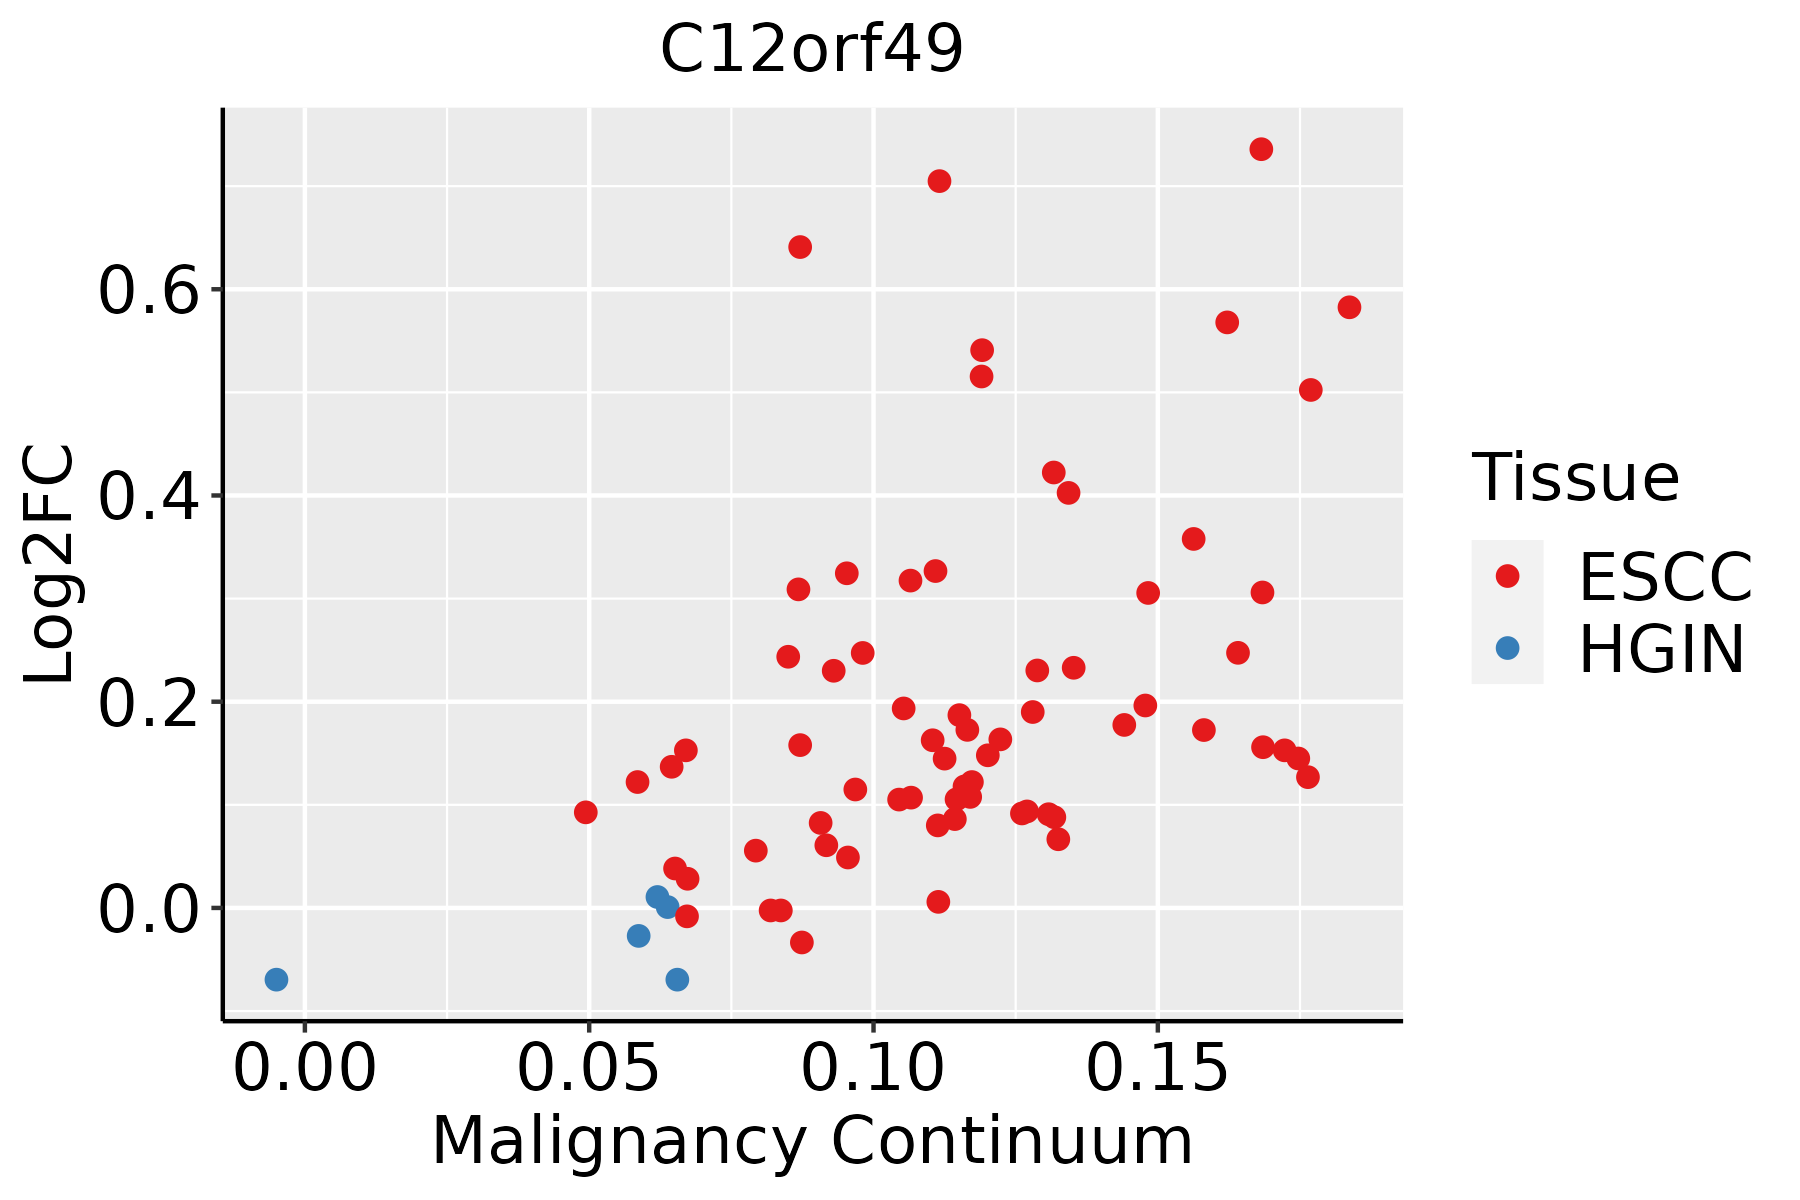 | ESCC: Esophageal squamous cell carcinoma |
| HGIN: High-grade intraepithelial neoplasias | ||
| LGIN: Low-grade intraepithelial neoplasias | ||
| Liver |  | HCC: Hepatocellular carcinoma |
| NAFLD: Non-alcoholic fatty liver disease | ||
| Oral Cavity |  | EOLP: Erosive Oral lichen planus |
| LP: leukoplakia | ||
| NEOLP: Non-erosive oral lichen planus | ||
| OSCC: Oral squamous cell carcinoma | ||
| Thyroid | 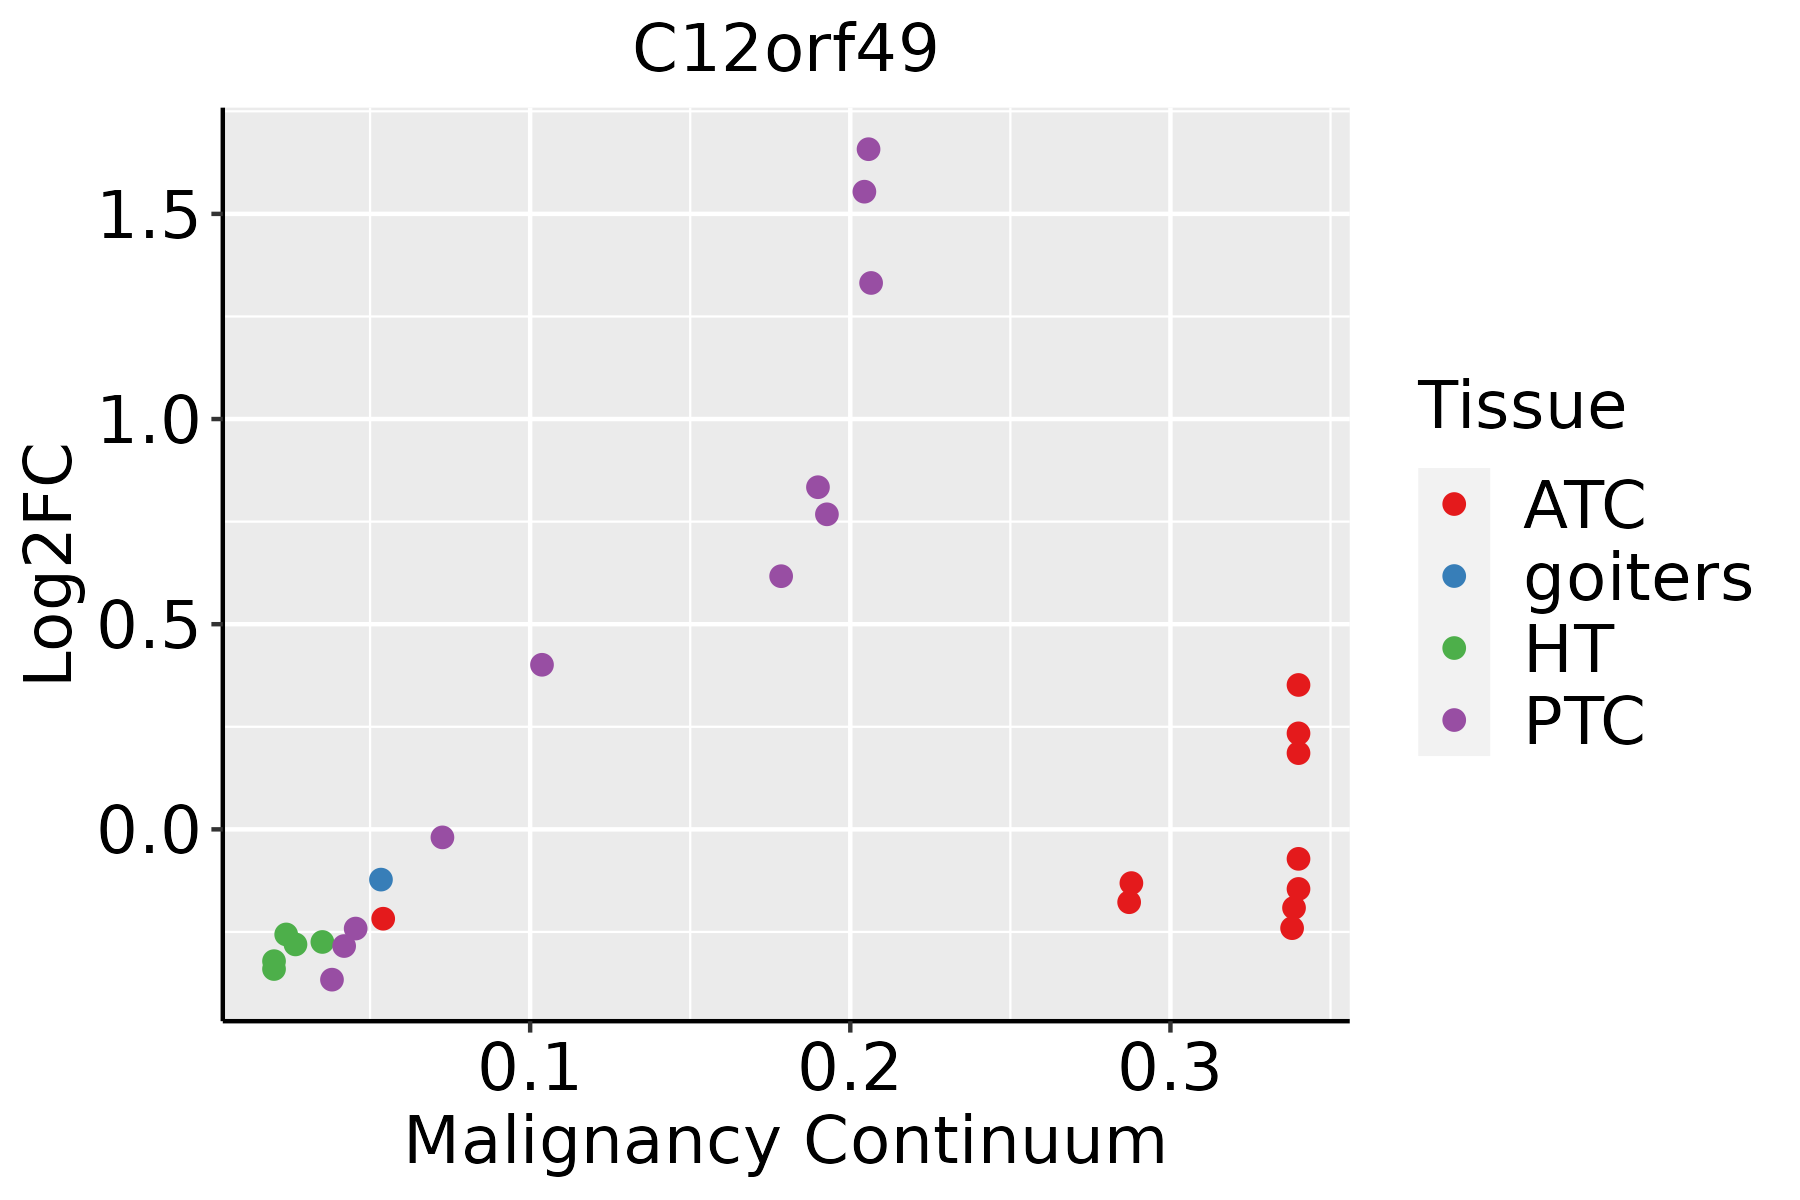 | ATC: Anaplastic thyroid cancer |
| HT: Hashimoto's thyroiditis | ||
| PTC: Papillary thyroid cancer |
| ∗log2FC in expression of this searched gene in stem-like cells from each diseased tissue sample relative to stem-like cells in normal samples in each tissue plotted against the malignancy continuum. Samples are colored based on if they are from different disease stage. |
Top |
Malignant transformation related pathway analysis |
| Find out the enriched GO biological processes and KEGG pathways involved in transition from healthy to precancer to cancer |
| Tissue | Disease Stage | Enriched GO biological Processes |
| Colorectum | AD |  |
| Colorectum | SER |  |
| Colorectum | MSS |  |
| Colorectum | MSI-H |  |
| Colorectum | FAP |  |
| ∗Top 15 enriched GO BP terms are showed in the bar plot of each disease state in each tissue. Each row represents a significant GO biological process which is colored according to the -log10(p.adjust). |
| Page: 1 2 3 4 5 6 7 8 9 |
| GO ID | Tissue | Disease Stage | Description | Gene Ratio | Bg Ratio | pvalue | p.adjust | Count |
| Page: 1 |
| Pathway ID | Tissue | Disease Stage | Description | Gene Ratio | Bg Ratio | pvalue | p.adjust | qvalue | Count |
| Page: 1 |
Top |
Cell-cell communication analysis |
| Identification of potential cell-cell interactions between two cell types and their ligand-receptor pairs for different disease states |
| Ligand | Receptor | LRpair | Pathway | Tissue | Disease Stage |
| Page: 1 |
Top |
Single-cell gene regulatory network inference analysis |
| Find out the significant the regulons (TFs) and the target genes of each regulon across cell types for different disease states |
| TF | Cell Type | Tissue | Disease Stage | Target Gene | RSS | Regulon Activity |
| ∗The dot plots of a searched regulon are shown for all cell subpopulations in each disease state of each tissue based on the regulon specific score inferred using pySCENIC and by calculating the average expression. |
| Page: 1 |
Top |
Somatic mutation of malignant transformation related genes |
| Annotation of somatic variants for genes involved in malignant transformation |
| Hugo Symbol | Variant Class | Variant Classification | dbSNP RS | HGVSc | HGVSp | HGVSp Short | SWISSPROT | BIOTYPE | SIFT | PolyPhen | Tumor Sample Barcode | Tissue | Histology | Sex | Age | Stage | Therapy Types | Drugs | Outcome |
| C12orf49 | SNV | Missense_Mutation | rs201890321 | c.448N>T | p.Arg150Trp | p.R150W | Q9H741 | protein_coding | deleterious(0) | probably_damaging(0.916) | TCGA-EA-A3HS-01 | Cervix | cervical & endocervical cancer | Female | <65 | I/II | Unknown | Unknown | SD |
| C12orf49 | SNV | Missense_Mutation | c.353G>A | p.Gly118Asp | p.G118D | Q9H741 | protein_coding | tolerated(0.15) | possibly_damaging(0.599) | TCGA-AZ-6598-01 | Colorectum | colon adenocarcinoma | Female | >=65 | I/II | Unknown | Unknown | SD | |
| C12orf49 | SNV | Missense_Mutation | c.226N>T | p.Arg76Cys | p.R76C | Q9H741 | protein_coding | deleterious(0) | possibly_damaging(0.877) | TCGA-WS-AB45-01 | Colorectum | colon adenocarcinoma | Female | <65 | I/II | Unknown | Unknown | SD | |
| C12orf49 | insertion | Frame_Shift_Ins | novel | c.293_294insT | p.Leu98PhefsTer8 | p.L98Ffs*8 | Q9H741 | protein_coding | TCGA-AD-6895-01 | Colorectum | colon adenocarcinoma | Male | >=65 | III/IV | Unknown | Unknown | SD | ||
| C12orf49 | SNV | Missense_Mutation | c.119N>T | p.Arg40Met | p.R40M | Q9H741 | protein_coding | tolerated(0.07) | benign(0.436) | TCGA-AP-A051-01 | Endometrium | uterine corpus endometrioid carcinoma | Female | >=65 | I/II | Unknown | Unknown | SD | |
| C12orf49 | SNV | Missense_Mutation | c.368N>T | p.Gly123Val | p.G123V | Q9H741 | protein_coding | deleterious(0) | probably_damaging(1) | TCGA-AP-A059-01 | Endometrium | uterine corpus endometrioid carcinoma | Female | >=65 | I/II | Unknown | Unknown | SD | |
| C12orf49 | SNV | Missense_Mutation | novel | c.491N>G | p.Asp164Gly | p.D164G | Q9H741 | protein_coding | deleterious(0.01) | probably_damaging(0.951) | TCGA-AP-A1DK-01 | Endometrium | uterine corpus endometrioid carcinoma | Female | <65 | I/II | Unknown | Unknown | SD |
| C12orf49 | SNV | Missense_Mutation | c.392N>A | p.Cys131Tyr | p.C131Y | Q9H741 | protein_coding | deleterious(0) | probably_damaging(1) | TCGA-AX-A0J1-01 | Endometrium | uterine corpus endometrioid carcinoma | Female | >=65 | I/II | Unknown | Unknown | SD | |
| C12orf49 | SNV | Missense_Mutation | novel | c.427N>A | p.Leu143Ile | p.L143I | Q9H741 | protein_coding | tolerated(0.08) | possibly_damaging(0.577) | TCGA-B5-A1MR-01 | Endometrium | uterine corpus endometrioid carcinoma | Female | >=65 | III/IV | Unknown | Unknown | SD |
| C12orf49 | SNV | Missense_Mutation | novel | c.68N>C | p.Phe23Ser | p.F23S | Q9H741 | protein_coding | deleterious(0) | possibly_damaging(0.598) | TCGA-BG-A221-01 | Endometrium | uterine corpus endometrioid carcinoma | Female | >=65 | I/II | Unknown | Unknown | SD |
| Page: 1 2 |
Top |
Related drugs of malignant transformation related genes |
| Identification of chemicals and drugs interact with genes involved in malignant transfromation |
| (DGIdb 4.0) |
| Entrez ID | Symbol | Category | Interaction Types | Drug Claim Name | Drug Name | PMIDs |
| Page: 1 |

Copyright 2023-Present -The University of Texas Health Science Center at Houston |