
|
|||||
|
 | |
| |
| |
| |
| |
| |
|
Gene: C12orf43 |
Gene summary for C12ORF43 |
| Gene information | Species | Human | Gene symbol | C12orf43 | Gene ID | 64897 |
| Gene name | chromosome 12 open reading frame 43 | |
| Gene Alias | Custos | |
| Cytomap | 12q24.31 | |
| Gene Type | protein-coding | GO ID | GO:0007154 | UniProtAcc | B4DWJ9 |
Top |
Malignant transformation analysis |
| Identification of the aberrant gene expression in precancerous and cancerous lesions by comparing the gene expression of stem-like cells in diseased tissues with normal stem cells |
| Entrez ID | Symbol | Replicates | Species | Organ | Tissue | Adj P-value | Log2FC | Malignancy |
| 64897 | C12orf43 | LZE4T | Human | Esophagus | ESCC | 2.72e-03 | 1.51e-01 | 0.0811 |
| 64897 | C12orf43 | LZE7T | Human | Esophagus | ESCC | 1.99e-03 | 1.82e-01 | 0.0667 |
| 64897 | C12orf43 | LZE8T | Human | Esophagus | ESCC | 4.89e-04 | 1.58e-01 | 0.067 |
| 64897 | C12orf43 | LZE24T | Human | Esophagus | ESCC | 7.96e-11 | 2.01e-01 | 0.0596 |
| 64897 | C12orf43 | LZE21T | Human | Esophagus | ESCC | 1.72e-02 | 1.99e-01 | 0.0655 |
| 64897 | C12orf43 | LZE6T | Human | Esophagus | ESCC | 1.05e-02 | 1.24e-01 | 0.0845 |
| 64897 | C12orf43 | P2T-E | Human | Esophagus | ESCC | 2.48e-52 | 8.20e-01 | 0.1177 |
| 64897 | C12orf43 | P4T-E | Human | Esophagus | ESCC | 5.96e-20 | 3.78e-01 | 0.1323 |
| 64897 | C12orf43 | P5T-E | Human | Esophagus | ESCC | 6.01e-17 | 3.14e-01 | 0.1327 |
| 64897 | C12orf43 | P8T-E | Human | Esophagus | ESCC | 6.99e-13 | 2.25e-01 | 0.0889 |
| 64897 | C12orf43 | P9T-E | Human | Esophagus | ESCC | 1.28e-03 | 9.69e-02 | 0.1131 |
| 64897 | C12orf43 | P10T-E | Human | Esophagus | ESCC | 6.67e-11 | 1.85e-01 | 0.116 |
| 64897 | C12orf43 | P11T-E | Human | Esophagus | ESCC | 2.42e-07 | 3.17e-01 | 0.1426 |
| 64897 | C12orf43 | P12T-E | Human | Esophagus | ESCC | 5.01e-20 | 2.24e-01 | 0.1122 |
| 64897 | C12orf43 | P15T-E | Human | Esophagus | ESCC | 6.74e-15 | 2.73e-01 | 0.1149 |
| 64897 | C12orf43 | P16T-E | Human | Esophagus | ESCC | 2.71e-23 | 3.97e-01 | 0.1153 |
| 64897 | C12orf43 | P17T-E | Human | Esophagus | ESCC | 7.79e-06 | 2.68e-01 | 0.1278 |
| 64897 | C12orf43 | P19T-E | Human | Esophagus | ESCC | 1.04e-05 | 4.59e-01 | 0.1662 |
| 64897 | C12orf43 | P20T-E | Human | Esophagus | ESCC | 7.72e-10 | 2.12e-01 | 0.1124 |
| 64897 | C12orf43 | P21T-E | Human | Esophagus | ESCC | 1.06e-23 | 3.73e-01 | 0.1617 |
| Page: 1 2 3 4 5 |
| Tissue | Expression Dynamics | Abbreviation |
| Esophagus |  | ESCC: Esophageal squamous cell carcinoma |
| HGIN: High-grade intraepithelial neoplasias | ||
| LGIN: Low-grade intraepithelial neoplasias | ||
| Liver | 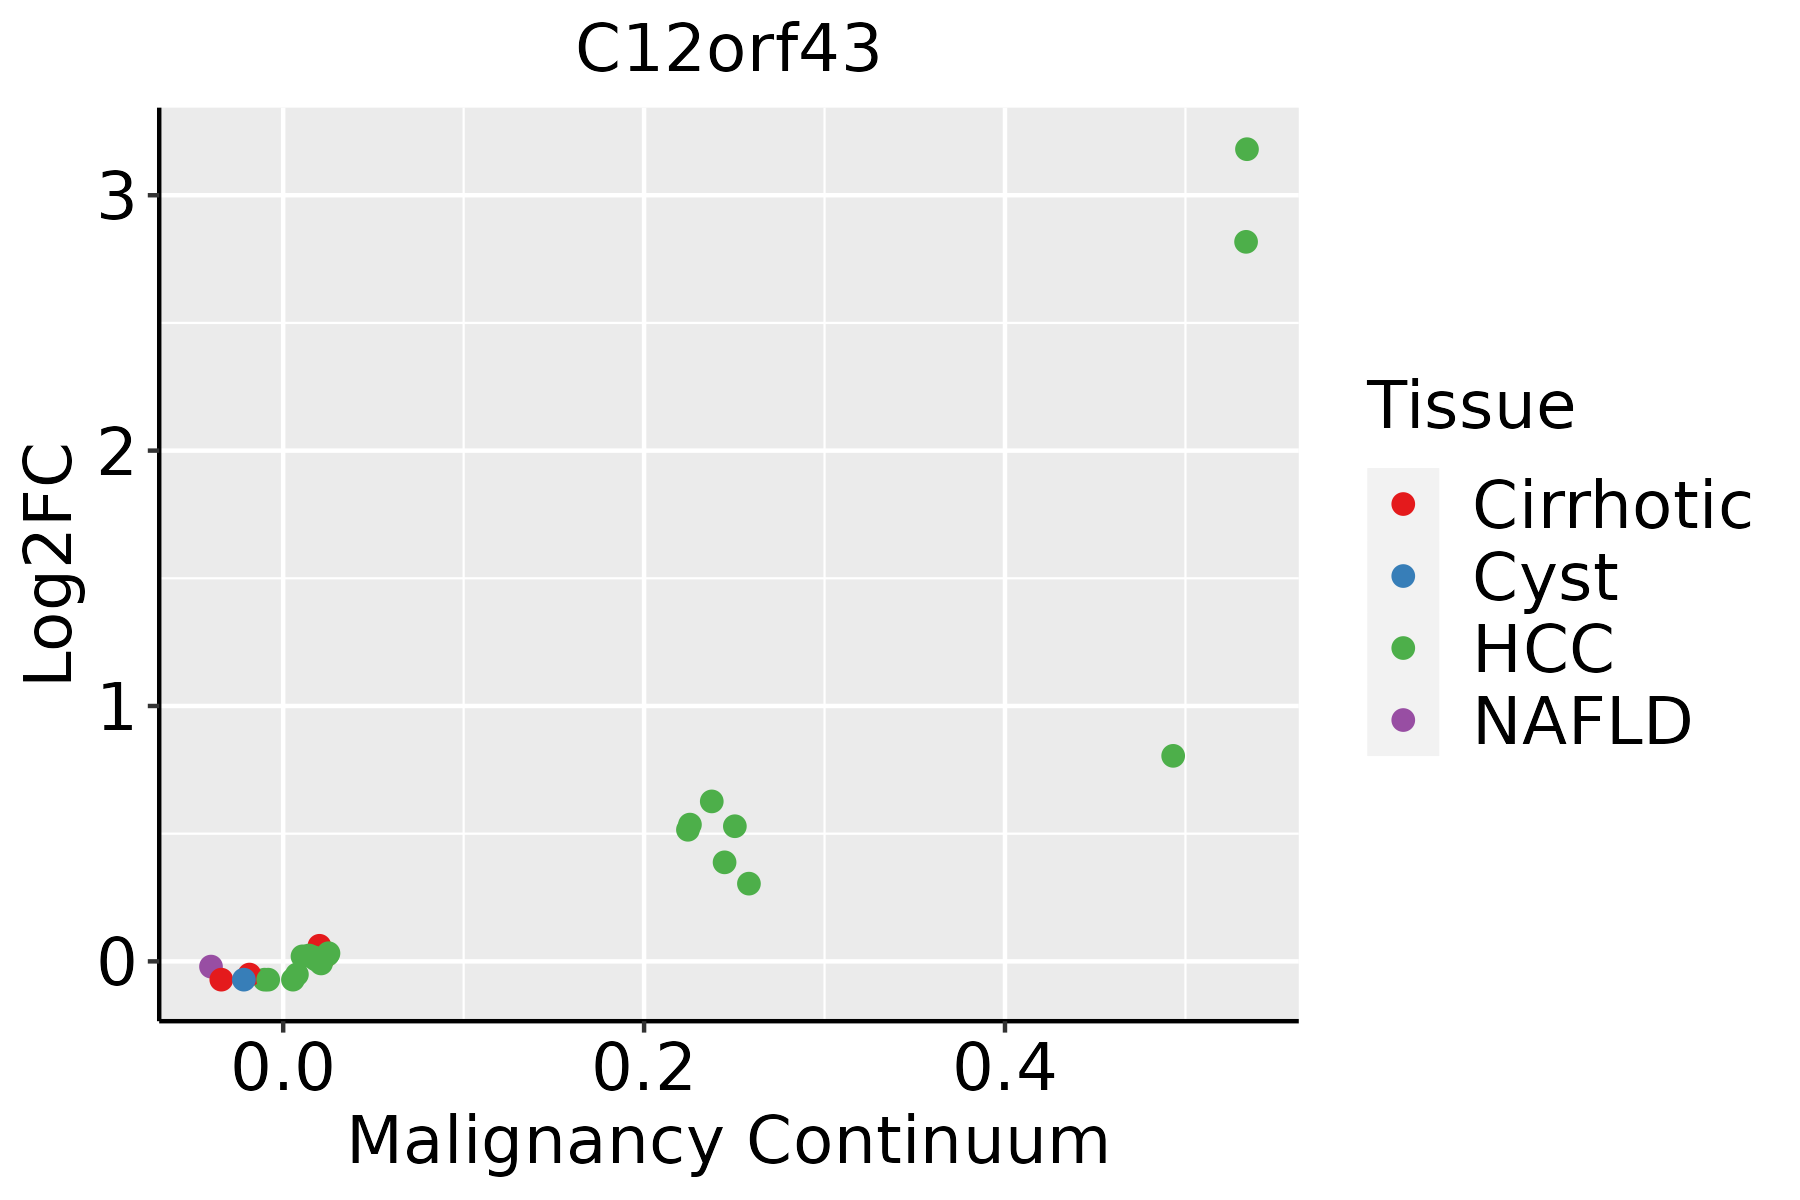 | HCC: Hepatocellular carcinoma |
| NAFLD: Non-alcoholic fatty liver disease | ||
| Oral Cavity |  | EOLP: Erosive Oral lichen planus |
| LP: leukoplakia | ||
| NEOLP: Non-erosive oral lichen planus | ||
| OSCC: Oral squamous cell carcinoma | ||
| Thyroid |  | ATC: Anaplastic thyroid cancer |
| HT: Hashimoto's thyroiditis | ||
| PTC: Papillary thyroid cancer |
| ∗log2FC in expression of this searched gene in stem-like cells from each diseased tissue sample relative to stem-like cells in normal samples in each tissue plotted against the malignancy continuum. Samples are colored based on if they are from different disease stage. |
Top |
Malignant transformation related pathway analysis |
| Find out the enriched GO biological processes and KEGG pathways involved in transition from healthy to precancer to cancer |
| Tissue | Disease Stage | Enriched GO biological Processes |
| Colorectum | AD |  |
| Colorectum | SER |  |
| Colorectum | MSS |  |
| Colorectum | MSI-H |  |
| Colorectum | FAP |  |
| ∗Top 15 enriched GO BP terms are showed in the bar plot of each disease state in each tissue. Each row represents a significant GO biological process which is colored according to the -log10(p.adjust). |
| Page: 1 2 3 4 5 6 7 8 9 |
| GO ID | Tissue | Disease Stage | Description | Gene Ratio | Bg Ratio | pvalue | p.adjust | Count |
| GO:001605517 | Esophagus | ESCC | Wnt signaling pathway | 268/8552 | 444/18723 | 2.32e-10 | 6.58e-09 | 268 |
| GO:019873817 | Esophagus | ESCC | cell-cell signaling by wnt | 269/8552 | 446/18723 | 2.41e-10 | 6.79e-09 | 269 |
| GO:003011117 | Esophagus | ESCC | regulation of Wnt signaling pathway | 194/8552 | 328/18723 | 5.39e-07 | 7.14e-06 | 194 |
| GO:00301788 | Esophagus | ESCC | negative regulation of Wnt signaling pathway | 97/8552 | 170/18723 | 1.81e-03 | 8.31e-03 | 97 |
| GO:001605511 | Liver | Cirrhotic | Wnt signaling pathway | 150/4634 | 444/18723 | 9.75e-06 | 1.42e-04 | 150 |
| GO:019873811 | Liver | Cirrhotic | cell-cell signaling by wnt | 150/4634 | 446/18723 | 1.28e-05 | 1.80e-04 | 150 |
| GO:003011111 | Liver | Cirrhotic | regulation of Wnt signaling pathway | 112/4634 | 328/18723 | 7.57e-05 | 8.40e-04 | 112 |
| GO:019873821 | Liver | HCC | cell-cell signaling by wnt | 247/7958 | 446/18723 | 2.11e-08 | 4.96e-07 | 247 |
| GO:001605521 | Liver | HCC | Wnt signaling pathway | 245/7958 | 444/18723 | 3.68e-08 | 8.09e-07 | 245 |
| GO:003011121 | Liver | HCC | regulation of Wnt signaling pathway | 180/7958 | 328/18723 | 3.62e-06 | 4.72e-05 | 180 |
| GO:001605510 | Oral cavity | OSCC | Wnt signaling pathway | 227/7305 | 444/18723 | 1.10e-07 | 1.87e-06 | 227 |
| GO:019873810 | Oral cavity | OSCC | cell-cell signaling by wnt | 227/7305 | 446/18723 | 1.75e-07 | 2.86e-06 | 227 |
| GO:003011110 | Oral cavity | OSCC | regulation of Wnt signaling pathway | 165/7305 | 328/18723 | 1.87e-05 | 1.80e-04 | 165 |
| GO:001605515 | Oral cavity | LP | Wnt signaling pathway | 140/4623 | 444/18723 | 5.80e-04 | 5.35e-03 | 140 |
| GO:019873815 | Oral cavity | LP | cell-cell signaling by wnt | 140/4623 | 446/18723 | 7.12e-04 | 6.38e-03 | 140 |
| GO:003011115 | Oral cavity | LP | regulation of Wnt signaling pathway | 103/4623 | 328/18723 | 3.29e-03 | 2.21e-02 | 103 |
| GO:0016055110 | Thyroid | PTC | Wnt signaling pathway | 217/5968 | 444/18723 | 3.71e-14 | 2.30e-12 | 217 |
| GO:0198738110 | Thyroid | PTC | cell-cell signaling by wnt | 217/5968 | 446/18723 | 6.68e-14 | 3.73e-12 | 217 |
| GO:0030111110 | Thyroid | PTC | regulation of Wnt signaling pathway | 163/5968 | 328/18723 | 1.05e-11 | 4.29e-10 | 163 |
| GO:003017810 | Thyroid | PTC | negative regulation of Wnt signaling pathway | 74/5968 | 170/18723 | 8.99e-04 | 5.48e-03 | 74 |
| Page: 1 2 |
| Pathway ID | Tissue | Disease Stage | Description | Gene Ratio | Bg Ratio | pvalue | p.adjust | qvalue | Count |
| Page: 1 |
Top |
Cell-cell communication analysis |
| Identification of potential cell-cell interactions between two cell types and their ligand-receptor pairs for different disease states |
| Ligand | Receptor | LRpair | Pathway | Tissue | Disease Stage |
| Page: 1 |
Top |
Single-cell gene regulatory network inference analysis |
| Find out the significant the regulons (TFs) and the target genes of each regulon across cell types for different disease states |
| TF | Cell Type | Tissue | Disease Stage | Target Gene | RSS | Regulon Activity |
| ∗The dot plots of a searched regulon are shown for all cell subpopulations in each disease state of each tissue based on the regulon specific score inferred using pySCENIC and by calculating the average expression. |
| Page: 1 |
Top |
Somatic mutation of malignant transformation related genes |
| Annotation of somatic variants for genes involved in malignant transformation |
| Hugo Symbol | Variant Class | Variant Classification | dbSNP RS | HGVSc | HGVSp | HGVSp Short | SWISSPROT | BIOTYPE | SIFT | PolyPhen | Tumor Sample Barcode | Tissue | Histology | Sex | Age | Stage | Therapy Types | Drugs | Outcome |
| C12orf43 | SNV | Missense_Mutation | c.385N>T | p.Ile129Phe | p.I129F | protein_coding | deleterious(0) | possibly_damaging(0.886) | TCGA-BI-A20A-01 | Cervix | cervical & endocervical cancer | Female | <65 | I/II | Unknown | Unknown | SD | ||
| C12orf43 | SNV | Missense_Mutation | c.82N>C | p.Glu28Gln | p.E28Q | protein_coding | deleterious(0.02) | possibly_damaging(0.626) | TCGA-DR-A0ZM-01 | Cervix | cervical & endocervical cancer | Female | <65 | III/IV | Unspecific | Cisplatin | SD | ||
| C12orf43 | SNV | Missense_Mutation | c.82G>C | p.Glu28Gln | p.E28Q | protein_coding | deleterious(0.02) | possibly_damaging(0.626) | TCGA-EK-A2H0-01 | Cervix | cervical & endocervical cancer | Female | <65 | I/II | Chemotherapy | cisplatin | CR | ||
| C12orf43 | SNV | Missense_Mutation | c.82G>A | p.Glu28Lys | p.E28K | protein_coding | deleterious(0.04) | benign(0.02) | TCGA-JX-A3Q0-01 | Cervix | cervical & endocervical cancer | Female | <65 | III/IV | Unknown | Unknown | SD | ||
| C12orf43 | SNV | Missense_Mutation | c.82G>A | p.Glu28Lys | p.E28K | protein_coding | deleterious(0.04) | benign(0.02) | TCGA-VS-A8QC-01 | Cervix | cervical & endocervical cancer | Female | <65 | I/II | Chemotherapy | paclitaxel | PD | ||
| C12orf43 | SNV | Missense_Mutation | c.82G>C | p.Glu28Gln | p.E28Q | protein_coding | deleterious(0.02) | possibly_damaging(0.626) | TCGA-ZJ-A8QQ-01 | Cervix | cervical & endocervical cancer | Female | <65 | I/II | Chemotherapy | cisplatin | SD | ||
| C12orf43 | SNV | Missense_Mutation | c.746N>A | p.Val249Asp | p.V249D | protein_coding | tolerated_low_confidence(0.56) | possibly_damaging(0.854) | TCGA-AZ-6601-01 | Colorectum | colon adenocarcinoma | Male | >=65 | I/II | Unknown | Unknown | PD | ||
| C12orf43 | SNV | Missense_Mutation | c.807N>T | p.Lys269Asn | p.K269N | protein_coding | deleterious(0) | probably_damaging(0.998) | TCGA-CA-6718-01 | Colorectum | colon adenocarcinoma | Male | <65 | I/II | Unknown | Unknown | PD | ||
| C12orf43 | SNV | Missense_Mutation | c.94N>T | p.Pro32Ser | p.P32S | protein_coding | deleterious(0.02) | possibly_damaging(0.57) | TCGA-AG-3742-01 | Colorectum | rectum adenocarcinoma | Female | >=65 | I/II | Unknown | Unknown | SD | ||
| C12orf43 | insertion | In_Frame_Ins | novel | c.569_570insAGTGGC | p.Arg190_Arg191insValAla | p.R190_R191insVA | protein_coding | TCGA-AH-6544-01 | Colorectum | rectum adenocarcinoma | Male | <65 | III/IV | Chemotherapy | oxaliplatin | SD |
| Page: 1 2 3 |
Top |
Related drugs of malignant transformation related genes |
| Identification of chemicals and drugs interact with genes involved in malignant transfromation |
| (DGIdb 4.0) |
| Entrez ID | Symbol | Category | Interaction Types | Drug Claim Name | Drug Name | PMIDs |
| Page: 1 |

Copyright 2023-Present -The University of Texas Health Science Center at Houston |