
|
|||||
|
 | |
| |
| |
| |
| |
| |
|
Gene: C12orf29 |
Gene summary for C12ORF29 |
| Gene information | Species | Human | Gene symbol | C12orf29 | Gene ID | 91298 |
| Gene name | chromosome 12 open reading frame 29 | |
| Gene Alias | C12orf29 | |
| Cytomap | 12q21.32 | |
| Gene Type | protein-coding | GO ID | GO:0002244 | UniProtAcc | Q8N999 |
Top |
Malignant transformation analysis |
| Identification of the aberrant gene expression in precancerous and cancerous lesions by comparing the gene expression of stem-like cells in diseased tissues with normal stem cells |
| Entrez ID | Symbol | Replicates | Species | Organ | Tissue | Adj P-value | Log2FC | Malignancy |
| 91298 | C12orf29 | LZE4T | Human | Esophagus | ESCC | 1.23e-02 | 9.39e-02 | 0.0811 |
| 91298 | C12orf29 | LZE7T | Human | Esophagus | ESCC | 7.17e-03 | 2.12e-01 | 0.0667 |
| 91298 | C12orf29 | LZE24T | Human | Esophagus | ESCC | 2.64e-10 | 2.78e-01 | 0.0596 |
| 91298 | C12orf29 | LZE21T | Human | Esophagus | ESCC | 9.09e-04 | 1.88e-01 | 0.0655 |
| 91298 | C12orf29 | LZE6T | Human | Esophagus | ESCC | 1.25e-06 | 2.07e-01 | 0.0845 |
| 91298 | C12orf29 | P1T-E | Human | Esophagus | ESCC | 2.90e-05 | 4.06e-01 | 0.0875 |
| 91298 | C12orf29 | P2T-E | Human | Esophagus | ESCC | 1.75e-26 | 5.61e-01 | 0.1177 |
| 91298 | C12orf29 | P4T-E | Human | Esophagus | ESCC | 2.81e-18 | 4.66e-01 | 0.1323 |
| 91298 | C12orf29 | P5T-E | Human | Esophagus | ESCC | 6.39e-19 | 3.25e-01 | 0.1327 |
| 91298 | C12orf29 | P8T-E | Human | Esophagus | ESCC | 3.06e-20 | 3.20e-01 | 0.0889 |
| 91298 | C12orf29 | P9T-E | Human | Esophagus | ESCC | 6.19e-10 | 1.71e-01 | 0.1131 |
| 91298 | C12orf29 | P10T-E | Human | Esophagus | ESCC | 8.83e-24 | 4.80e-01 | 0.116 |
| 91298 | C12orf29 | P11T-E | Human | Esophagus | ESCC | 6.85e-07 | 3.52e-01 | 0.1426 |
| 91298 | C12orf29 | P12T-E | Human | Esophagus | ESCC | 7.11e-16 | 3.00e-01 | 0.1122 |
| 91298 | C12orf29 | P15T-E | Human | Esophagus | ESCC | 3.64e-18 | 2.11e-01 | 0.1149 |
| 91298 | C12orf29 | P16T-E | Human | Esophagus | ESCC | 4.37e-22 | 3.30e-01 | 0.1153 |
| 91298 | C12orf29 | P17T-E | Human | Esophagus | ESCC | 1.28e-09 | 2.55e-01 | 0.1278 |
| 91298 | C12orf29 | P19T-E | Human | Esophagus | ESCC | 4.21e-08 | 5.60e-01 | 0.1662 |
| 91298 | C12orf29 | P20T-E | Human | Esophagus | ESCC | 1.38e-22 | 3.69e-01 | 0.1124 |
| 91298 | C12orf29 | P21T-E | Human | Esophagus | ESCC | 3.69e-23 | 5.44e-01 | 0.1617 |
| Page: 1 2 3 4 5 |
| Tissue | Expression Dynamics | Abbreviation |
| Esophagus | 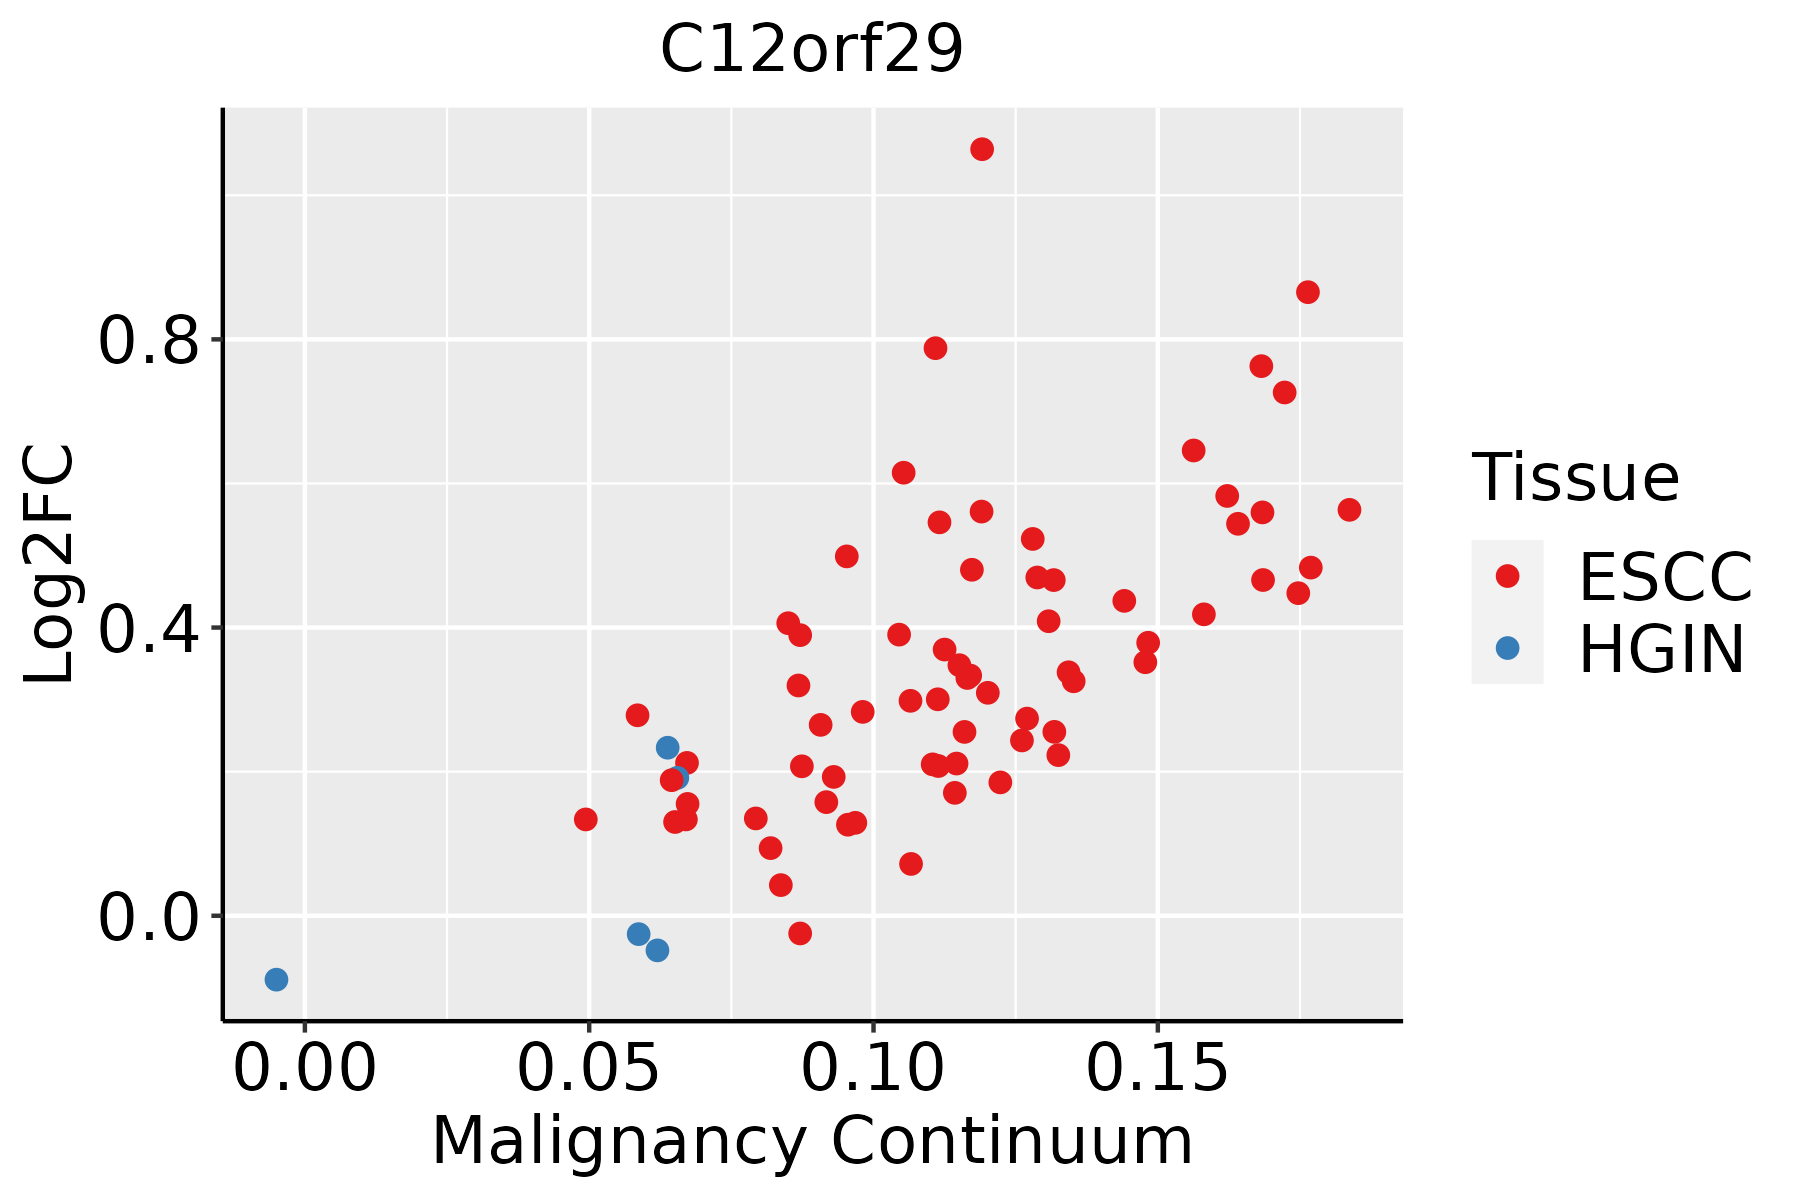 | ESCC: Esophageal squamous cell carcinoma |
| HGIN: High-grade intraepithelial neoplasias | ||
| LGIN: Low-grade intraepithelial neoplasias | ||
| Oral Cavity |  | EOLP: Erosive Oral lichen planus |
| LP: leukoplakia | ||
| NEOLP: Non-erosive oral lichen planus | ||
| OSCC: Oral squamous cell carcinoma | ||
| Skin | 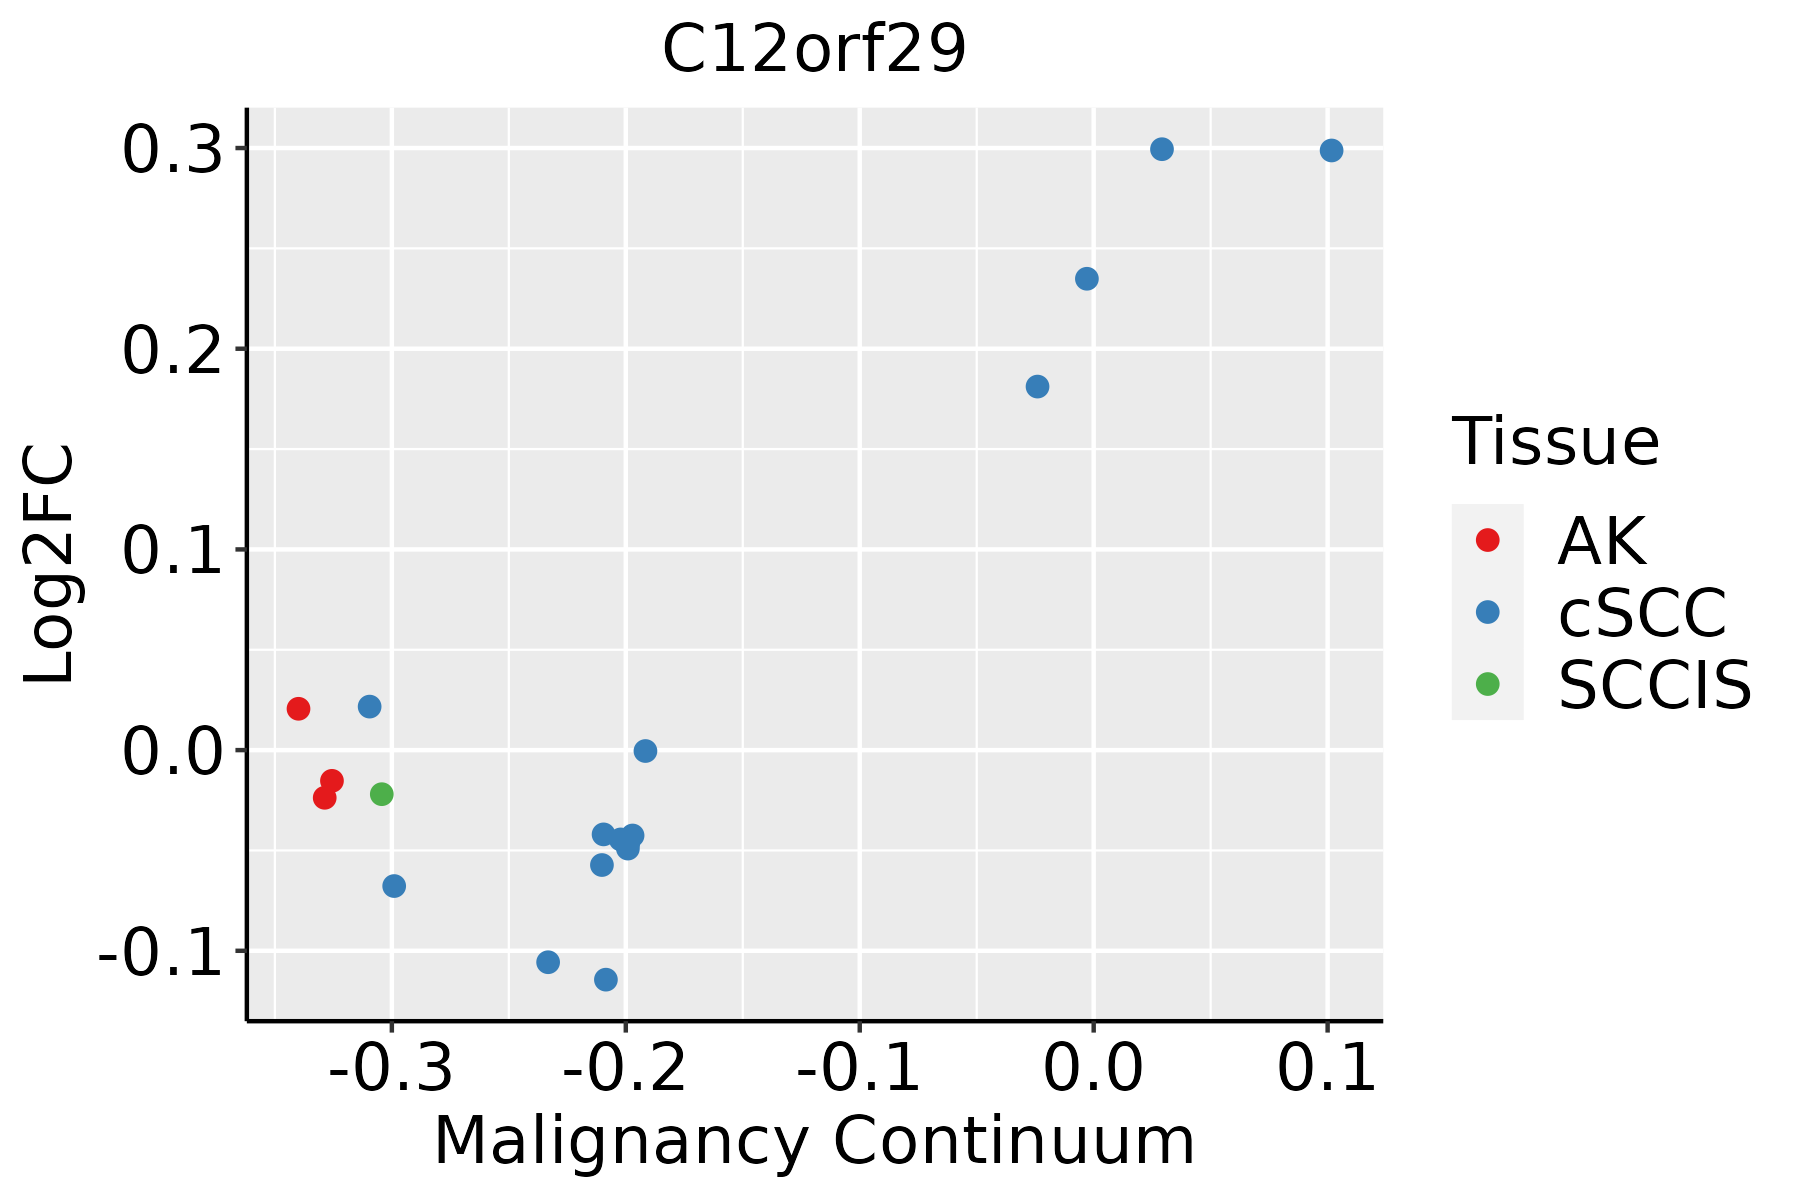 | AK: Actinic keratosis |
| cSCC: Cutaneous squamous cell carcinoma | ||
| SCCIS:squamous cell carcinoma in situ | ||
| Thyroid | 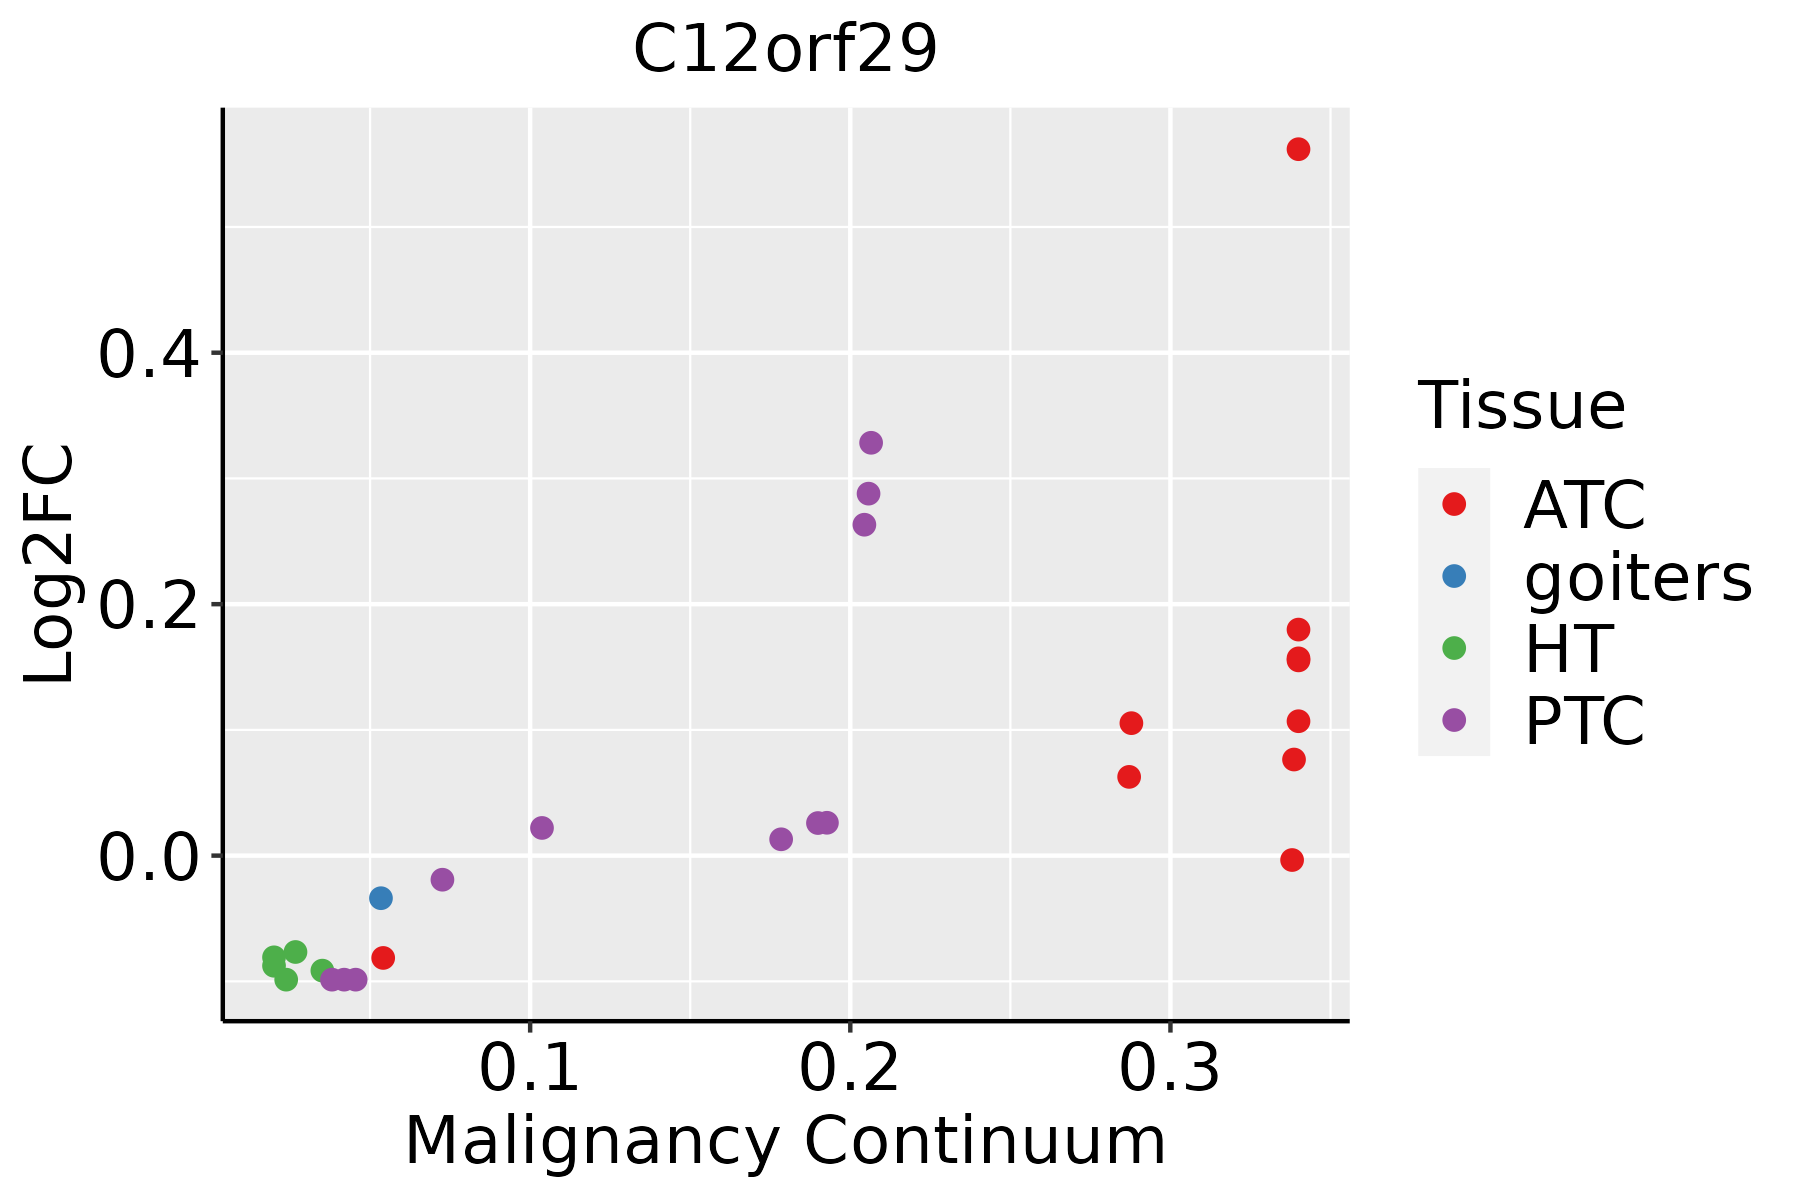 | ATC: Anaplastic thyroid cancer |
| HT: Hashimoto's thyroiditis | ||
| PTC: Papillary thyroid cancer |
| ∗log2FC in expression of this searched gene in stem-like cells from each diseased tissue sample relative to stem-like cells in normal samples in each tissue plotted against the malignancy continuum. Samples are colored based on if they are from different disease stage. |
Top |
Malignant transformation related pathway analysis |
| Find out the enriched GO biological processes and KEGG pathways involved in transition from healthy to precancer to cancer |
| Tissue | Disease Stage | Enriched GO biological Processes |
| Colorectum | AD |  |
| Colorectum | SER |  |
| Colorectum | MSS |  |
| Colorectum | MSI-H |  |
| Colorectum | FAP |  |
| ∗Top 15 enriched GO BP terms are showed in the bar plot of each disease state in each tissue. Each row represents a significant GO biological process which is colored according to the -log10(p.adjust). |
| Page: 1 2 3 4 5 6 7 8 9 |
| GO ID | Tissue | Disease Stage | Description | Gene Ratio | Bg Ratio | pvalue | p.adjust | Count |
| GO:00022446 | Esophagus | ESCC | hematopoietic progenitor cell differentiation | 66/8552 | 114/18723 | 5.74e-03 | 2.13e-02 | 66 |
| GO:00022445 | Oral cavity | OSCC | hematopoietic progenitor cell differentiation | 57/7305 | 114/18723 | 1.09e-02 | 3.71e-02 | 57 |
| GO:000224413 | Skin | cSCC | hematopoietic progenitor cell differentiation | 42/4864 | 114/18723 | 6.74e-03 | 3.27e-02 | 42 |
| GO:00022448 | Thyroid | ATC | hematopoietic progenitor cell differentiation | 51/6293 | 114/18723 | 8.62e-03 | 3.28e-02 | 51 |
| Page: 1 |
| Pathway ID | Tissue | Disease Stage | Description | Gene Ratio | Bg Ratio | pvalue | p.adjust | qvalue | Count |
| Page: 1 |
Top |
Cell-cell communication analysis |
| Identification of potential cell-cell interactions between two cell types and their ligand-receptor pairs for different disease states |
| Ligand | Receptor | LRpair | Pathway | Tissue | Disease Stage |
| Page: 1 |
Top |
Single-cell gene regulatory network inference analysis |
| Find out the significant the regulons (TFs) and the target genes of each regulon across cell types for different disease states |
| TF | Cell Type | Tissue | Disease Stage | Target Gene | RSS | Regulon Activity |
| ∗The dot plots of a searched regulon are shown for all cell subpopulations in each disease state of each tissue based on the regulon specific score inferred using pySCENIC and by calculating the average expression. |
| Page: 1 |
Top |
Somatic mutation of malignant transformation related genes |
| Annotation of somatic variants for genes involved in malignant transformation |
| Hugo Symbol | Variant Class | Variant Classification | dbSNP RS | HGVSc | HGVSp | HGVSp Short | SWISSPROT | BIOTYPE | SIFT | PolyPhen | Tumor Sample Barcode | Tissue | Histology | Sex | Age | Stage | Therapy Types | Drugs | Outcome |
| C12orf29 | SNV | Missense_Mutation | c.565C>T | p.Leu189Phe | p.L189F | Q8N999 | protein_coding | deleterious(0.03) | benign(0.021) | TCGA-AA-3973-01 | Colorectum | colon adenocarcinoma | Male | >=65 | III/IV | Targeted Molecular therapy | bevacizumab | SD | |
| C12orf29 | SNV | Missense_Mutation | rs765324047 | c.605N>G | p.Asn202Ser | p.N202S | Q8N999 | protein_coding | deleterious(0) | probably_damaging(0.994) | TCGA-AA-3980-01 | Colorectum | colon adenocarcinoma | Female | >=65 | I/II | Unknown | Unknown | SD |
| C12orf29 | SNV | Missense_Mutation | rs750066464 | c.704A>G | p.Asn235Ser | p.N235S | Q8N999 | protein_coding | tolerated(0.89) | benign(0.001) | TCGA-CM-5861-01 | Colorectum | colon adenocarcinoma | Female | <65 | I/II | Unknown | Unknown | PD |
| C12orf29 | SNV | Missense_Mutation | rs767293985 | c.656T>C | p.Ile219Thr | p.I219T | Q8N999 | protein_coding | deleterious(0.04) | benign(0.001) | TCGA-G4-6309-01 | Colorectum | colon adenocarcinoma | Female | <65 | III/IV | Chemotherapy | xeloda | PD |
| C12orf29 | SNV | Missense_Mutation | c.230G>A | p.Arg77Gln | p.R77Q | Q8N999 | protein_coding | tolerated(0.05) | possibly_damaging(0.889) | TCGA-A5-A0G2-01 | Endometrium | uterine corpus endometrioid carcinoma | Female | <65 | III/IV | Unknown | Unknown | SD | |
| C12orf29 | SNV | Missense_Mutation | novel | c.598N>G | p.Asn200Asp | p.N200D | Q8N999 | protein_coding | deleterious(0.01) | benign(0.359) | TCGA-AJ-A3EK-01 | Endometrium | uterine corpus endometrioid carcinoma | Female | <65 | I/II | Chemotherapy | carboplatin | CR |
| C12orf29 | SNV | Missense_Mutation | c.797N>A | p.Arg266His | p.R266H | Q8N999 | protein_coding | deleterious(0.04) | benign(0.011) | TCGA-AJ-A3EK-01 | Endometrium | uterine corpus endometrioid carcinoma | Female | <65 | I/II | Chemotherapy | carboplatin | CR | |
| C12orf29 | SNV | Missense_Mutation | novel | c.493N>G | p.Ile165Val | p.I165V | Q8N999 | protein_coding | tolerated(0.67) | benign(0) | TCGA-AJ-A8CW-01 | Endometrium | uterine corpus endometrioid carcinoma | Female | <65 | I/II | Unknown | Unknown | SD |
| C12orf29 | SNV | Missense_Mutation | c.194N>G | p.Val65Gly | p.V65G | Q8N999 | protein_coding | deleterious(0) | benign(0.131) | TCGA-AX-A0J0-01 | Endometrium | uterine corpus endometrioid carcinoma | Female | <65 | I/II | Unknown | Unknown | SD | |
| C12orf29 | SNV | Missense_Mutation | novel | c.958G>A | p.Asp320Asn | p.D320N | Q8N999 | protein_coding | tolerated(0.12) | benign(0.027) | TCGA-AX-A2HC-01 | Endometrium | uterine corpus endometrioid carcinoma | Female | <65 | III/IV | Chemotherapy | paclitaxel | PD |
| Page: 1 2 3 |
Top |
Related drugs of malignant transformation related genes |
| Identification of chemicals and drugs interact with genes involved in malignant transfromation |
| (DGIdb 4.0) |
| Entrez ID | Symbol | Category | Interaction Types | Drug Claim Name | Drug Name | PMIDs |
| Page: 1 |

Copyright 2023-Present -The University of Texas Health Science Center at Houston |