
|
|||||
|
 | |
| |
| |
| |
| |
| |
|
Gene: C11orf98 |
Gene summary for C11ORF98 |
| Gene information | Species | Human | Gene symbol | C11orf98 | Gene ID | 102288414 |
| Gene name | chromosome 11 open reading frame 98 | |
| Gene Alias | C11orf48 | |
| Cytomap | 11q12.3 | |
| Gene Type | protein-coding | GO ID | NA | UniProtAcc | A0A0B4J220 |
Top |
Malignant transformation analysis |
| Identification of the aberrant gene expression in precancerous and cancerous lesions by comparing the gene expression of stem-like cells in diseased tissues with normal stem cells |
| Entrez ID | Symbol | Replicates | Species | Organ | Tissue | Adj P-value | Log2FC | Malignancy |
| 102288414 | C11orf98 | LZE2T | Human | Esophagus | ESCC | 9.54e-06 | 8.93e-01 | 0.082 |
| 102288414 | C11orf98 | LZE4T | Human | Esophagus | ESCC | 6.54e-24 | 6.52e-01 | 0.0811 |
| 102288414 | C11orf98 | LZE5T | Human | Esophagus | ESCC | 5.52e-13 | 7.78e-01 | 0.0514 |
| 102288414 | C11orf98 | LZE7T | Human | Esophagus | ESCC | 1.05e-23 | 8.22e-01 | 0.0667 |
| 102288414 | C11orf98 | LZE8T | Human | Esophagus | ESCC | 2.19e-19 | 5.16e-01 | 0.067 |
| 102288414 | C11orf98 | LZE20T | Human | Esophagus | ESCC | 8.11e-14 | 3.90e-01 | 0.0662 |
| 102288414 | C11orf98 | LZE21D1 | Human | Esophagus | HGIN | 4.41e-04 | 3.63e-01 | 0.0632 |
| 102288414 | C11orf98 | LZE22D1 | Human | Esophagus | HGIN | 9.21e-09 | 4.42e-01 | 0.0595 |
| 102288414 | C11orf98 | LZE22T | Human | Esophagus | ESCC | 4.24e-14 | 6.52e-01 | 0.068 |
| 102288414 | C11orf98 | LZE24D1 | Human | Esophagus | HGIN | 3.66e-03 | 7.66e-01 | 0.054 |
| 102288414 | C11orf98 | LZE24T | Human | Esophagus | ESCC | 2.82e-54 | 1.19e+00 | 0.0596 |
| 102288414 | C11orf98 | LZE22D3 | Human | Esophagus | HGIN | 1.73e-02 | 4.41e-01 | 0.0653 |
| 102288414 | C11orf98 | LZE21T | Human | Esophagus | ESCC | 2.14e-10 | 4.08e-01 | 0.0655 |
| 102288414 | C11orf98 | LZE6T | Human | Esophagus | ESCC | 4.33e-26 | 8.76e-01 | 0.0845 |
| 102288414 | C11orf98 | P1T-E | Human | Esophagus | ESCC | 1.42e-19 | 7.10e-01 | 0.0875 |
| 102288414 | C11orf98 | P2T-E | Human | Esophagus | ESCC | 1.24e-51 | 8.37e-01 | 0.1177 |
| 102288414 | C11orf98 | P4T-E | Human | Esophagus | ESCC | 1.33e-79 | 2.05e+00 | 0.1323 |
| 102288414 | C11orf98 | P5T-E | Human | Esophagus | ESCC | 2.77e-68 | 1.13e+00 | 0.1327 |
| 102288414 | C11orf98 | P8T-E | Human | Esophagus | ESCC | 1.51e-64 | 1.14e+00 | 0.0889 |
| 102288414 | C11orf98 | P9T-E | Human | Esophagus | ESCC | 4.19e-41 | 9.39e-01 | 0.1131 |
| Page: 1 2 3 4 |
| Tissue | Expression Dynamics | Abbreviation |
| Esophagus | 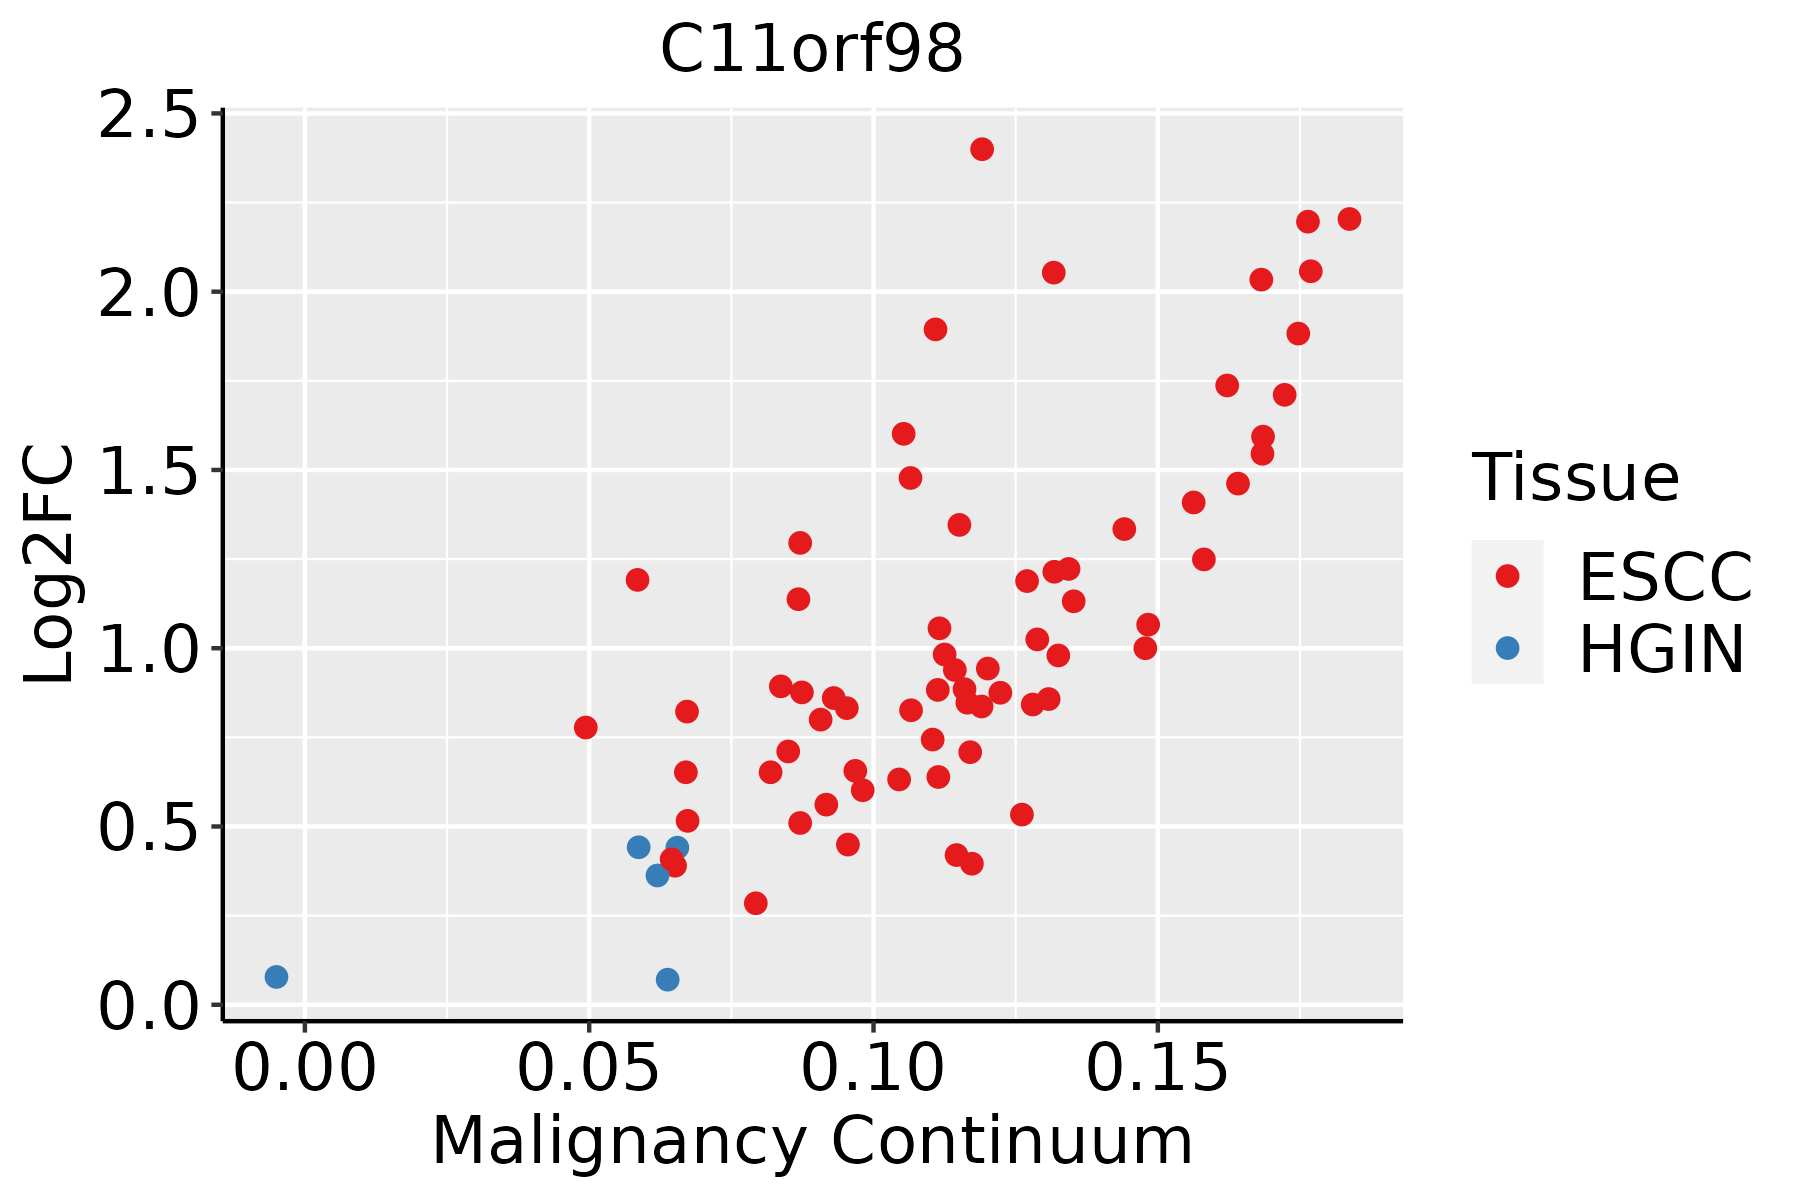 | ESCC: Esophageal squamous cell carcinoma |
| HGIN: High-grade intraepithelial neoplasias | ||
| LGIN: Low-grade intraepithelial neoplasias |
| ∗log2FC in expression of this searched gene in stem-like cells from each diseased tissue sample relative to stem-like cells in normal samples in each tissue plotted against the malignancy continuum. Samples are colored based on if they are from different disease stage. |
Top |
Malignant transformation related pathway analysis |
| Find out the enriched GO biological processes and KEGG pathways involved in transition from healthy to precancer to cancer |
| Tissue | Disease Stage | Enriched GO biological Processes |
| Colorectum | AD |  |
| Colorectum | SER |  |
| Colorectum | MSS |  |
| Colorectum | MSI-H |  |
| Colorectum | FAP |  |
| ∗Top 15 enriched GO BP terms are showed in the bar plot of each disease state in each tissue. Each row represents a significant GO biological process which is colored according to the -log10(p.adjust). |
| Page: 1 2 3 4 5 6 7 8 9 |
| GO ID | Tissue | Disease Stage | Description | Gene Ratio | Bg Ratio | pvalue | p.adjust | Count |
| Page: 1 |
| Pathway ID | Tissue | Disease Stage | Description | Gene Ratio | Bg Ratio | pvalue | p.adjust | qvalue | Count |
| Page: 1 |
Top |
Cell-cell communication analysis |
| Identification of potential cell-cell interactions between two cell types and their ligand-receptor pairs for different disease states |
| Ligand | Receptor | LRpair | Pathway | Tissue | Disease Stage |
| Page: 1 |
Top |
Single-cell gene regulatory network inference analysis |
| Find out the significant the regulons (TFs) and the target genes of each regulon across cell types for different disease states |
| TF | Cell Type | Tissue | Disease Stage | Target Gene | RSS | Regulon Activity |
| ∗The dot plots of a searched regulon are shown for all cell subpopulations in each disease state of each tissue based on the regulon specific score inferred using pySCENIC and by calculating the average expression. |
| Page: 1 |
Top |
Somatic mutation of malignant transformation related genes |
| Annotation of somatic variants for genes involved in malignant transformation |
| Hugo Symbol | Variant Class | Variant Classification | dbSNP RS | HGVSc | HGVSp | HGVSp Short | SWISSPROT | BIOTYPE | SIFT | PolyPhen | Tumor Sample Barcode | Tissue | Histology | Sex | Age | Stage | Therapy Types | Drugs | Outcome |
| C11orf98 | SNV | Missense_Mutation | novel | c.367N>G | p.Ser123Gly | p.S123G | protein_coding | deleterious_low_confidence(0.02) | benign(0.434) | TCGA-A8-A08H-01 | Breast | breast invasive carcinoma | Female | >=65 | I/II | Unknown | Unknown | SD | |
| C11orf98 | SNV | Missense_Mutation | novel | c.21N>C | p.Lys7Asn | p.K7N | protein_coding | deleterious(0.01) | possibly_damaging(0.892) | TCGA-OL-A5RW-01 | Breast | breast invasive carcinoma | Female | <65 | I/II | Chemotherapy | adriamycin | CR | |
| C11orf98 | SNV | Missense_Mutation | novel | c.206N>A | p.Arg69His | p.R69H | protein_coding | deleterious(0.01) | benign(0.037) | TCGA-A5-A2K5-01 | Endometrium | uterine corpus endometrioid carcinoma | Female | >=65 | I/II | Unknown | Unknown | SD | |
| C11orf98 | SNV | Missense_Mutation | novel | c.206G>A | p.Arg69His | p.R69H | protein_coding | deleterious(0.01) | benign(0.037) | TCGA-D1-A16X-01 | Endometrium | uterine corpus endometrioid carcinoma | Female | <65 | I/II | Unknown | Unknown | SD | |
| C11orf98 | SNV | Missense_Mutation | novel | c.318N>T | p.Lys106Asn | p.K106N | protein_coding | tolerated(0.12) | benign(0.009) | TCGA-EO-A3B0-01 | Endometrium | uterine corpus endometrioid carcinoma | Female | <65 | III/IV | Unknown | Unknown | SD | |
| C11orf98 | SNV | Missense_Mutation | novel | c.308N>G | p.Lys103Arg | p.K103R | protein_coding | tolerated(0.22) | benign(0.058) | TCGA-34-2596-01 | Lung | lung squamous cell carcinoma | Male | >=65 | I/II | Unknown | Unknown | SD |
| Page: 1 |
Top |
Related drugs of malignant transformation related genes |
| Identification of chemicals and drugs interact with genes involved in malignant transfromation |
| (DGIdb 4.0) |
| Entrez ID | Symbol | Category | Interaction Types | Drug Claim Name | Drug Name | PMIDs |
| Page: 1 |

Copyright 2023-Present -The University of Texas Health Science Center at Houston |