
|
|||||
|
 | |
| |
| |
| |
| |
| |
|
Gene: C11orf80 |
Gene summary for C11ORF80 |
| Gene information | Species | Human | Gene symbol | C11orf80 | Gene ID | 79703 |
| Gene name | chromosome 11 open reading frame 80 | |
| Gene Alias | HYDM4 | |
| Cytomap | 11q13.2 | |
| Gene Type | protein-coding | GO ID | GO:0000003 | UniProtAcc | B4DXL1 |
Top |
Malignant transformation analysis |
| Identification of the aberrant gene expression in precancerous and cancerous lesions by comparing the gene expression of stem-like cells in diseased tissues with normal stem cells |
| Entrez ID | Symbol | Replicates | Species | Organ | Tissue | Adj P-value | Log2FC | Malignancy |
| 79703 | C11orf80 | CCI_1 | Human | Cervix | CC | 2.52e-04 | 4.97e-01 | 0.528 |
| 79703 | C11orf80 | CCI_2 | Human | Cervix | CC | 4.24e-07 | 5.89e-01 | 0.5249 |
| 79703 | C11orf80 | CCI_3 | Human | Cervix | CC | 5.61e-12 | 6.26e-01 | 0.516 |
| 79703 | C11orf80 | CCII_1 | Human | Cervix | CC | 9.74e-06 | 3.25e-01 | 0.3249 |
| 79703 | C11orf80 | LZE2T | Human | Esophagus | ESCC | 8.97e-03 | 3.98e-01 | 0.082 |
| 79703 | C11orf80 | LZE4T | Human | Esophagus | ESCC | 4.19e-05 | 1.95e-01 | 0.0811 |
| 79703 | C11orf80 | LZE20T | Human | Esophagus | ESCC | 6.19e-11 | 3.53e-01 | 0.0662 |
| 79703 | C11orf80 | LZE24T | Human | Esophagus | ESCC | 3.40e-10 | 2.81e-01 | 0.0596 |
| 79703 | C11orf80 | LZE21T | Human | Esophagus | ESCC | 4.82e-02 | 2.36e-01 | 0.0655 |
| 79703 | C11orf80 | P1T-E | Human | Esophagus | ESCC | 2.80e-05 | 2.96e-01 | 0.0875 |
| 79703 | C11orf80 | P2T-E | Human | Esophagus | ESCC | 2.47e-08 | 1.66e-01 | 0.1177 |
| 79703 | C11orf80 | P4T-E | Human | Esophagus | ESCC | 5.00e-17 | 3.92e-01 | 0.1323 |
| 79703 | C11orf80 | P5T-E | Human | Esophagus | ESCC | 5.73e-19 | 3.31e-01 | 0.1327 |
| 79703 | C11orf80 | P8T-E | Human | Esophagus | ESCC | 6.50e-21 | 3.17e-01 | 0.0889 |
| 79703 | C11orf80 | P9T-E | Human | Esophagus | ESCC | 2.77e-09 | 2.10e-01 | 0.1131 |
| 79703 | C11orf80 | P10T-E | Human | Esophagus | ESCC | 5.27e-10 | 1.77e-01 | 0.116 |
| 79703 | C11orf80 | P11T-E | Human | Esophagus | ESCC | 2.77e-09 | 3.32e-01 | 0.1426 |
| 79703 | C11orf80 | P12T-E | Human | Esophagus | ESCC | 1.39e-35 | 6.13e-01 | 0.1122 |
| 79703 | C11orf80 | P15T-E | Human | Esophagus | ESCC | 4.22e-26 | 5.09e-01 | 0.1149 |
| 79703 | C11orf80 | P16T-E | Human | Esophagus | ESCC | 2.05e-12 | 2.75e-01 | 0.1153 |
| Page: 1 2 3 4 5 |
| Tissue | Expression Dynamics | Abbreviation |
| Cervix | 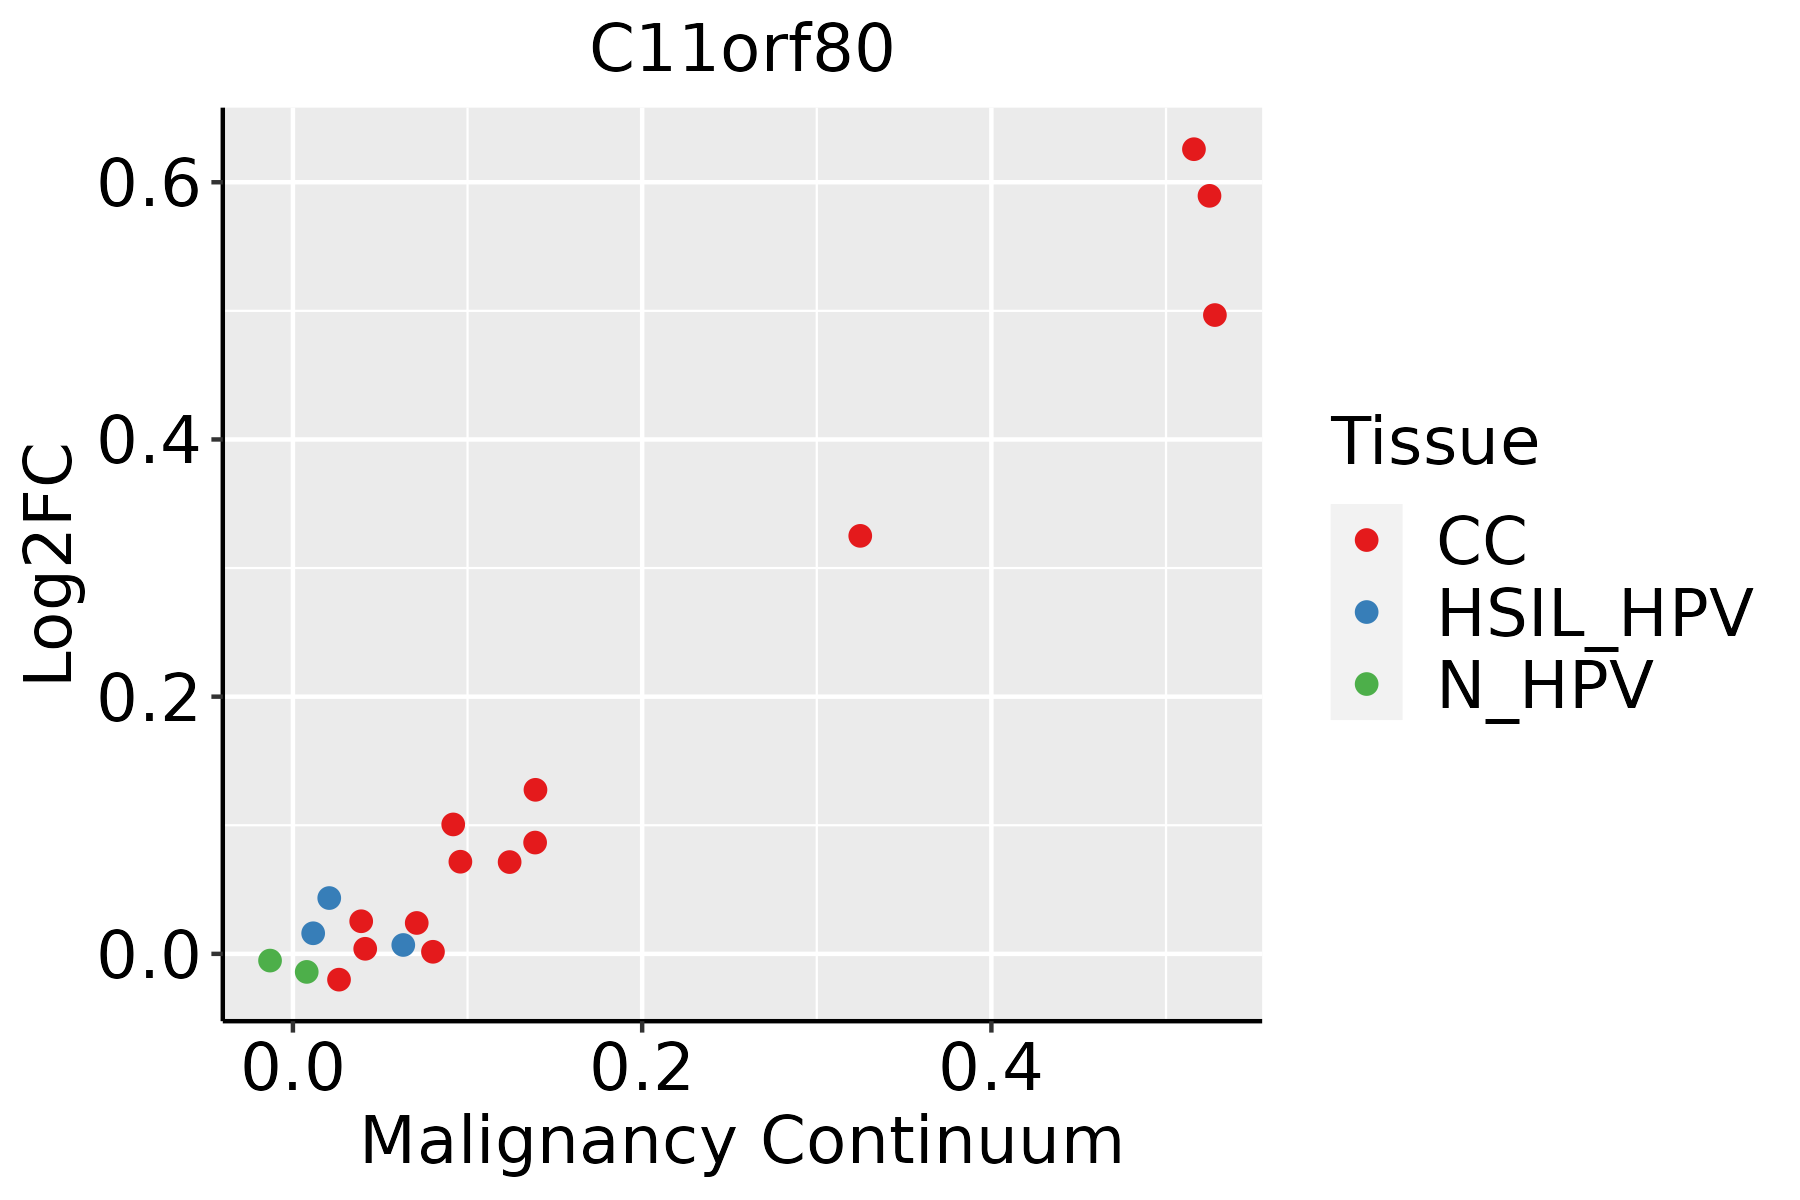 | CC: Cervix cancer |
| HSIL_HPV: HPV-infected high-grade squamous intraepithelial lesions | ||
| N_HPV: HPV-infected normal cervix | ||
| Esophagus | 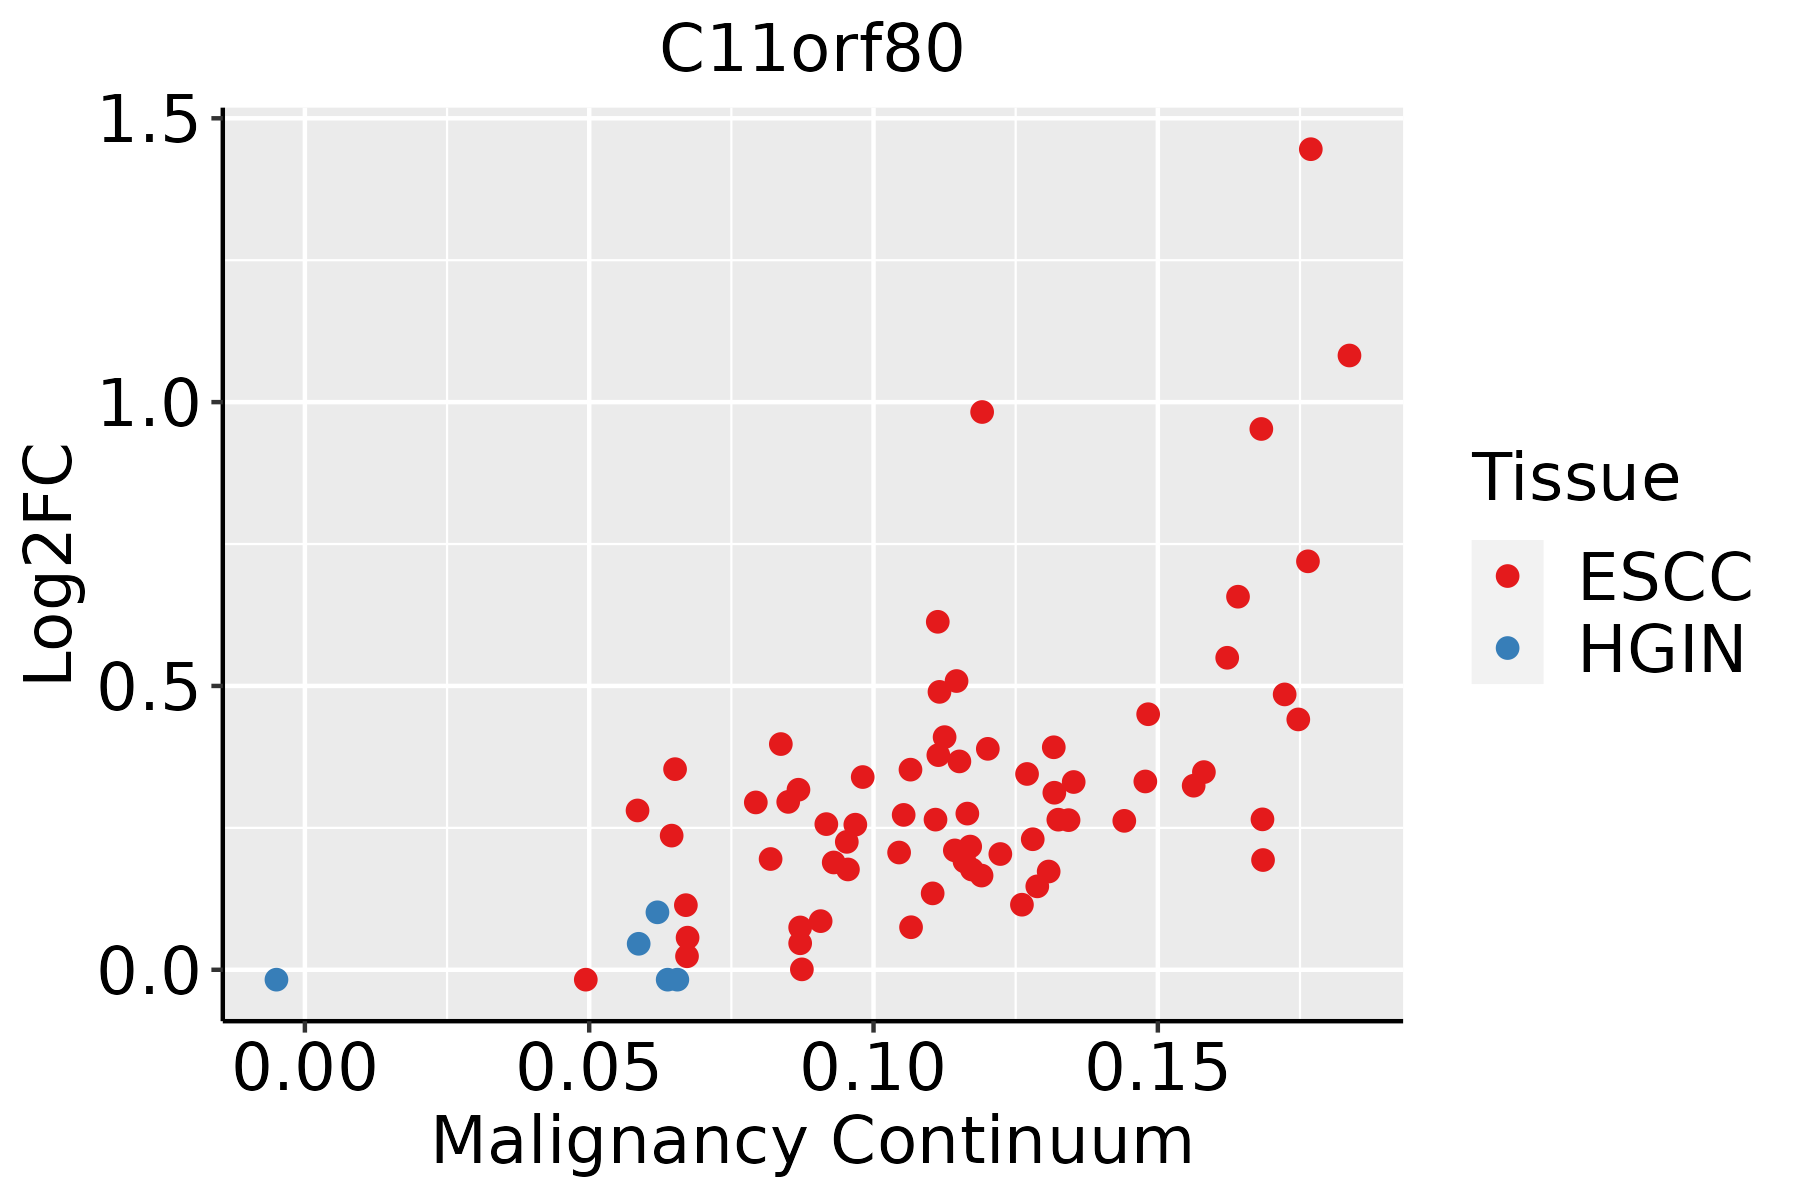 | ESCC: Esophageal squamous cell carcinoma |
| HGIN: High-grade intraepithelial neoplasias | ||
| LGIN: Low-grade intraepithelial neoplasias | ||
| Lung | 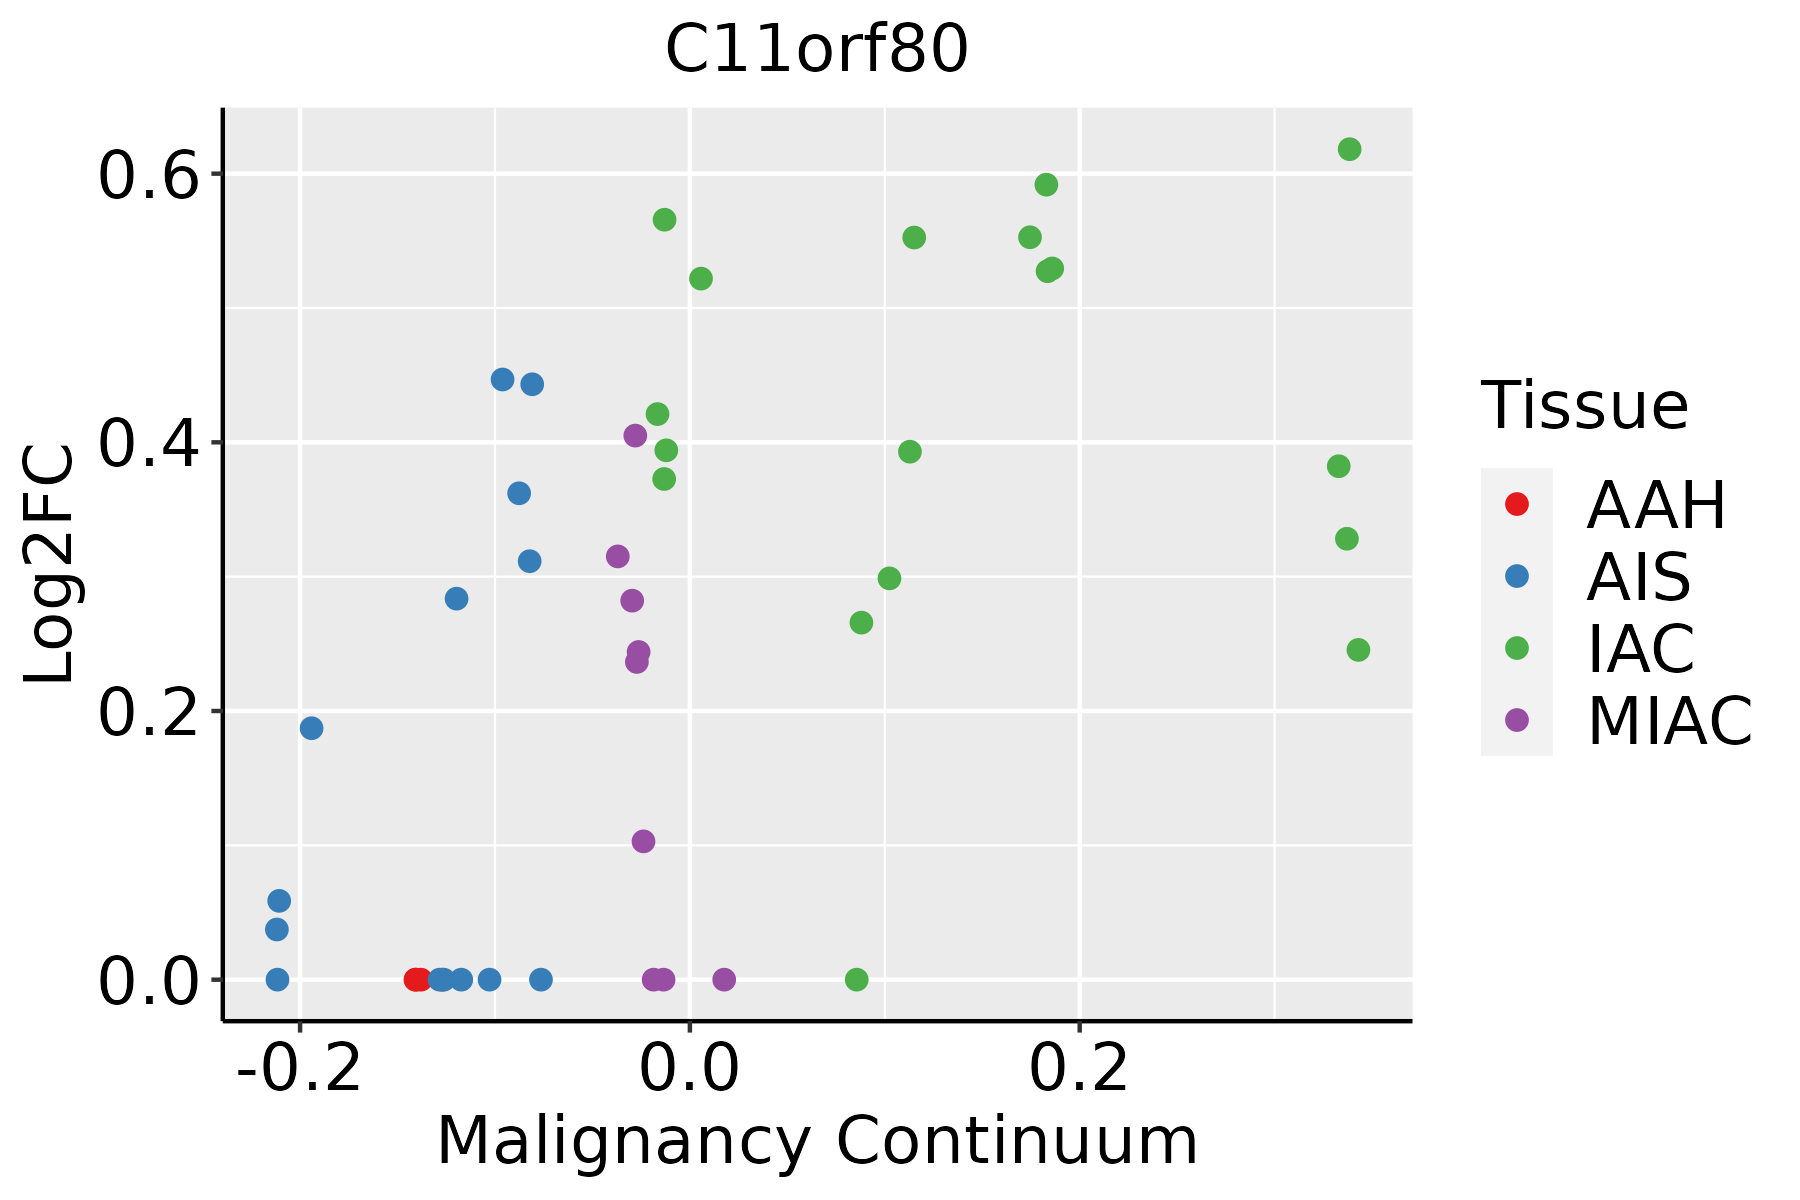 | AAH: Atypical adenomatous hyperplasia |
| AIS: Adenocarcinoma in situ | ||
| IAC: Invasive lung adenocarcinoma | ||
| MIA: Minimally invasive adenocarcinoma | ||
| Oral Cavity | 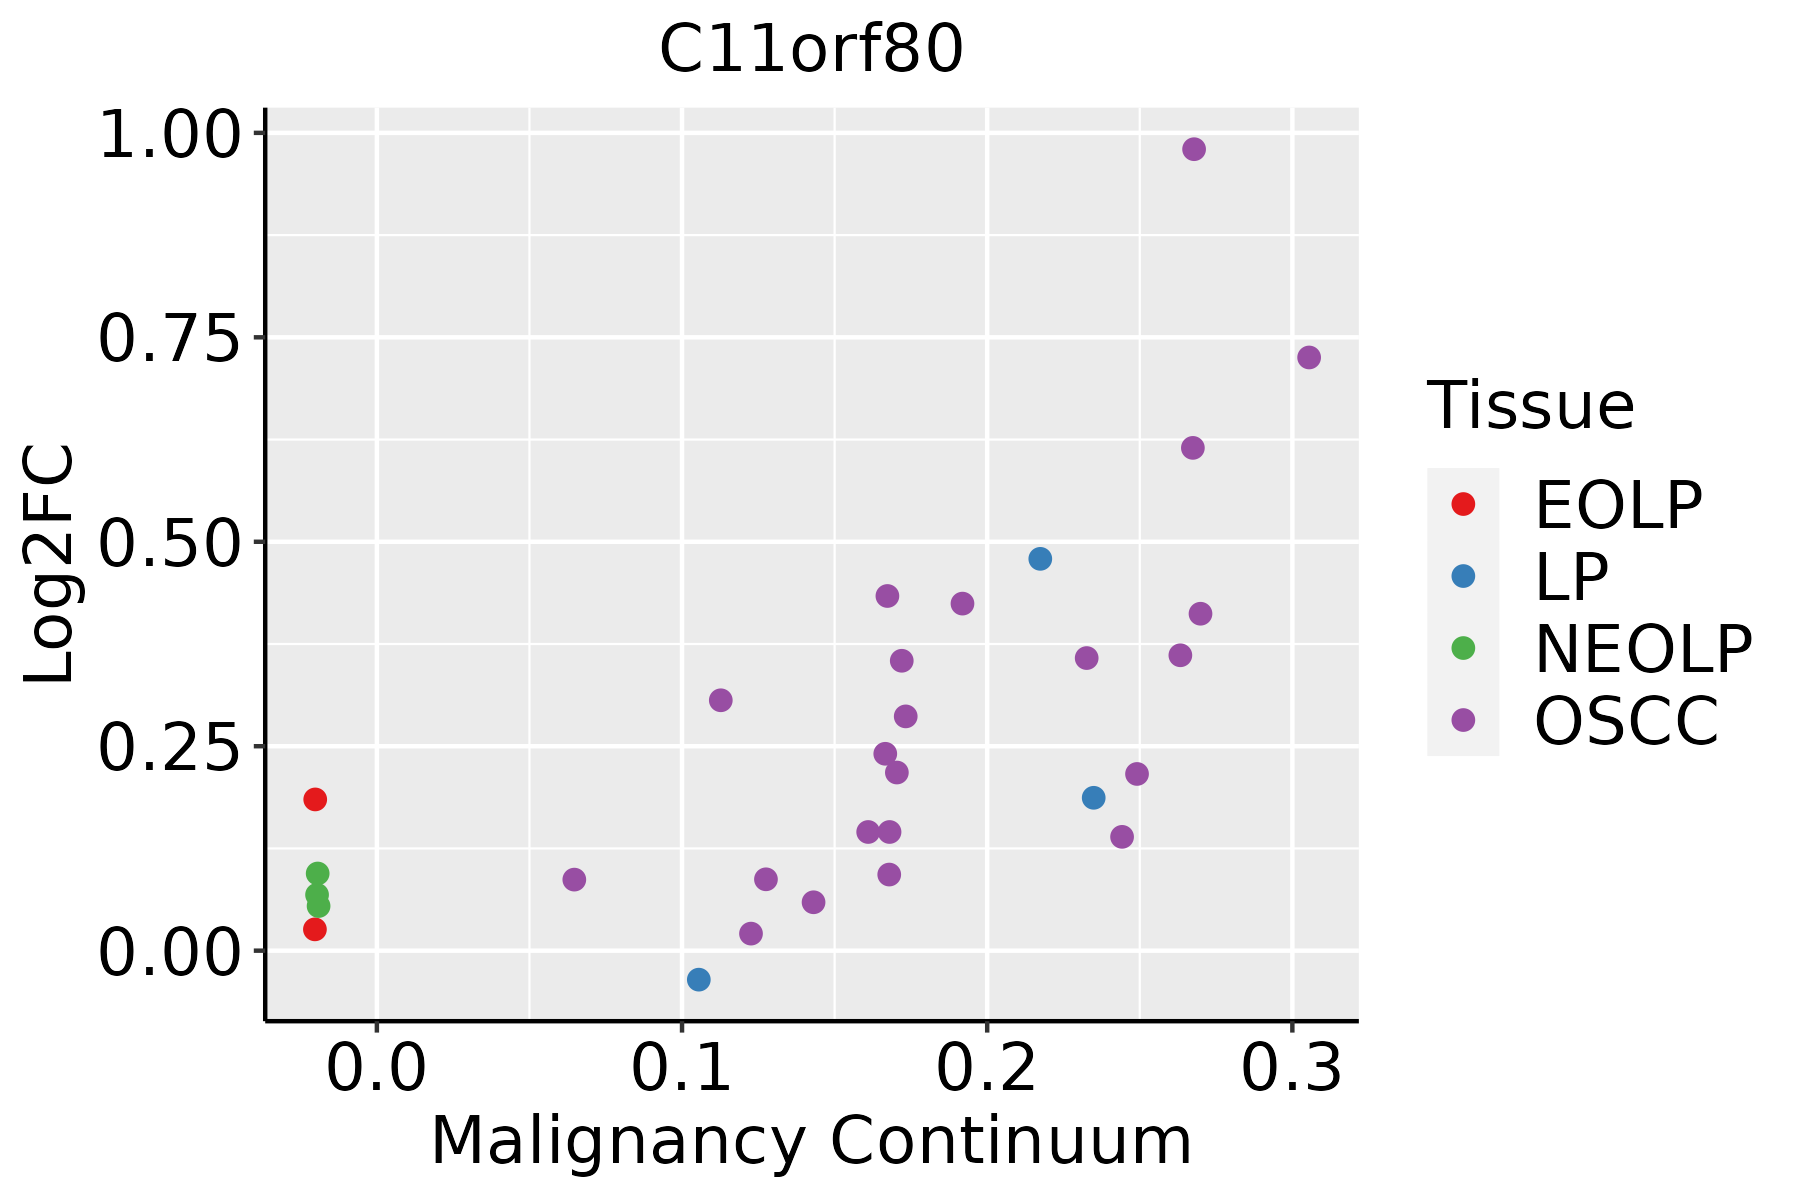 | EOLP: Erosive Oral lichen planus |
| LP: leukoplakia | ||
| NEOLP: Non-erosive oral lichen planus | ||
| OSCC: Oral squamous cell carcinoma |
| ∗log2FC in expression of this searched gene in stem-like cells from each diseased tissue sample relative to stem-like cells in normal samples in each tissue plotted against the malignancy continuum. Samples are colored based on if they are from different disease stage. |
Top |
Malignant transformation related pathway analysis |
| Find out the enriched GO biological processes and KEGG pathways involved in transition from healthy to precancer to cancer |
| Tissue | Disease Stage | Enriched GO biological Processes |
| Colorectum | AD |  |
| Colorectum | SER |  |
| Colorectum | MSS |  |
| Colorectum | MSI-H |  |
| Colorectum | FAP |  |
| ∗Top 15 enriched GO BP terms are showed in the bar plot of each disease state in each tissue. Each row represents a significant GO biological process which is colored according to the -log10(p.adjust). |
| Page: 1 2 3 4 5 6 7 8 9 |
| GO ID | Tissue | Disease Stage | Description | Gene Ratio | Bg Ratio | pvalue | p.adjust | Count |
| GO:00482851 | Cervix | CC | organelle fission | 78/2311 | 488/18723 | 9.70e-03 | 4.79e-02 | 78 |
| GO:00482853 | Esophagus | ESCC | organelle fission | 301/8552 | 488/18723 | 4.64e-13 | 2.12e-11 | 301 |
| GO:00002802 | Esophagus | ESCC | nuclear division | 270/8552 | 439/18723 | 1.17e-11 | 4.24e-10 | 270 |
| GO:00903053 | Esophagus | ESCC | nucleic acid phosphodiester bond hydrolysis | 163/8552 | 261/18723 | 3.07e-08 | 5.73e-07 | 163 |
| GO:00063101 | Esophagus | ESCC | DNA recombination | 168/8552 | 305/18723 | 5.58e-04 | 3.05e-03 | 168 |
| GO:00482852 | Oral cavity | OSCC | organelle fission | 265/7305 | 488/18723 | 3.22e-12 | 1.27e-10 | 265 |
| GO:00002801 | Oral cavity | OSCC | nuclear division | 237/7305 | 439/18723 | 9.62e-11 | 2.90e-09 | 237 |
| GO:00903052 | Oral cavity | OSCC | nucleic acid phosphodiester bond hydrolysis | 142/7305 | 261/18723 | 2.90e-07 | 4.43e-06 | 142 |
| GO:0006310 | Oral cavity | OSCC | DNA recombination | 147/7305 | 305/18723 | 6.33e-04 | 3.56e-03 | 147 |
| Page: 1 |
| Pathway ID | Tissue | Disease Stage | Description | Gene Ratio | Bg Ratio | pvalue | p.adjust | qvalue | Count |
| Page: 1 |
Top |
Cell-cell communication analysis |
| Identification of potential cell-cell interactions between two cell types and their ligand-receptor pairs for different disease states |
| Ligand | Receptor | LRpair | Pathway | Tissue | Disease Stage |
| Page: 1 |
Top |
Single-cell gene regulatory network inference analysis |
| Find out the significant the regulons (TFs) and the target genes of each regulon across cell types for different disease states |
| TF | Cell Type | Tissue | Disease Stage | Target Gene | RSS | Regulon Activity |
| ∗The dot plots of a searched regulon are shown for all cell subpopulations in each disease state of each tissue based on the regulon specific score inferred using pySCENIC and by calculating the average expression. |
| Page: 1 |
Top |
Somatic mutation of malignant transformation related genes |
| Annotation of somatic variants for genes involved in malignant transformation |
| Hugo Symbol | Variant Class | Variant Classification | dbSNP RS | HGVSc | HGVSp | HGVSp Short | SWISSPROT | BIOTYPE | SIFT | PolyPhen | Tumor Sample Barcode | Tissue | Histology | Sex | Age | Stage | Therapy Types | Drugs | Outcome |
| C11orf80 | SNV | Missense_Mutation | novel | c.1649N>T | p.Cys550Phe | p.C550F | Q8N6T0 | protein_coding | deleterious(0) | probably_damaging(0.926) | TCGA-UU-A93S-01 | Breast | breast invasive carcinoma | Female | <65 | III/IV | Unknown | Unknown | PD |
| C11orf80 | insertion | Frame_Shift_Ins | novel | c.807_808insA | p.Gly270ArgfsTer20 | p.G270Rfs*20 | Q8N6T0 | protein_coding | TCGA-AR-A0TU-01 | Breast | breast invasive carcinoma | Female | <65 | I/II | Unspecific | Doxorubicin | SD | ||
| C11orf80 | insertion | Frame_Shift_Ins | novel | c.809_810insACAAT | p.Ile271GlnfsTer2 | p.I271Qfs*2 | Q8N6T0 | protein_coding | TCGA-AR-A0TU-01 | Breast | breast invasive carcinoma | Female | <65 | I/II | Unspecific | Doxorubicin | SD | ||
| C11orf80 | insertion | Frame_Shift_Ins | rs779402951 | c.783dupT | p.Glu262Ter | p.E262* | Q8N6T0 | protein_coding | TCGA-E2-A14S-01 | Breast | breast invasive carcinoma | Female | >=65 | I/II | Chemotherapy | cytoxan | SD | ||
| C11orf80 | deletion | Frame_Shift_Del | c.1191delN | p.Leu398TrpfsTer6 | p.L398Wfs*6 | Q8N6T0 | protein_coding | TCGA-E2-A15A-06 | Breast | breast invasive carcinoma | Female | <65 | III/IV | Chemotherapy | cyclophosphamide | SD | |||
| C11orf80 | SNV | Missense_Mutation | rs763038216 | c.502N>A | p.Val168Ile | p.V168I | Q8N6T0 | protein_coding | tolerated(0.14) | benign(0.16) | TCGA-2W-A8YY-01 | Cervix | cervical & endocervical cancer | Female | <65 | I/II | Chemotherapy | cisplatin | CR |
| C11orf80 | SNV | Missense_Mutation | c.1681N>C | p.Glu561Gln | p.E561Q | Q8N6T0 | protein_coding | deleterious(0.04) | possibly_damaging(0.615) | TCGA-C5-A1MH-01 | Cervix | cervical & endocervical cancer | Female | >=65 | III/IV | Chemotherapy | cisplatin | PD | |
| C11orf80 | SNV | Missense_Mutation | novel | c.185N>C | p.Arg62Thr | p.R62T | Q8N6T0 | protein_coding | deleterious(0.01) | possibly_damaging(0.848) | TCGA-HM-A4S6-01 | Cervix | cervical & endocervical cancer | Female | <65 | III/IV | Chemotherapy | cisplatin | CR |
| C11orf80 | SNV | Missense_Mutation | c.2005G>A | p.Glu669Lys | p.E669K | Q8N6T0 | protein_coding | deleterious(0) | possibly_damaging(0.903) | TCGA-MU-A51Y-01 | Cervix | cervical & endocervical cancer | Female | <65 | I/II | Unknown | Unknown | SD | |
| C11orf80 | SNV | Missense_Mutation | c.671T>A | p.Leu224Gln | p.L224Q | Q8N6T0 | protein_coding | tolerated(0.06) | probably_damaging(0.945) | TCGA-AA-3811-01 | Colorectum | colon adenocarcinoma | Female | >=65 | III/IV | Unknown | Unknown | PD |
| Page: 1 2 3 4 5 6 |
Top |
Related drugs of malignant transformation related genes |
| Identification of chemicals and drugs interact with genes involved in malignant transfromation |
| (DGIdb 4.0) |
| Entrez ID | Symbol | Category | Interaction Types | Drug Claim Name | Drug Name | PMIDs |
| Page: 1 |

Copyright 2023-Present -The University of Texas Health Science Center at Houston |