
|
|||||
|
 | |
| |
| |
| |
| |
| |
|
Gene: C11orf74 |
Gene summary for C11ORF74 |
| Gene information | Species | Human | Gene symbol | C11orf74 | Gene ID | 119710 |
| Gene name | intraflagellar transport associated protein | |
| Gene Alias | C11orf74 | |
| Cytomap | 11p12 | |
| Gene Type | protein-coding | GO ID | GO:0000003 | UniProtAcc | Q86VG3 |
Top |
Malignant transformation analysis |
| Identification of the aberrant gene expression in precancerous and cancerous lesions by comparing the gene expression of stem-like cells in diseased tissues with normal stem cells |
| Entrez ID | Symbol | Replicates | Species | Organ | Tissue | Adj P-value | Log2FC | Malignancy |
| 119710 | C11orf74 | HCC1_Meng | Human | Liver | HCC | 1.12e-72 | 9.08e-02 | 0.0246 |
| 119710 | C11orf74 | HCC2_Meng | Human | Liver | HCC | 5.07e-13 | -1.23e-02 | 0.0107 |
| 119710 | C11orf74 | cirrhotic1 | Human | Liver | Cirrhotic | 4.76e-05 | 1.10e-01 | 0.0202 |
| 119710 | C11orf74 | Pt13.b | Human | Liver | HCC | 2.40e-10 | 1.10e-01 | 0.0251 |
| 119710 | C11orf74 | Pt14.b | Human | Liver | HCC | 6.02e-04 | 1.87e-01 | 0.018 |
| 119710 | C11orf74 | S014 | Human | Liver | HCC | 8.12e-22 | 7.32e-01 | 0.2254 |
| 119710 | C11orf74 | S015 | Human | Liver | HCC | 4.87e-16 | 6.69e-01 | 0.2375 |
| 119710 | C11orf74 | S016 | Human | Liver | HCC | 4.65e-21 | 5.85e-01 | 0.2243 |
| 119710 | C11orf74 | S028 | Human | Liver | HCC | 3.24e-05 | 2.89e-01 | 0.2503 |
| 119710 | C11orf74 | S029 | Human | Liver | HCC | 2.50e-05 | 2.87e-01 | 0.2581 |
| 119710 | C11orf74 | C04 | Human | Oral cavity | OSCC | 4.40e-17 | 8.62e-01 | 0.2633 |
| 119710 | C11orf74 | C21 | Human | Oral cavity | OSCC | 3.62e-24 | 7.93e-01 | 0.2678 |
| 119710 | C11orf74 | C30 | Human | Oral cavity | OSCC | 1.38e-06 | 4.20e-01 | 0.3055 |
| 119710 | C11orf74 | C38 | Human | Oral cavity | OSCC | 3.85e-07 | 8.15e-01 | 0.172 |
| 119710 | C11orf74 | C46 | Human | Oral cavity | OSCC | 2.17e-10 | 3.65e-01 | 0.1673 |
| 119710 | C11orf74 | C51 | Human | Oral cavity | OSCC | 2.21e-03 | 3.77e-01 | 0.2674 |
| 119710 | C11orf74 | C57 | Human | Oral cavity | OSCC | 3.98e-02 | 2.38e-01 | 0.1679 |
| 119710 | C11orf74 | C08 | Human | Oral cavity | OSCC | 1.44e-04 | 1.58e-01 | 0.1919 |
| 119710 | C11orf74 | C09 | Human | Oral cavity | OSCC | 1.04e-05 | 1.23e-01 | 0.1431 |
| 119710 | C11orf74 | LN46 | Human | Oral cavity | OSCC | 3.84e-07 | 3.98e-01 | 0.1666 |
| Page: 1 2 |
| Tissue | Expression Dynamics | Abbreviation |
| Liver | 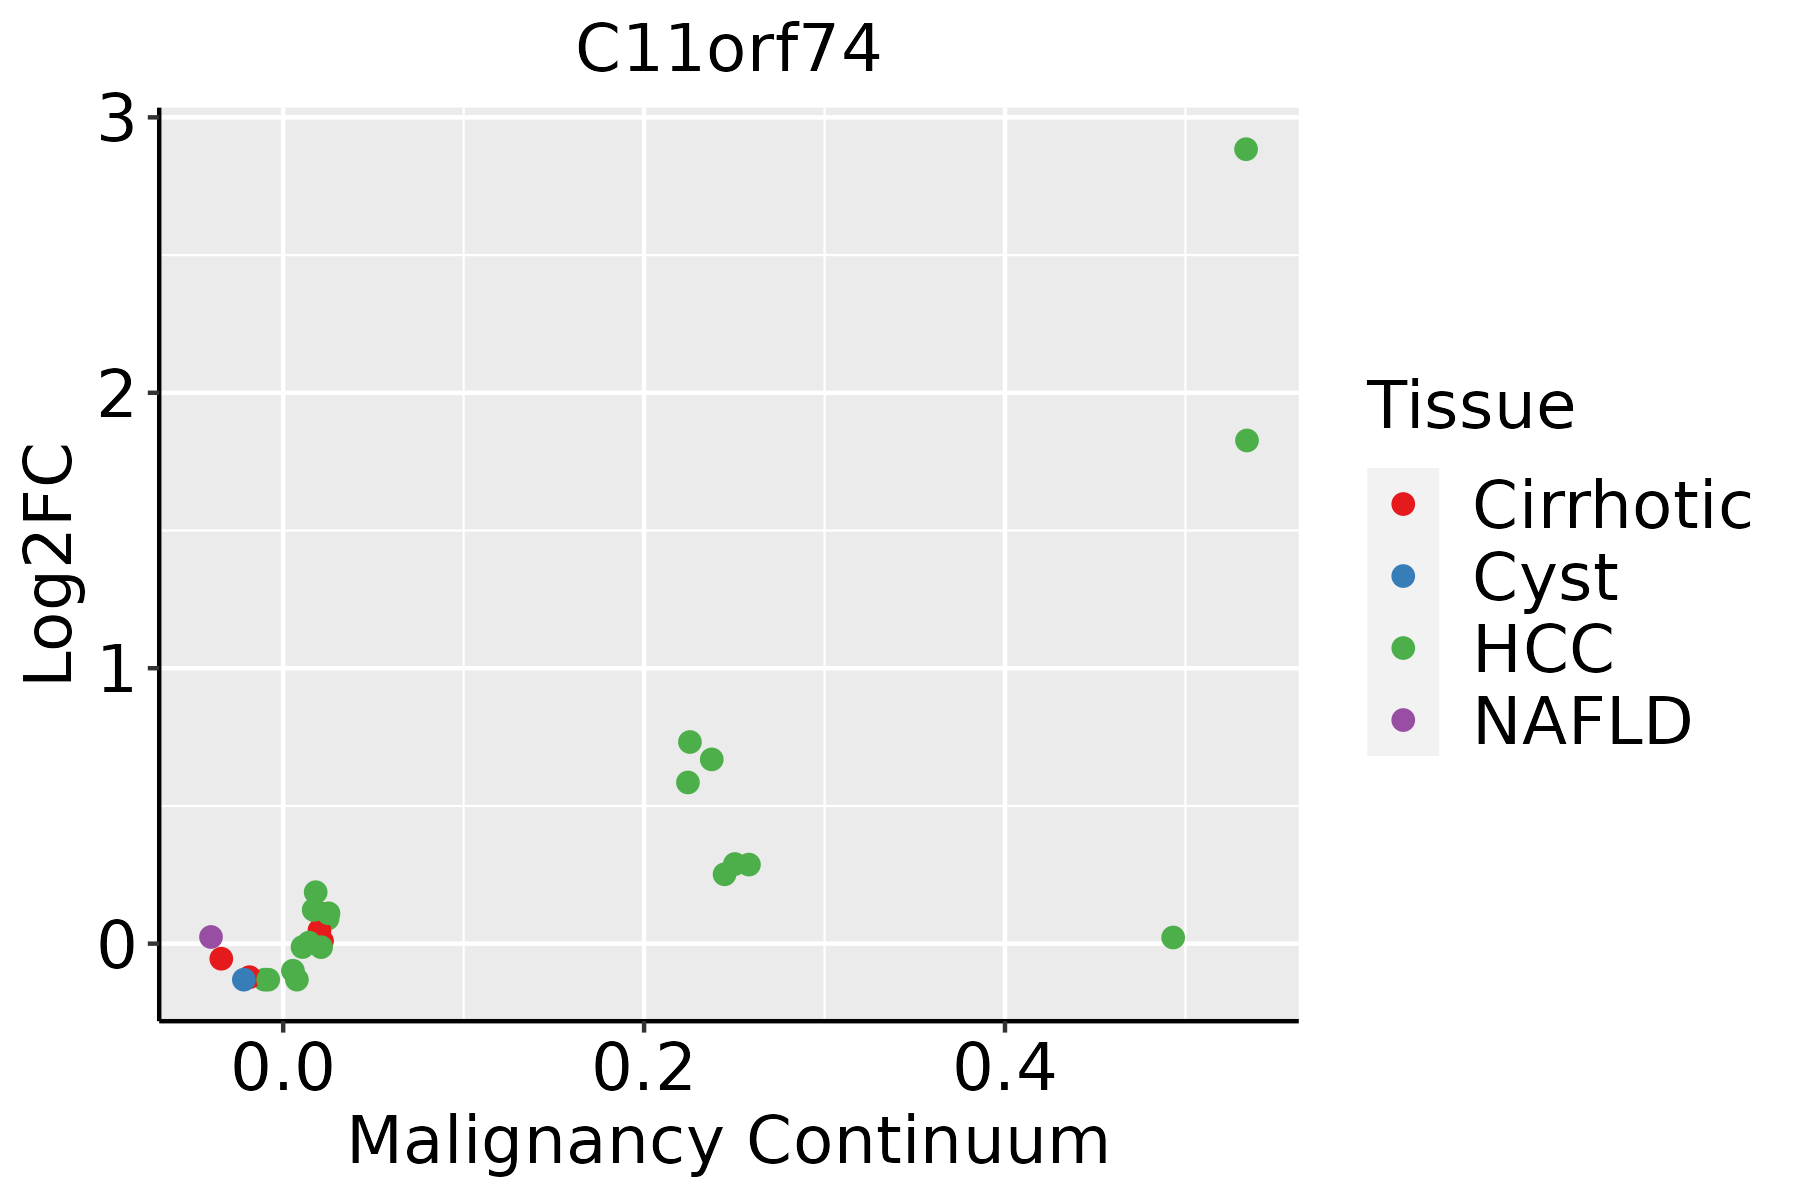 | HCC: Hepatocellular carcinoma |
| NAFLD: Non-alcoholic fatty liver disease | ||
| Oral Cavity | 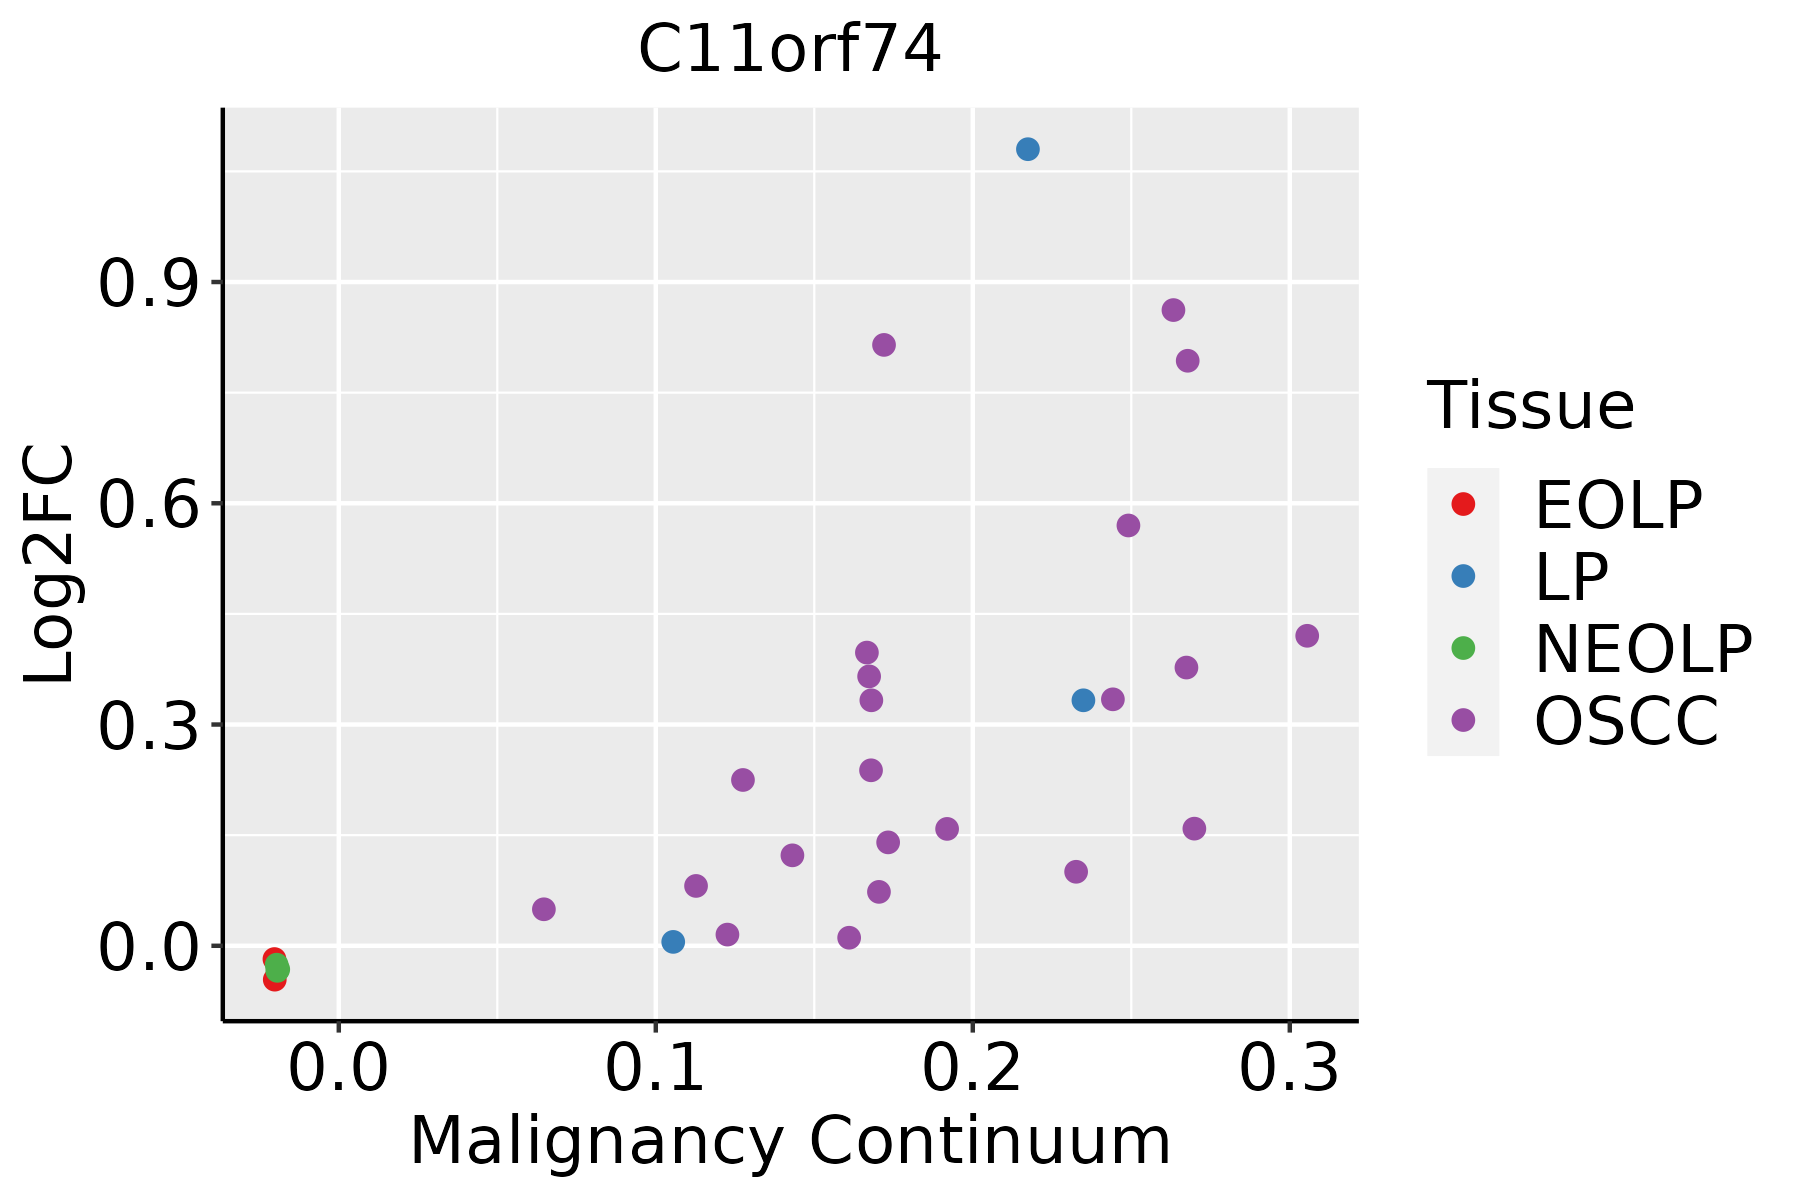 | EOLP: Erosive Oral lichen planus |
| LP: leukoplakia | ||
| NEOLP: Non-erosive oral lichen planus | ||
| OSCC: Oral squamous cell carcinoma |
| ∗log2FC in expression of this searched gene in stem-like cells from each diseased tissue sample relative to stem-like cells in normal samples in each tissue plotted against the malignancy continuum. Samples are colored based on if they are from different disease stage. |
Top |
Malignant transformation related pathway analysis |
| Find out the enriched GO biological processes and KEGG pathways involved in transition from healthy to precancer to cancer |
| Tissue | Disease Stage | Enriched GO biological Processes |
| Colorectum | AD |  |
| Colorectum | SER |  |
| Colorectum | MSS |  |
| Colorectum | MSI-H |  |
| Colorectum | FAP |  |
| ∗Top 15 enriched GO BP terms are showed in the bar plot of each disease state in each tissue. Each row represents a significant GO biological process which is colored according to the -log10(p.adjust). |
| Page: 1 2 3 4 5 6 7 8 9 |
| GO ID | Tissue | Disease Stage | Description | Gene Ratio | Bg Ratio | pvalue | p.adjust | Count |
| Page: 1 |
| Pathway ID | Tissue | Disease Stage | Description | Gene Ratio | Bg Ratio | pvalue | p.adjust | qvalue | Count |
| Page: 1 |
Top |
Cell-cell communication analysis |
| Identification of potential cell-cell interactions between two cell types and their ligand-receptor pairs for different disease states |
| Ligand | Receptor | LRpair | Pathway | Tissue | Disease Stage |
| Page: 1 |
Top |
Single-cell gene regulatory network inference analysis |
| Find out the significant the regulons (TFs) and the target genes of each regulon across cell types for different disease states |
| TF | Cell Type | Tissue | Disease Stage | Target Gene | RSS | Regulon Activity |
| ∗The dot plots of a searched regulon are shown for all cell subpopulations in each disease state of each tissue based on the regulon specific score inferred using pySCENIC and by calculating the average expression. |
| Page: 1 |
Top |
Somatic mutation of malignant transformation related genes |
| Annotation of somatic variants for genes involved in malignant transformation |
| Hugo Symbol | Variant Class | Variant Classification | dbSNP RS | HGVSc | HGVSp | HGVSp Short | SWISSPROT | BIOTYPE | SIFT | PolyPhen | Tumor Sample Barcode | Tissue | Histology | Sex | Age | Stage | Therapy Types | Drugs | Outcome |
| C11orf74 | SNV | Missense_Mutation | novel | c.551N>T | p.Asp184Val | p.D184V | Q86VG3 | protein_coding | deleterious(0) | probably_damaging(1) | TCGA-A7-A26I-01 | Breast | breast invasive carcinoma | Female | >=65 | I/II | Chemotherapy | cytoxan | SD |
| C11orf74 | SNV | Missense_Mutation | c.266N>A | p.Thr89Asn | p.T89N | Q86VG3 | protein_coding | tolerated(0.16) | possibly_damaging(0.448) | TCGA-E9-A1R4-01 | Breast | breast invasive carcinoma | Female | >=65 | I/II | Chemotherapy | 5-fluorouracil | SD | |
| C11orf74 | SNV | Missense_Mutation | c.662N>G | p.Asp221Gly | p.D221G | Q86VG3 | protein_coding | deleterious_low_confidence(0) | benign(0.058) | TCGA-GI-A2C8-01 | Breast | breast invasive carcinoma | Female | <65 | III/IV | Unspecific | Adriamycin | SD | |
| C11orf74 | deletion | Frame_Shift_Del | novel | c.182delN | p.Asn62ThrfsTer37 | p.N62Tfs*37 | Q86VG3 | protein_coding | TCGA-D8-A27V-01 | Breast | breast invasive carcinoma | Female | <65 | I/II | Hormone Therapy | tamoxiphen | SD | ||
| C11orf74 | SNV | Missense_Mutation | novel | c.481N>A | p.Asp161Asn | p.D161N | Q86VG3 | protein_coding | tolerated(0.21) | benign(0.011) | TCGA-AA-A01D-01 | Colorectum | colon adenocarcinoma | Female | <65 | III/IV | Chemotherapy | capecitabine | PD |
| C11orf74 | SNV | Missense_Mutation | c.238N>A | p.Leu80Ile | p.L80I | Q86VG3 | protein_coding | tolerated(0.25) | benign(0.056) | TCGA-A5-A0GP-01 | Endometrium | uterine corpus endometrioid carcinoma | Female | <65 | I/II | Unknown | Unknown | SD | |
| C11orf74 | SNV | Missense_Mutation | novel | c.316N>T | p.Asp106Tyr | p.D106Y | Q86VG3 | protein_coding | deleterious(0) | probably_damaging(0.964) | TCGA-A5-A2K5-01 | Endometrium | uterine corpus endometrioid carcinoma | Female | >=65 | I/II | Unknown | Unknown | SD |
| C11orf74 | SNV | Missense_Mutation | novel | c.476G>T | p.Arg159Ile | p.R159I | Q86VG3 | protein_coding | tolerated(0.18) | benign(0.382) | TCGA-AJ-A5DW-01 | Endometrium | uterine corpus endometrioid carcinoma | Female | <65 | I/II | Unknown | Unknown | SD |
| C11orf74 | SNV | Missense_Mutation | novel | c.20N>T | p.Gly7Val | p.G7V | Q86VG3 | protein_coding | tolerated(0.05) | benign(0.325) | TCGA-AP-A059-01 | Endometrium | uterine corpus endometrioid carcinoma | Female | >=65 | I/II | Unknown | Unknown | SD |
| C11orf74 | SNV | Missense_Mutation | novel | c.460N>C | p.Lys154Gln | p.K154Q | Q86VG3 | protein_coding | tolerated(0.5) | benign(0.036) | TCGA-AX-A2HC-01 | Endometrium | uterine corpus endometrioid carcinoma | Female | <65 | III/IV | Chemotherapy | paclitaxel | PD |
| Page: 1 2 3 4 |
Top |
Related drugs of malignant transformation related genes |
| Identification of chemicals and drugs interact with genes involved in malignant transfromation |
| (DGIdb 4.0) |
| Entrez ID | Symbol | Category | Interaction Types | Drug Claim Name | Drug Name | PMIDs |
| Page: 1 |

Copyright 2023-Present -The University of Texas Health Science Center at Houston |