
|
|||||
|
 | |
| |
| |
| |
| |
| |
|
Gene: C11orf71 |
Gene summary for C11ORF71 |
| Gene information | Species | Human | Gene symbol | C11orf71 | Gene ID | 54494 |
| Gene name | chromosome 11 open reading frame 71 | |
| Gene Alias | URLC7 | |
| Cytomap | 11q23.2 | |
| Gene Type | protein-coding | GO ID | GO:0005575 | UniProtAcc | A0A0A8K8C2 |
Top |
Malignant transformation analysis |
| Identification of the aberrant gene expression in precancerous and cancerous lesions by comparing the gene expression of stem-like cells in diseased tissues with normal stem cells |
| Entrez ID | Symbol | Replicates | Species | Organ | Tissue | Adj P-value | Log2FC | Malignancy |
| 54494 | C11orf71 | LZE4T | Human | Esophagus | ESCC | 1.03e-03 | 9.96e-02 | 0.0811 |
| 54494 | C11orf71 | LZE24T | Human | Esophagus | ESCC | 2.36e-25 | 6.44e-01 | 0.0596 |
| 54494 | C11orf71 | LZE6T | Human | Esophagus | ESCC | 6.71e-05 | 1.27e-01 | 0.0845 |
| 54494 | C11orf71 | P2T-E | Human | Esophagus | ESCC | 3.70e-14 | 1.39e-01 | 0.1177 |
| 54494 | C11orf71 | P4T-E | Human | Esophagus | ESCC | 8.53e-21 | 6.21e-01 | 0.1323 |
| 54494 | C11orf71 | P5T-E | Human | Esophagus | ESCC | 1.48e-18 | 1.10e-01 | 0.1327 |
| 54494 | C11orf71 | P8T-E | Human | Esophagus | ESCC | 4.53e-04 | 5.56e-02 | 0.0889 |
| 54494 | C11orf71 | P9T-E | Human | Esophagus | ESCC | 2.30e-10 | 1.85e-01 | 0.1131 |
| 54494 | C11orf71 | P10T-E | Human | Esophagus | ESCC | 1.64e-12 | 1.29e-01 | 0.116 |
| 54494 | C11orf71 | P12T-E | Human | Esophagus | ESCC | 1.49e-23 | 4.37e-01 | 0.1122 |
| 54494 | C11orf71 | P15T-E | Human | Esophagus | ESCC | 7.78e-04 | 1.48e-01 | 0.1149 |
| 54494 | C11orf71 | P16T-E | Human | Esophagus | ESCC | 3.16e-15 | 1.80e-01 | 0.1153 |
| 54494 | C11orf71 | P20T-E | Human | Esophagus | ESCC | 1.58e-03 | 4.07e-02 | 0.1124 |
| 54494 | C11orf71 | P21T-E | Human | Esophagus | ESCC | 4.69e-20 | 4.58e-01 | 0.1617 |
| 54494 | C11orf71 | P22T-E | Human | Esophagus | ESCC | 1.52e-19 | 2.32e-01 | 0.1236 |
| 54494 | C11orf71 | P23T-E | Human | Esophagus | ESCC | 4.74e-11 | 1.63e-01 | 0.108 |
| 54494 | C11orf71 | P24T-E | Human | Esophagus | ESCC | 2.89e-05 | 4.32e-02 | 0.1287 |
| 54494 | C11orf71 | P26T-E | Human | Esophagus | ESCC | 1.16e-30 | 6.18e-01 | 0.1276 |
| 54494 | C11orf71 | P27T-E | Human | Esophagus | ESCC | 7.01e-13 | 1.86e-01 | 0.1055 |
| 54494 | C11orf71 | P28T-E | Human | Esophagus | ESCC | 3.56e-11 | 1.27e-01 | 0.1149 |
| Page: 1 2 3 |
| Tissue | Expression Dynamics | Abbreviation |
| Esophagus | 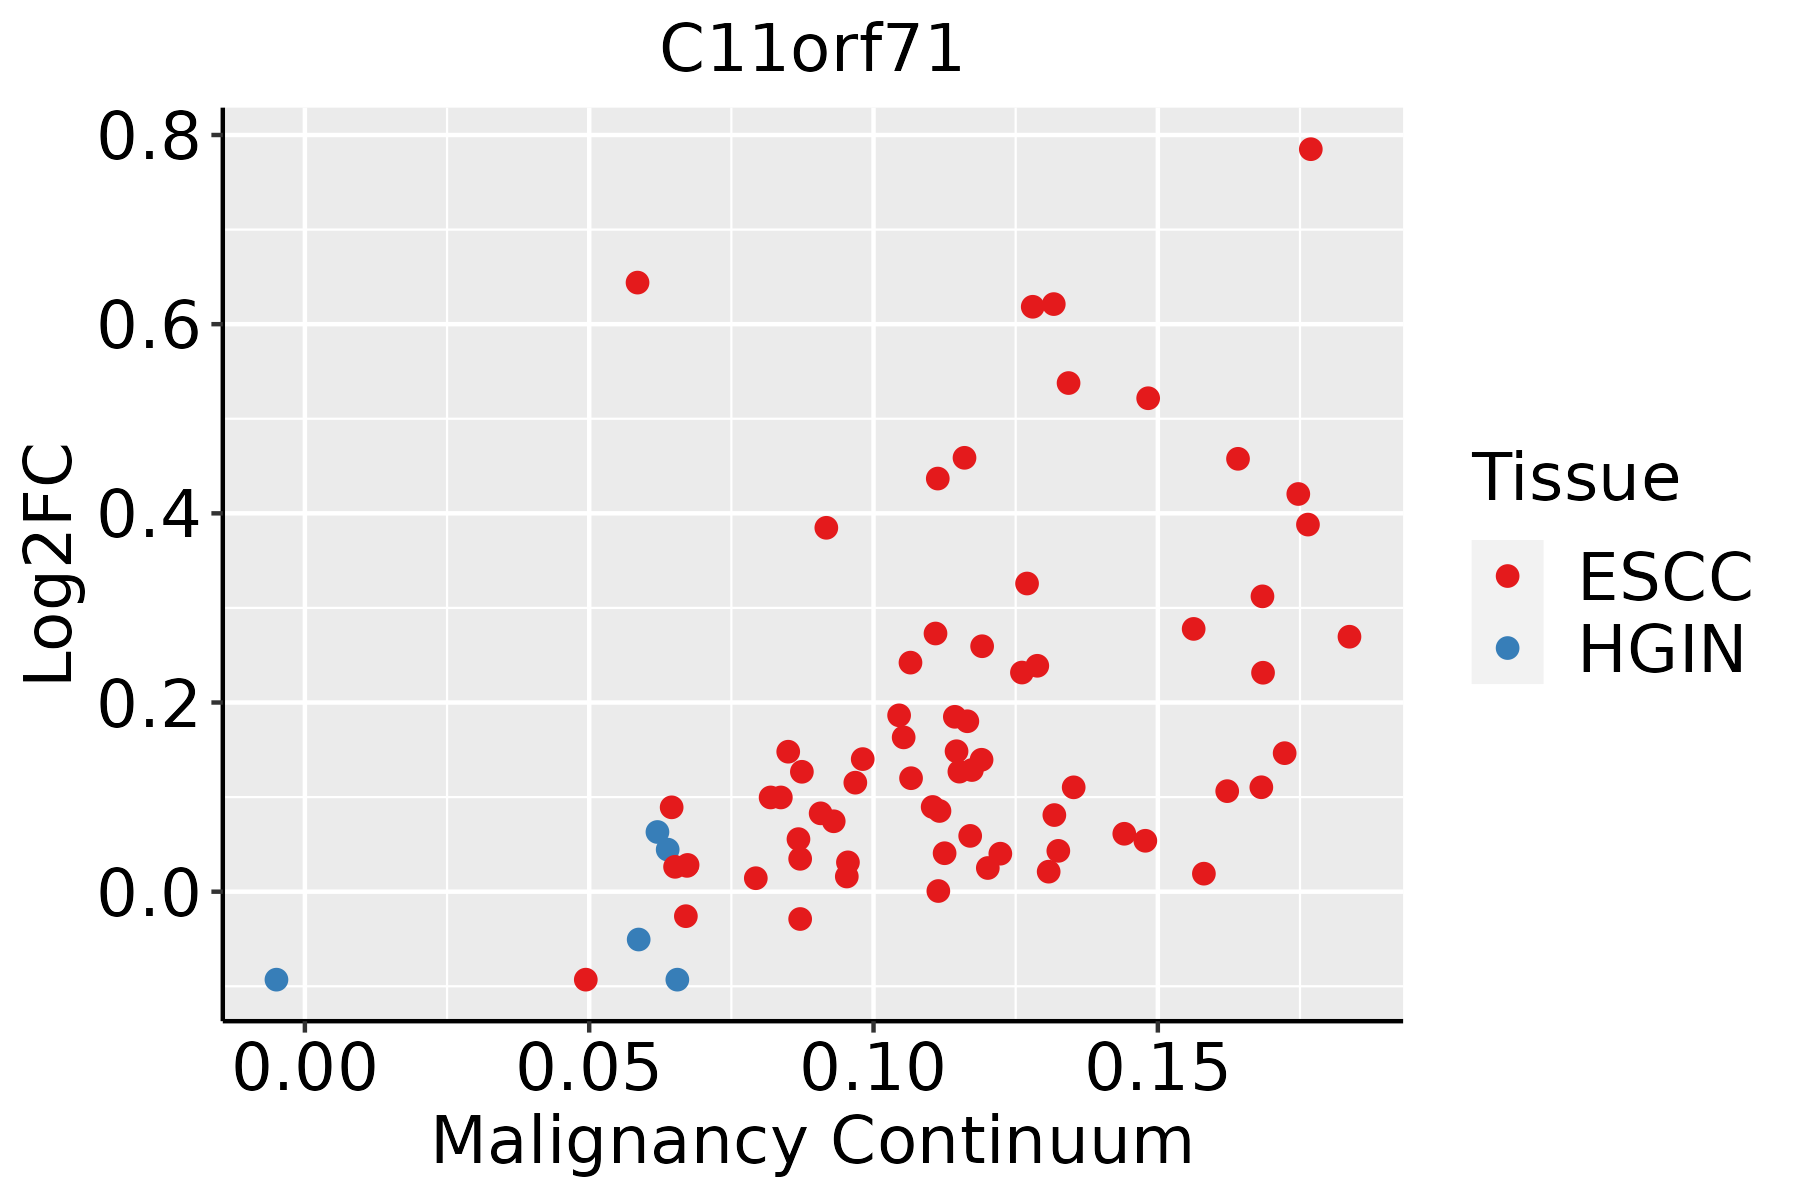 | ESCC: Esophageal squamous cell carcinoma |
| HGIN: High-grade intraepithelial neoplasias | ||
| LGIN: Low-grade intraepithelial neoplasias | ||
| Liver |  | HCC: Hepatocellular carcinoma |
| NAFLD: Non-alcoholic fatty liver disease |
| ∗log2FC in expression of this searched gene in stem-like cells from each diseased tissue sample relative to stem-like cells in normal samples in each tissue plotted against the malignancy continuum. Samples are colored based on if they are from different disease stage. |
Top |
Malignant transformation related pathway analysis |
| Find out the enriched GO biological processes and KEGG pathways involved in transition from healthy to precancer to cancer |
| Tissue | Disease Stage | Enriched GO biological Processes |
| Colorectum | AD |  |
| Colorectum | SER |  |
| Colorectum | MSS |  |
| Colorectum | MSI-H |  |
| Colorectum | FAP |  |
| ∗Top 15 enriched GO BP terms are showed in the bar plot of each disease state in each tissue. Each row represents a significant GO biological process which is colored according to the -log10(p.adjust). |
| Page: 1 2 3 4 5 6 7 8 9 |
| GO ID | Tissue | Disease Stage | Description | Gene Ratio | Bg Ratio | pvalue | p.adjust | Count |
| Page: 1 |
| Pathway ID | Tissue | Disease Stage | Description | Gene Ratio | Bg Ratio | pvalue | p.adjust | qvalue | Count |
| Page: 1 |
Top |
Cell-cell communication analysis |
| Identification of potential cell-cell interactions between two cell types and their ligand-receptor pairs for different disease states |
| Ligand | Receptor | LRpair | Pathway | Tissue | Disease Stage |
| Page: 1 |
Top |
Single-cell gene regulatory network inference analysis |
| Find out the significant the regulons (TFs) and the target genes of each regulon across cell types for different disease states |
| TF | Cell Type | Tissue | Disease Stage | Target Gene | RSS | Regulon Activity |
| ∗The dot plots of a searched regulon are shown for all cell subpopulations in each disease state of each tissue based on the regulon specific score inferred using pySCENIC and by calculating the average expression. |
| Page: 1 |
Top |
Somatic mutation of malignant transformation related genes |
| Annotation of somatic variants for genes involved in malignant transformation |
| Hugo Symbol | Variant Class | Variant Classification | dbSNP RS | HGVSc | HGVSp | HGVSp Short | SWISSPROT | BIOTYPE | SIFT | PolyPhen | Tumor Sample Barcode | Tissue | Histology | Sex | Age | Stage | Therapy Types | Drugs | Outcome |
| C11orf71 | SNV | Missense_Mutation | c.301N>A | p.Leu101Ile | p.L101I | Q6IPW1 | protein_coding | deleterious_low_confidence(0.01) | probably_damaging(0.935) | TCGA-BH-A18G-01 | Breast | breast invasive carcinoma | Female | >=65 | I/II | Unknown | Unknown | SD | |
| C11orf71 | SNV | Missense_Mutation | rs561777897 | c.137N>T | p.Pro46Leu | p.P46L | Q6IPW1 | protein_coding | tolerated_low_confidence(0.07) | benign(0.329) | TCGA-2W-A8YY-01 | Cervix | cervical & endocervical cancer | Female | <65 | I/II | Chemotherapy | cisplatin | CR |
| C11orf71 | SNV | Missense_Mutation | rs754770643 | c.287N>T | p.Ala96Val | p.A96V | Q6IPW1 | protein_coding | deleterious_low_confidence(0.02) | benign(0.201) | TCGA-VS-A9UJ-01 | Cervix | cervical & endocervical cancer | Female | <65 | I/II | Unknown | Unknown | PD |
| C11orf71 | SNV | Missense_Mutation | c.251N>A | p.Ser84Asn | p.S84N | Q6IPW1 | protein_coding | tolerated_low_confidence(0.14) | benign(0.031) | TCGA-AA-A010-01 | Colorectum | colon adenocarcinoma | Female | <65 | I/II | Chemotherapy | folinic | CR | |
| C11orf71 | SNV | Missense_Mutation | novel | c.62N>A | p.Ser21Tyr | p.S21Y | Q6IPW1 | protein_coding | tolerated_low_confidence(0.13) | benign(0.246) | TCGA-A5-A0G2-01 | Endometrium | uterine corpus endometrioid carcinoma | Female | <65 | III/IV | Unknown | Unknown | SD |
| C11orf71 | SNV | Missense_Mutation | rs1051890 | c.235G>A | p.Asp79Asn | p.D79N | Q6IPW1 | protein_coding | tolerated_low_confidence(0.18) | possibly_damaging(0.484) | TCGA-A5-A2K2-01 | Endometrium | uterine corpus endometrioid carcinoma | Female | >=65 | I/II | Chemotherapy | taxol | SD |
| C11orf71 | SNV | Missense_Mutation | novel | c.202N>T | p.Val68Leu | p.V68L | Q6IPW1 | protein_coding | tolerated_low_confidence(0.62) | benign(0.001) | TCGA-B5-A1MX-01 | Endometrium | uterine corpus endometrioid carcinoma | Female | <65 | I/II | Hormone Therapy | megace | SD |
| C11orf71 | SNV | Missense_Mutation | novel | c.167C>T | p.Ala56Val | p.A56V | Q6IPW1 | protein_coding | deleterious_low_confidence(0.02) | benign(0.438) | TCGA-E6-A2P8-01 | Endometrium | uterine corpus endometrioid carcinoma | Female | <65 | III/IV | Unknown | Unknown | PD |
| C11orf71 | SNV | Missense_Mutation | c.46N>T | p.Arg16Trp | p.R16W | Q6IPW1 | protein_coding | tolerated_low_confidence(0.1) | benign(0.085) | TCGA-MI-A75G-01 | Liver | liver hepatocellular carcinoma | Male | <65 | I/II | Unknown | Unknown | SD | |
| C11orf71 | SNV | Missense_Mutation | novel | c.235G>T | p.Asp79Tyr | p.D79Y | Q6IPW1 | protein_coding | deleterious_low_confidence(0.01) | possibly_damaging(0.865) | TCGA-86-6851-01 | Lung | lung adenocarcinoma | Female | >=65 | I/II | Unknown | Unknown | SD |
| Page: 1 2 |
Top |
Related drugs of malignant transformation related genes |
| Identification of chemicals and drugs interact with genes involved in malignant transfromation |
| (DGIdb 4.0) |
| Entrez ID | Symbol | Category | Interaction Types | Drug Claim Name | Drug Name | PMIDs |
| Page: 1 |

Copyright 2023-Present -The University of Texas Health Science Center at Houston |