
|
|||||
|
 | |
| |
| |
| |
| |
| |
|
Gene: C11orf68 |
Gene summary for C11ORF68 |
| Gene information | Species | Human | Gene symbol | C11orf68 | Gene ID | 83638 |
| Gene name | chromosome 11 open reading frame 68 | |
| Gene Alias | BLES03 | |
| Cytomap | 11q13.1 | |
| Gene Type | protein-coding | GO ID | GO:0003674 | UniProtAcc | Q9H3H3 |
Top |
Malignant transformation analysis |
| Identification of the aberrant gene expression in precancerous and cancerous lesions by comparing the gene expression of stem-like cells in diseased tissues with normal stem cells |
| Entrez ID | Symbol | Replicates | Species | Organ | Tissue | Adj P-value | Log2FC | Malignancy |
| 83638 | C11orf68 | LZE20T | Human | Esophagus | ESCC | 3.03e-05 | 7.78e-02 | 0.0662 |
| 83638 | C11orf68 | LZE24T | Human | Esophagus | ESCC | 1.77e-05 | 1.15e-01 | 0.0596 |
| 83638 | C11orf68 | P2T-E | Human | Esophagus | ESCC | 3.60e-06 | 2.56e-02 | 0.1177 |
| 83638 | C11orf68 | P4T-E | Human | Esophagus | ESCC | 4.34e-10 | 2.00e-01 | 0.1323 |
| 83638 | C11orf68 | P5T-E | Human | Esophagus | ESCC | 1.64e-08 | 5.83e-02 | 0.1327 |
| 83638 | C11orf68 | P8T-E | Human | Esophagus | ESCC | 1.74e-13 | 7.28e-02 | 0.0889 |
| 83638 | C11orf68 | P9T-E | Human | Esophagus | ESCC | 7.34e-06 | 4.46e-02 | 0.1131 |
| 83638 | C11orf68 | P10T-E | Human | Esophagus | ESCC | 6.06e-09 | 9.40e-02 | 0.116 |
| 83638 | C11orf68 | P11T-E | Human | Esophagus | ESCC | 4.59e-08 | 1.25e-01 | 0.1426 |
| 83638 | C11orf68 | P12T-E | Human | Esophagus | ESCC | 7.34e-05 | 6.27e-02 | 0.1122 |
| 83638 | C11orf68 | P15T-E | Human | Esophagus | ESCC | 4.05e-13 | 5.43e-02 | 0.1149 |
| 83638 | C11orf68 | P16T-E | Human | Esophagus | ESCC | 1.16e-05 | 1.55e-02 | 0.1153 |
| 83638 | C11orf68 | P20T-E | Human | Esophagus | ESCC | 1.94e-07 | 3.60e-02 | 0.1124 |
| 83638 | C11orf68 | P21T-E | Human | Esophagus | ESCC | 1.00e-13 | 1.70e-01 | 0.1617 |
| 83638 | C11orf68 | P22T-E | Human | Esophagus | ESCC | 2.26e-06 | 4.69e-02 | 0.1236 |
| 83638 | C11orf68 | P23T-E | Human | Esophagus | ESCC | 2.77e-12 | 2.32e-01 | 0.108 |
| 83638 | C11orf68 | P24T-E | Human | Esophagus | ESCC | 3.34e-10 | 3.18e-02 | 0.1287 |
| 83638 | C11orf68 | P26T-E | Human | Esophagus | ESCC | 5.27e-04 | 1.03e-02 | 0.1276 |
| 83638 | C11orf68 | P27T-E | Human | Esophagus | ESCC | 1.72e-06 | 1.14e-02 | 0.1055 |
| 83638 | C11orf68 | P28T-E | Human | Esophagus | ESCC | 2.15e-12 | 2.26e-01 | 0.1149 |
| Page: 1 2 3 4 |
| Tissue | Expression Dynamics | Abbreviation |
| Esophagus | 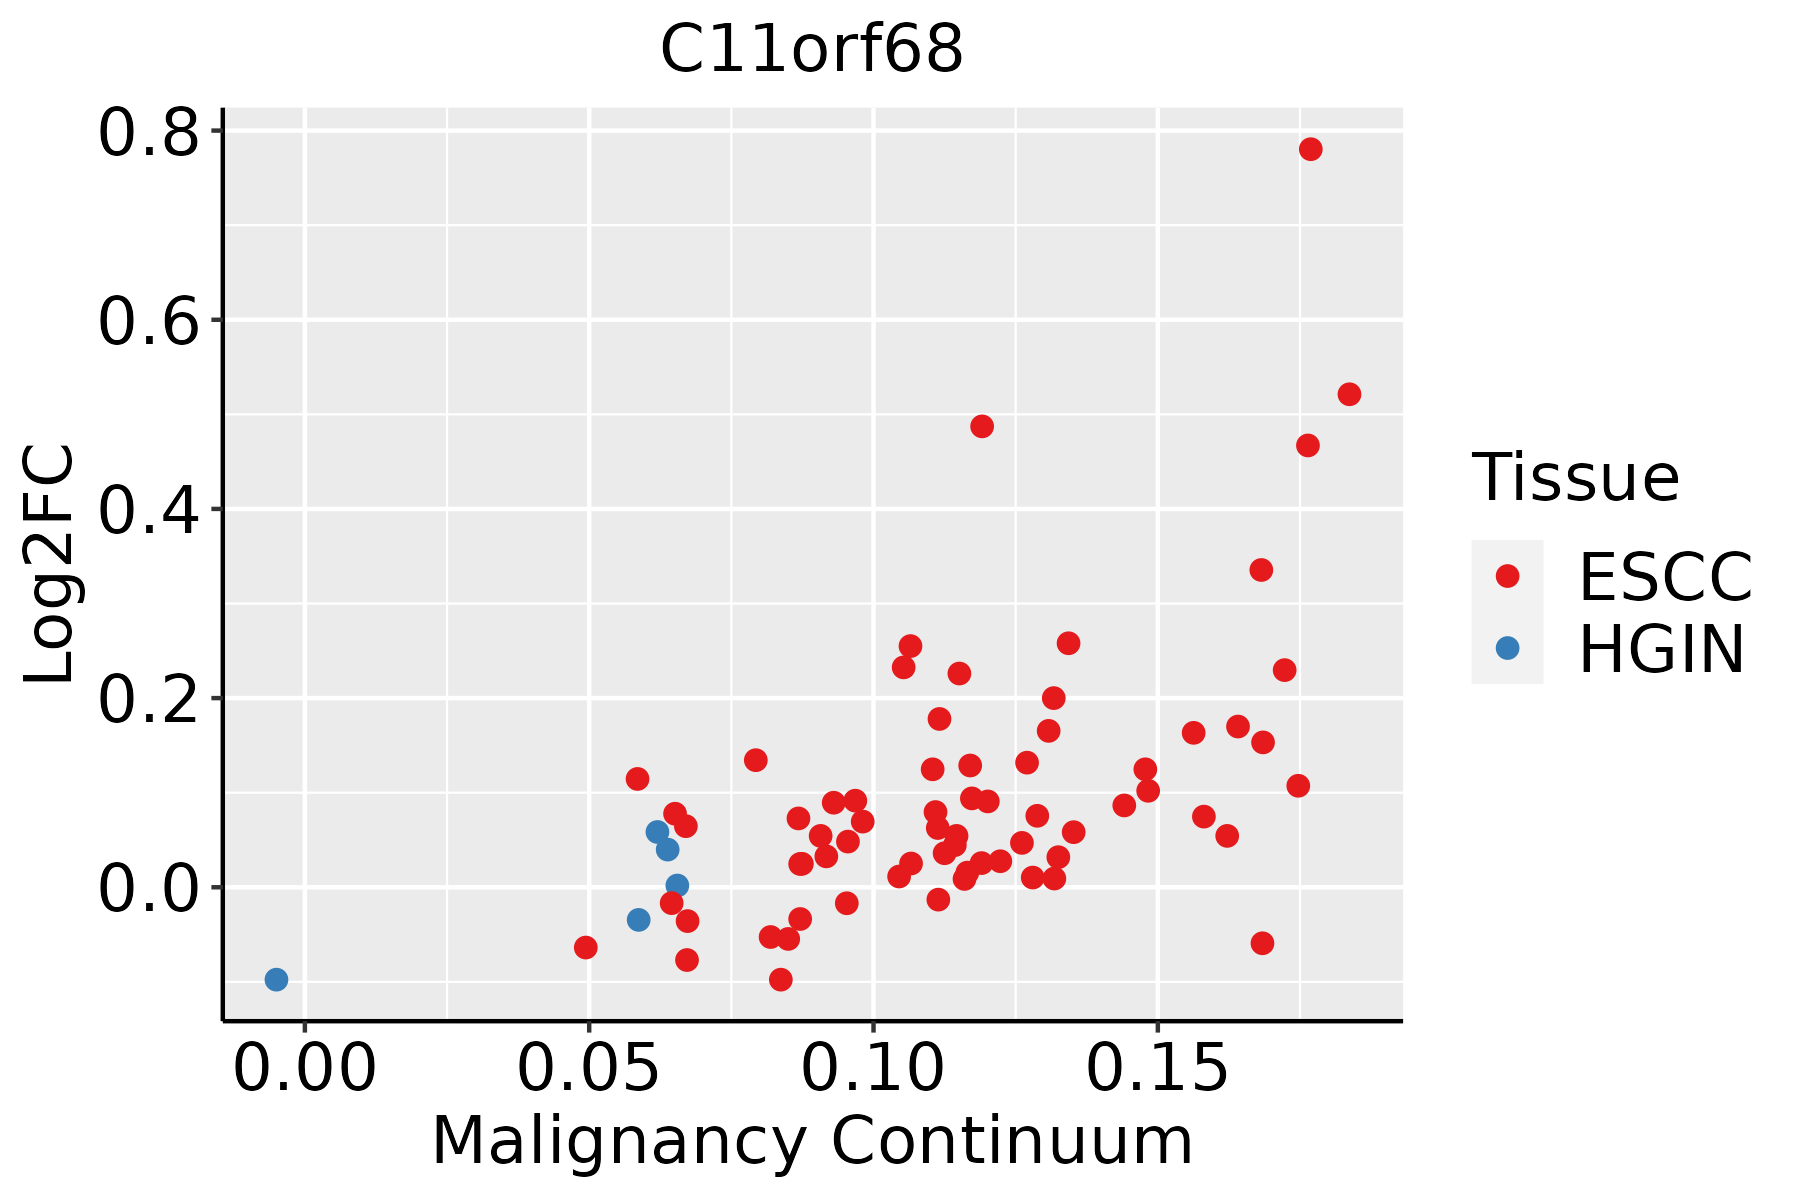 | ESCC: Esophageal squamous cell carcinoma |
| HGIN: High-grade intraepithelial neoplasias | ||
| LGIN: Low-grade intraepithelial neoplasias | ||
| Liver |  | HCC: Hepatocellular carcinoma |
| NAFLD: Non-alcoholic fatty liver disease | ||
| Oral Cavity | 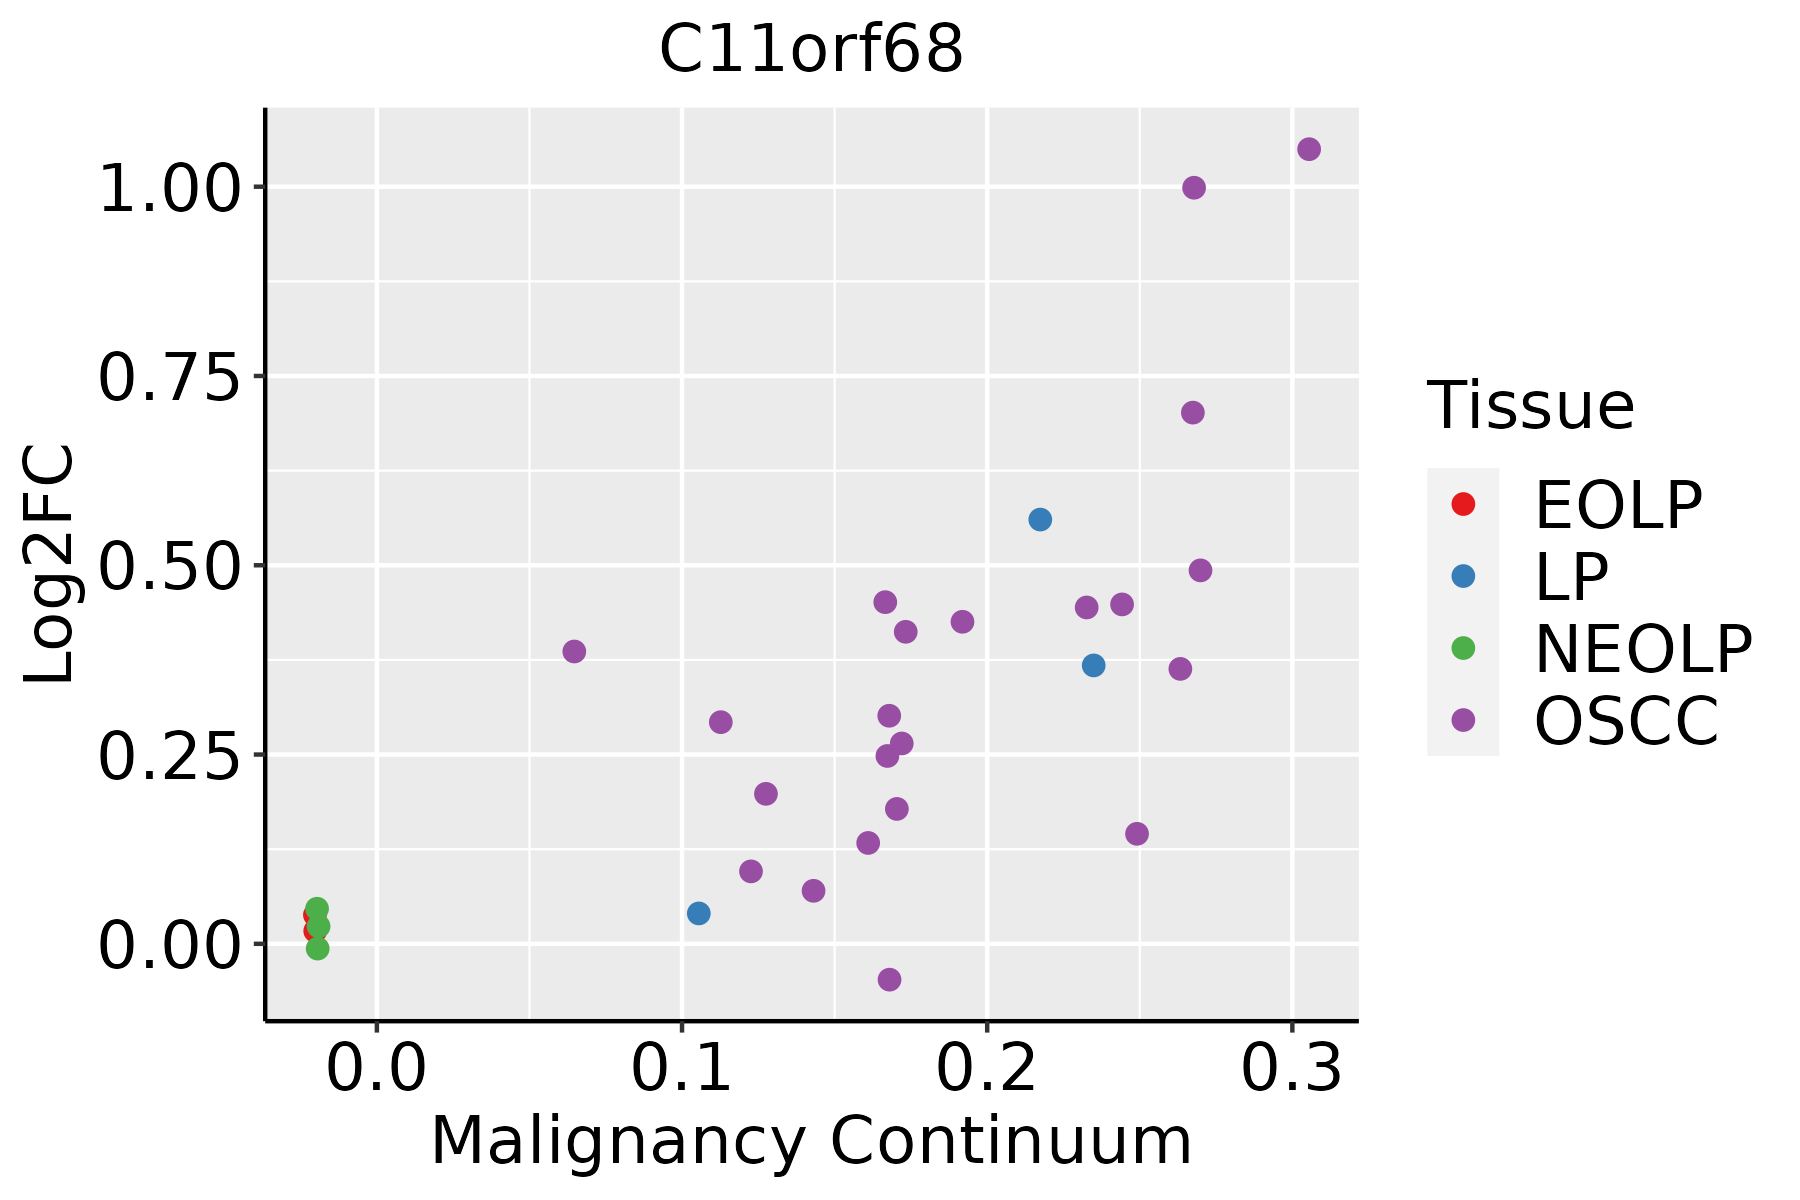 | EOLP: Erosive Oral lichen planus |
| LP: leukoplakia | ||
| NEOLP: Non-erosive oral lichen planus | ||
| OSCC: Oral squamous cell carcinoma |
| ∗log2FC in expression of this searched gene in stem-like cells from each diseased tissue sample relative to stem-like cells in normal samples in each tissue plotted against the malignancy continuum. Samples are colored based on if they are from different disease stage. |
Top |
Malignant transformation related pathway analysis |
| Find out the enriched GO biological processes and KEGG pathways involved in transition from healthy to precancer to cancer |
| Tissue | Disease Stage | Enriched GO biological Processes |
| Colorectum | AD |  |
| Colorectum | SER |  |
| Colorectum | MSS |  |
| Colorectum | MSI-H |  |
| Colorectum | FAP |  |
| ∗Top 15 enriched GO BP terms are showed in the bar plot of each disease state in each tissue. Each row represents a significant GO biological process which is colored according to the -log10(p.adjust). |
| Page: 1 2 3 4 5 6 7 8 9 |
| GO ID | Tissue | Disease Stage | Description | Gene Ratio | Bg Ratio | pvalue | p.adjust | Count |
| Page: 1 |
| Pathway ID | Tissue | Disease Stage | Description | Gene Ratio | Bg Ratio | pvalue | p.adjust | qvalue | Count |
| Page: 1 |
Top |
Cell-cell communication analysis |
| Identification of potential cell-cell interactions between two cell types and their ligand-receptor pairs for different disease states |
| Ligand | Receptor | LRpair | Pathway | Tissue | Disease Stage |
| Page: 1 |
Top |
Single-cell gene regulatory network inference analysis |
| Find out the significant the regulons (TFs) and the target genes of each regulon across cell types for different disease states |
| TF | Cell Type | Tissue | Disease Stage | Target Gene | RSS | Regulon Activity |
| ∗The dot plots of a searched regulon are shown for all cell subpopulations in each disease state of each tissue based on the regulon specific score inferred using pySCENIC and by calculating the average expression. |
| Page: 1 |
Top |
Somatic mutation of malignant transformation related genes |
| Annotation of somatic variants for genes involved in malignant transformation |
| Hugo Symbol | Variant Class | Variant Classification | dbSNP RS | HGVSc | HGVSp | HGVSp Short | SWISSPROT | BIOTYPE | SIFT | PolyPhen | Tumor Sample Barcode | Tissue | Histology | Sex | Age | Stage | Therapy Types | Drugs | Outcome |
| C11orf68 | deletion | Frame_Shift_Del | novel | c.485delT | p.Ile162ThrfsTer41 | p.I162Tfs*41 | Q9H3H3 | protein_coding | TCGA-EW-A2FV-01 | Breast | breast invasive carcinoma | Female | <65 | III/IV | Chemotherapy | docetaxel | SD | ||
| C11orf68 | deletion | Frame_Shift_Del | novel | c.158delG | p.Gly53AlafsTer28 | p.G53Afs*28 | Q9H3H3 | protein_coding | TCGA-EW-A2FV-01 | Breast | breast invasive carcinoma | Female | <65 | III/IV | Chemotherapy | docetaxel | SD | ||
| C11orf68 | SNV | Missense_Mutation | c.592N>G | p.Gln198Glu | p.Q198E | Q9H3H3 | protein_coding | tolerated(0.81) | benign(0.257) | TCGA-IR-A3LI-01 | Cervix | cervical & endocervical cancer | Female | <65 | I/II | Chemotherapy | cisplatin | CR | |
| C11orf68 | insertion | In_Frame_Ins | novel | c.192_193insCGA | p.Ala64_Glu65insArg | p.A64_E65insR | Q9H3H3 | protein_coding | TCGA-DS-A1OC-01 | Cervix | cervical & endocervical cancer | Female | <65 | I/II | Chemotherapy | gemcitabine | SD | ||
| C11orf68 | SNV | Missense_Mutation | c.476A>G | p.Gln159Arg | p.Q159R | Q9H3H3 | protein_coding | tolerated(0.34) | benign(0.005) | TCGA-D5-6927-01 | Colorectum | colon adenocarcinoma | Male | <65 | I/II | Unknown | Unknown | SD | |
| C11orf68 | SNV | Missense_Mutation | c.614N>A | p.Arg205His | p.R205H | Q9H3H3 | protein_coding | tolerated(0.54) | benign(0.003) | TCGA-G4-6317-01 | Colorectum | colon adenocarcinoma | Female | <65 | III/IV | Chemotherapy | fluorouracil | PD | |
| C11orf68 | SNV | Missense_Mutation | novel | c.868G>A | p.Val290Met | p.V290M | Q9H3H3 | protein_coding | tolerated_low_confidence(0.06) | benign(0.213) | TCGA-G4-6628-01 | Colorectum | colon adenocarcinoma | Male | >=65 | I/II | Unknown | Unknown | SD |
| C11orf68 | SNV | Missense_Mutation | rs763705751 | c.260N>T | p.Thr87Met | p.T87M | Q9H3H3 | protein_coding | tolerated(0.09) | benign(0.432) | TCGA-AJ-A3BG-01 | Endometrium | uterine corpus endometrioid carcinoma | Female | >=65 | I/II | Chemotherapy | carboplatin | PD |
| C11orf68 | SNV | Missense_Mutation | novel | c.191C>T | p.Ala64Val | p.A64V | Q9H3H3 | protein_coding | deleterious(0.02) | possibly_damaging(0.566) | TCGA-AJ-A3EL-01 | Endometrium | uterine corpus endometrioid carcinoma | Female | <65 | I/II | Unknown | Unknown | SD |
| C11orf68 | SNV | Missense_Mutation | novel | c.833N>T | p.Ala278Val | p.A278V | Q9H3H3 | protein_coding | deleterious_low_confidence(0.02) | benign(0) | TCGA-AP-A1DK-01 | Endometrium | uterine corpus endometrioid carcinoma | Female | <65 | I/II | Unknown | Unknown | SD |
| Page: 1 2 |
Top |
Related drugs of malignant transformation related genes |
| Identification of chemicals and drugs interact with genes involved in malignant transfromation |
| (DGIdb 4.0) |
| Entrez ID | Symbol | Category | Interaction Types | Drug Claim Name | Drug Name | PMIDs |
| Page: 1 |

Copyright 2023-Present -The University of Texas Health Science Center at Houston |