
|
|||||
|
 | |
| |
| |
| |
| |
| |
|
Gene: C11orf57 |
Gene summary for C11ORF57 |
| Gene information | Species | Human | Gene symbol | C11orf57 | Gene ID | 55216 |
| Gene name | NKAP domain containing 1 | |
| Gene Alias | C11orf57 | |
| Cytomap | 11q23.1 | |
| Gene Type | protein-coding | GO ID | GO:0003674 | UniProtAcc | A0A024R3H5 |
Top |
Malignant transformation analysis |
| Identification of the aberrant gene expression in precancerous and cancerous lesions by comparing the gene expression of stem-like cells in diseased tissues with normal stem cells |
| Entrez ID | Symbol | Replicates | Species | Organ | Tissue | Adj P-value | Log2FC | Malignancy |
| 55216 | C11orf57 | P2T-E | Human | Esophagus | ESCC | 4.29e-15 | 3.08e-01 | 0.1177 |
| 55216 | C11orf57 | P4T-E | Human | Esophagus | ESCC | 6.37e-32 | 7.02e-01 | 0.1323 |
| 55216 | C11orf57 | P5T-E | Human | Esophagus | ESCC | 7.68e-19 | 5.81e-01 | 0.1327 |
| 55216 | C11orf57 | P8T-E | Human | Esophagus | ESCC | 7.46e-15 | 1.07e-01 | 0.0889 |
| 55216 | C11orf57 | P9T-E | Human | Esophagus | ESCC | 5.40e-12 | 2.84e-01 | 0.1131 |
| 55216 | C11orf57 | P10T-E | Human | Esophagus | ESCC | 1.67e-19 | 4.26e-01 | 0.116 |
| 55216 | C11orf57 | P11T-E | Human | Esophagus | ESCC | 3.08e-03 | 3.62e-01 | 0.1426 |
| 55216 | C11orf57 | P12T-E | Human | Esophagus | ESCC | 4.53e-09 | 3.49e-01 | 0.1122 |
| 55216 | C11orf57 | P15T-E | Human | Esophagus | ESCC | 3.65e-07 | 1.65e-01 | 0.1149 |
| 55216 | C11orf57 | P16T-E | Human | Esophagus | ESCC | 1.47e-21 | 4.72e-01 | 0.1153 |
| 55216 | C11orf57 | P19T-E | Human | Esophagus | ESCC | 9.90e-04 | 2.79e-01 | 0.1662 |
| 55216 | C11orf57 | P20T-E | Human | Esophagus | ESCC | 5.63e-14 | 3.56e-01 | 0.1124 |
| 55216 | C11orf57 | P21T-E | Human | Esophagus | ESCC | 5.45e-20 | 4.92e-01 | 0.1617 |
| 55216 | C11orf57 | P22T-E | Human | Esophagus | ESCC | 1.77e-14 | 2.37e-01 | 0.1236 |
| 55216 | C11orf57 | P23T-E | Human | Esophagus | ESCC | 1.53e-12 | 2.97e-01 | 0.108 |
| 55216 | C11orf57 | P24T-E | Human | Esophagus | ESCC | 5.92e-09 | 1.86e-01 | 0.1287 |
| 55216 | C11orf57 | P26T-E | Human | Esophagus | ESCC | 1.71e-14 | 2.20e-01 | 0.1276 |
| 55216 | C11orf57 | P27T-E | Human | Esophagus | ESCC | 5.31e-12 | 3.20e-01 | 0.1055 |
| 55216 | C11orf57 | P28T-E | Human | Esophagus | ESCC | 8.80e-12 | 2.58e-01 | 0.1149 |
| 55216 | C11orf57 | P30T-E | Human | Esophagus | ESCC | 1.56e-22 | 6.71e-01 | 0.137 |
| Page: 1 2 3 4 |
| Tissue | Expression Dynamics | Abbreviation |
| Esophagus | 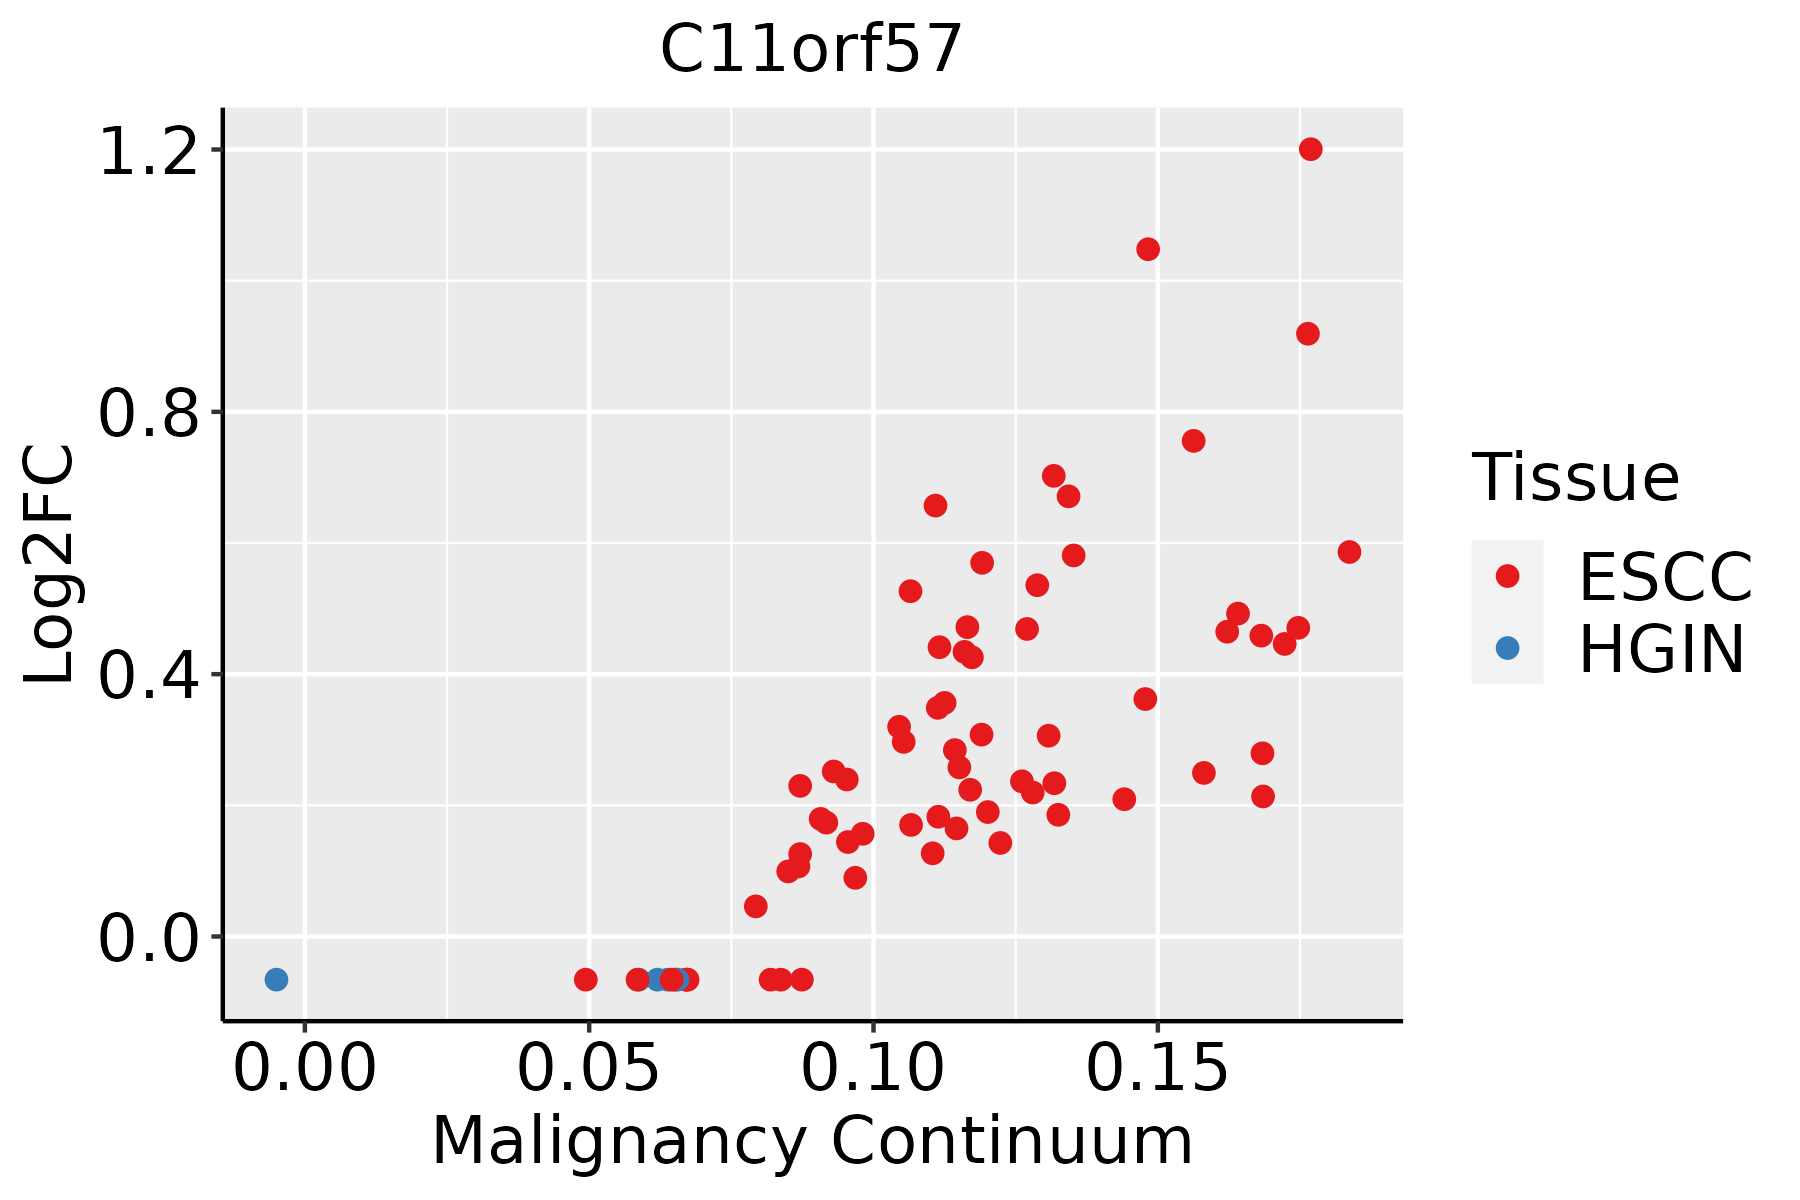 | ESCC: Esophageal squamous cell carcinoma |
| HGIN: High-grade intraepithelial neoplasias | ||
| LGIN: Low-grade intraepithelial neoplasias | ||
| Oral Cavity | 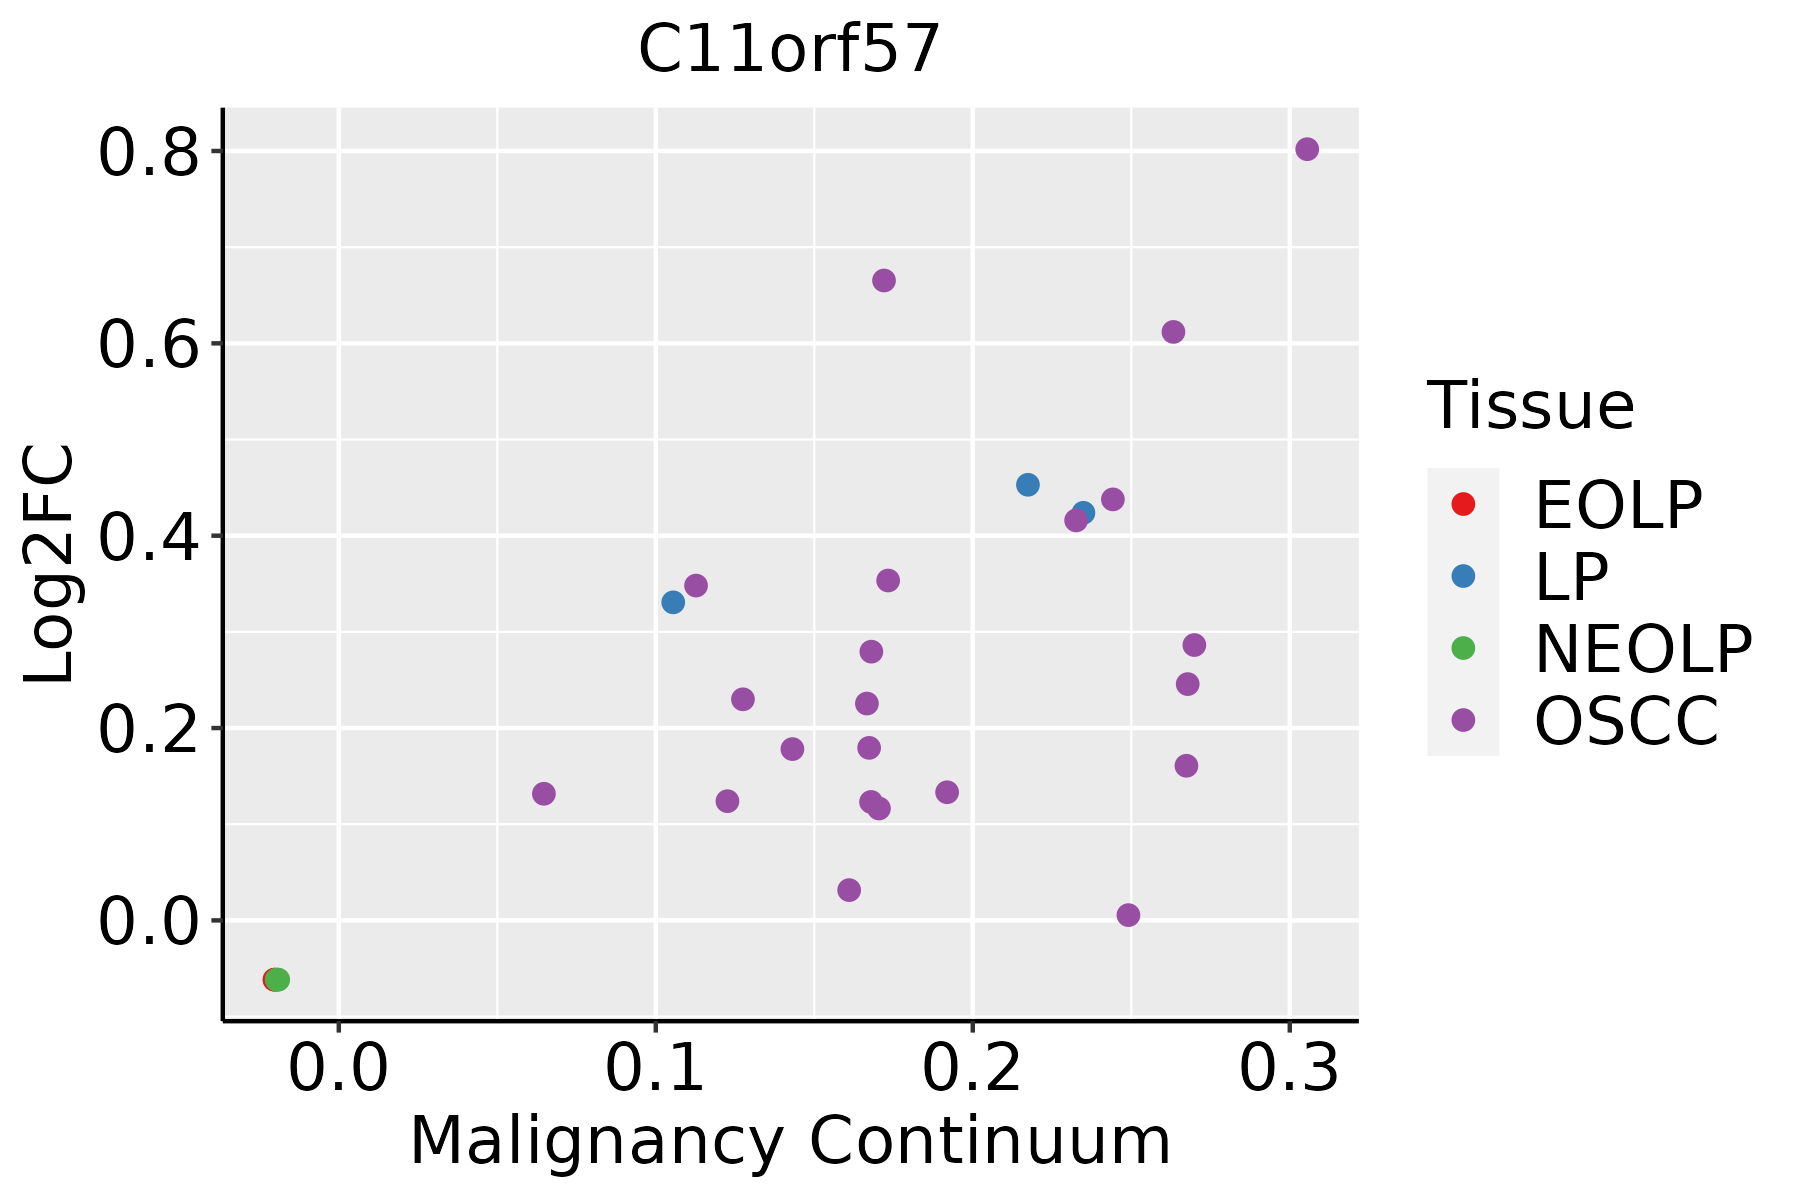 | EOLP: Erosive Oral lichen planus |
| LP: leukoplakia | ||
| NEOLP: Non-erosive oral lichen planus | ||
| OSCC: Oral squamous cell carcinoma |
| ∗log2FC in expression of this searched gene in stem-like cells from each diseased tissue sample relative to stem-like cells in normal samples in each tissue plotted against the malignancy continuum. Samples are colored based on if they are from different disease stage. |
Top |
Malignant transformation related pathway analysis |
| Find out the enriched GO biological processes and KEGG pathways involved in transition from healthy to precancer to cancer |
| Tissue | Disease Stage | Enriched GO biological Processes |
| Colorectum | AD |  |
| Colorectum | SER |  |
| Colorectum | MSS |  |
| Colorectum | MSI-H |  |
| Colorectum | FAP |  |
| ∗Top 15 enriched GO BP terms are showed in the bar plot of each disease state in each tissue. Each row represents a significant GO biological process which is colored according to the -log10(p.adjust). |
| Page: 1 2 3 4 5 6 7 8 9 |
| GO ID | Tissue | Disease Stage | Description | Gene Ratio | Bg Ratio | pvalue | p.adjust | Count |
| Page: 1 |
| Pathway ID | Tissue | Disease Stage | Description | Gene Ratio | Bg Ratio | pvalue | p.adjust | qvalue | Count |
| Page: 1 |
Top |
Cell-cell communication analysis |
| Identification of potential cell-cell interactions between two cell types and their ligand-receptor pairs for different disease states |
| Ligand | Receptor | LRpair | Pathway | Tissue | Disease Stage |
| Page: 1 |
Top |
Single-cell gene regulatory network inference analysis |
| Find out the significant the regulons (TFs) and the target genes of each regulon across cell types for different disease states |
| TF | Cell Type | Tissue | Disease Stage | Target Gene | RSS | Regulon Activity |
| ∗The dot plots of a searched regulon are shown for all cell subpopulations in each disease state of each tissue based on the regulon specific score inferred using pySCENIC and by calculating the average expression. |
| Page: 1 |
Top |
Somatic mutation of malignant transformation related genes |
| Annotation of somatic variants for genes involved in malignant transformation |
| Hugo Symbol | Variant Class | Variant Classification | dbSNP RS | HGVSc | HGVSp | HGVSp Short | SWISSPROT | BIOTYPE | SIFT | PolyPhen | Tumor Sample Barcode | Tissue | Histology | Sex | Age | Stage | Therapy Types | Drugs | Outcome |
| C11orf57 | insertion | Nonsense_Mutation | novel | c.278_279insAATAGCCTACTACT | p.Trp93Ter | p.W93* | Q6ZUT1 | protein_coding | TCGA-AN-A03X-01 | Breast | breast invasive carcinoma | Female | >=65 | I/II | Unknown | Unknown | SD | ||
| C11orf57 | insertion | Frame_Shift_Ins | novel | c.280_281insCTGAAAGCCATAGCGATACC | p.Asn94ThrfsTer55 | p.N94Tfs*55 | Q6ZUT1 | protein_coding | TCGA-AN-A03X-01 | Breast | breast invasive carcinoma | Female | >=65 | I/II | Unknown | Unknown | SD | ||
| C11orf57 | SNV | Missense_Mutation | c.110N>C | p.Glu37Ala | p.E37A | Q6ZUT1 | protein_coding | deleterious(0.02) | probably_damaging(0.996) | TCGA-C5-A1BN-01 | Cervix | cervical & endocervical cancer | Female | <65 | I/II | Chemotherapy | cisplatin | PD | |
| C11orf57 | SNV | Missense_Mutation | c.862N>C | p.Glu288Gln | p.E288Q | Q6ZUT1 | protein_coding | deleterious_low_confidence(0.02) | possibly_damaging(0.677) | TCGA-JW-A5VL-01 | Cervix | cervical & endocervical cancer | Female | <65 | I/II | Unknown | Unknown | SD | |
| C11orf57 | SNV | Missense_Mutation | novel | c.364N>C | p.Glu122Gln | p.E122Q | Q6ZUT1 | protein_coding | tolerated(0.08) | possibly_damaging(0.463) | TCGA-VS-A9UZ-01 | Cervix | cervical & endocervical cancer | Female | <65 | I/II | Unknown | Unknown | SD |
| C11orf57 | SNV | Missense_Mutation | c.682N>G | p.Thr228Ala | p.T228A | Q6ZUT1 | protein_coding | tolerated_low_confidence(0.57) | benign(0.003) | TCGA-AA-3663-01 | Colorectum | colon adenocarcinoma | Male | <65 | I/II | Unknown | Unknown | SD | |
| C11orf57 | SNV | Missense_Mutation | c.47N>A | p.Arg16Gln | p.R16Q | Q6ZUT1 | protein_coding | deleterious(0.05) | possibly_damaging(0.544) | TCGA-AA-A010-01 | Colorectum | colon adenocarcinoma | Female | <65 | I/II | Chemotherapy | folinic | CR | |
| C11orf57 | SNV | Missense_Mutation | novel | c.441N>C | p.Glu147Asp | p.E147D | Q6ZUT1 | protein_coding | tolerated(0.09) | possibly_damaging(0.861) | TCGA-CA-6717-01 | Colorectum | colon adenocarcinoma | Male | <65 | I/II | Chemotherapy | oxaliplatin | CR |
| C11orf57 | SNV | Missense_Mutation | rs370435297 | c.445C>T | p.Arg149Cys | p.R149C | Q6ZUT1 | protein_coding | deleterious(0.01) | benign(0.401) | TCGA-CM-5861-01 | Colorectum | colon adenocarcinoma | Female | <65 | I/II | Unknown | Unknown | PD |
| C11orf57 | SNV | Missense_Mutation | c.614N>C | p.Lys205Thr | p.K205T | Q6ZUT1 | protein_coding | tolerated_low_confidence(0.1) | probably_damaging(0.999) | TCGA-AG-3892-01 | Colorectum | rectum adenocarcinoma | Female | <65 | I/II | Unknown | Unknown | SD |
| Page: 1 2 3 4 |
Top |
Related drugs of malignant transformation related genes |
| Identification of chemicals and drugs interact with genes involved in malignant transfromation |
| (DGIdb 4.0) |
| Entrez ID | Symbol | Category | Interaction Types | Drug Claim Name | Drug Name | PMIDs |
| Page: 1 |

Copyright 2023-Present -The University of Texas Health Science Center at Houston |