
|
|||||
|
 | |
| |
| |
| |
| |
| |
|
Gene: C11orf54 |
Gene summary for C11ORF54 |
| Gene information | Species | Human | Gene symbol | C11orf54 | Gene ID | 28970 |
| Gene name | chromosome 11 open reading frame 54 | |
| Gene Alias | PTD012 | |
| Cytomap | 11q21 | |
| Gene Type | protein-coding | GO ID | GO:0005575 | UniProtAcc | A0A024R396 |
Top |
Malignant transformation analysis |
| Identification of the aberrant gene expression in precancerous and cancerous lesions by comparing the gene expression of stem-like cells in diseased tissues with normal stem cells |
| Entrez ID | Symbol | Replicates | Species | Organ | Tissue | Adj P-value | Log2FC | Malignancy |
| 28970 | C11orf54 | HTA11_3410_2000001011 | Human | Colorectum | AD | 4.20e-02 | 9.21e-02 | 0.0155 |
| 28970 | C11orf54 | HTA11_2487_2000001011 | Human | Colorectum | SER | 1.14e-02 | 1.35e-01 | -0.1808 |
| 28970 | C11orf54 | HTA11_1938_2000001011 | Human | Colorectum | AD | 2.86e-06 | 2.32e-01 | -0.0811 |
| 28970 | C11orf54 | HTA11_78_2000001011 | Human | Colorectum | AD | 7.41e-14 | 3.92e-01 | -0.1088 |
| 28970 | C11orf54 | HTA11_347_2000001011 | Human | Colorectum | AD | 1.81e-29 | 4.90e-01 | -0.1954 |
| 28970 | C11orf54 | HTA11_411_2000001011 | Human | Colorectum | SER | 4.01e-04 | 3.31e-01 | -0.2602 |
| 28970 | C11orf54 | HTA11_83_2000001011 | Human | Colorectum | SER | 1.60e-14 | 4.65e-01 | -0.1526 |
| 28970 | C11orf54 | HTA11_696_2000001011 | Human | Colorectum | AD | 4.46e-07 | 1.74e-01 | -0.1464 |
| 28970 | C11orf54 | HTA11_866_2000001011 | Human | Colorectum | AD | 4.28e-10 | 2.09e-01 | -0.1001 |
| 28970 | C11orf54 | HTA11_1391_2000001011 | Human | Colorectum | AD | 7.96e-09 | 2.44e-01 | -0.059 |
| 28970 | C11orf54 | HTA11_5212_2000001011 | Human | Colorectum | AD | 5.12e-05 | 2.59e-01 | -0.2061 |
| 28970 | C11orf54 | HTA11_546_2000001011 | Human | Colorectum | AD | 4.17e-02 | 1.52e-01 | -0.0842 |
| 28970 | C11orf54 | HTA11_7862_2000001011 | Human | Colorectum | AD | 4.79e-05 | 2.16e-01 | -0.0179 |
| 28970 | C11orf54 | HTA11_866_3004761011 | Human | Colorectum | AD | 1.36e-07 | 1.94e-01 | 0.096 |
| 28970 | C11orf54 | HTA11_4255_2000001011 | Human | Colorectum | SER | 3.40e-03 | 2.22e-01 | 0.0446 |
| 28970 | C11orf54 | HTA11_8622_2000001021 | Human | Colorectum | SER | 6.14e-04 | 2.05e-01 | 0.0528 |
| 28970 | C11orf54 | HTA11_7663_2000001011 | Human | Colorectum | SER | 7.26e-05 | 2.84e-01 | 0.0131 |
| 28970 | C11orf54 | HTA11_10623_2000001011 | Human | Colorectum | AD | 6.46e-07 | 2.81e-01 | -0.0177 |
| 28970 | C11orf54 | HTA11_6801_2000001011 | Human | Colorectum | SER | 1.85e-04 | 3.00e-01 | 0.0171 |
| 28970 | C11orf54 | HTA11_10711_2000001011 | Human | Colorectum | AD | 6.02e-03 | 1.35e-01 | 0.0338 |
| Page: 1 2 3 4 5 6 |
| Tissue | Expression Dynamics | Abbreviation |
| Colorectum (GSE201348) |  | FAP: Familial adenomatous polyposis |
| CRC: Colorectal cancer | ||
| Colorectum (HTA11) | 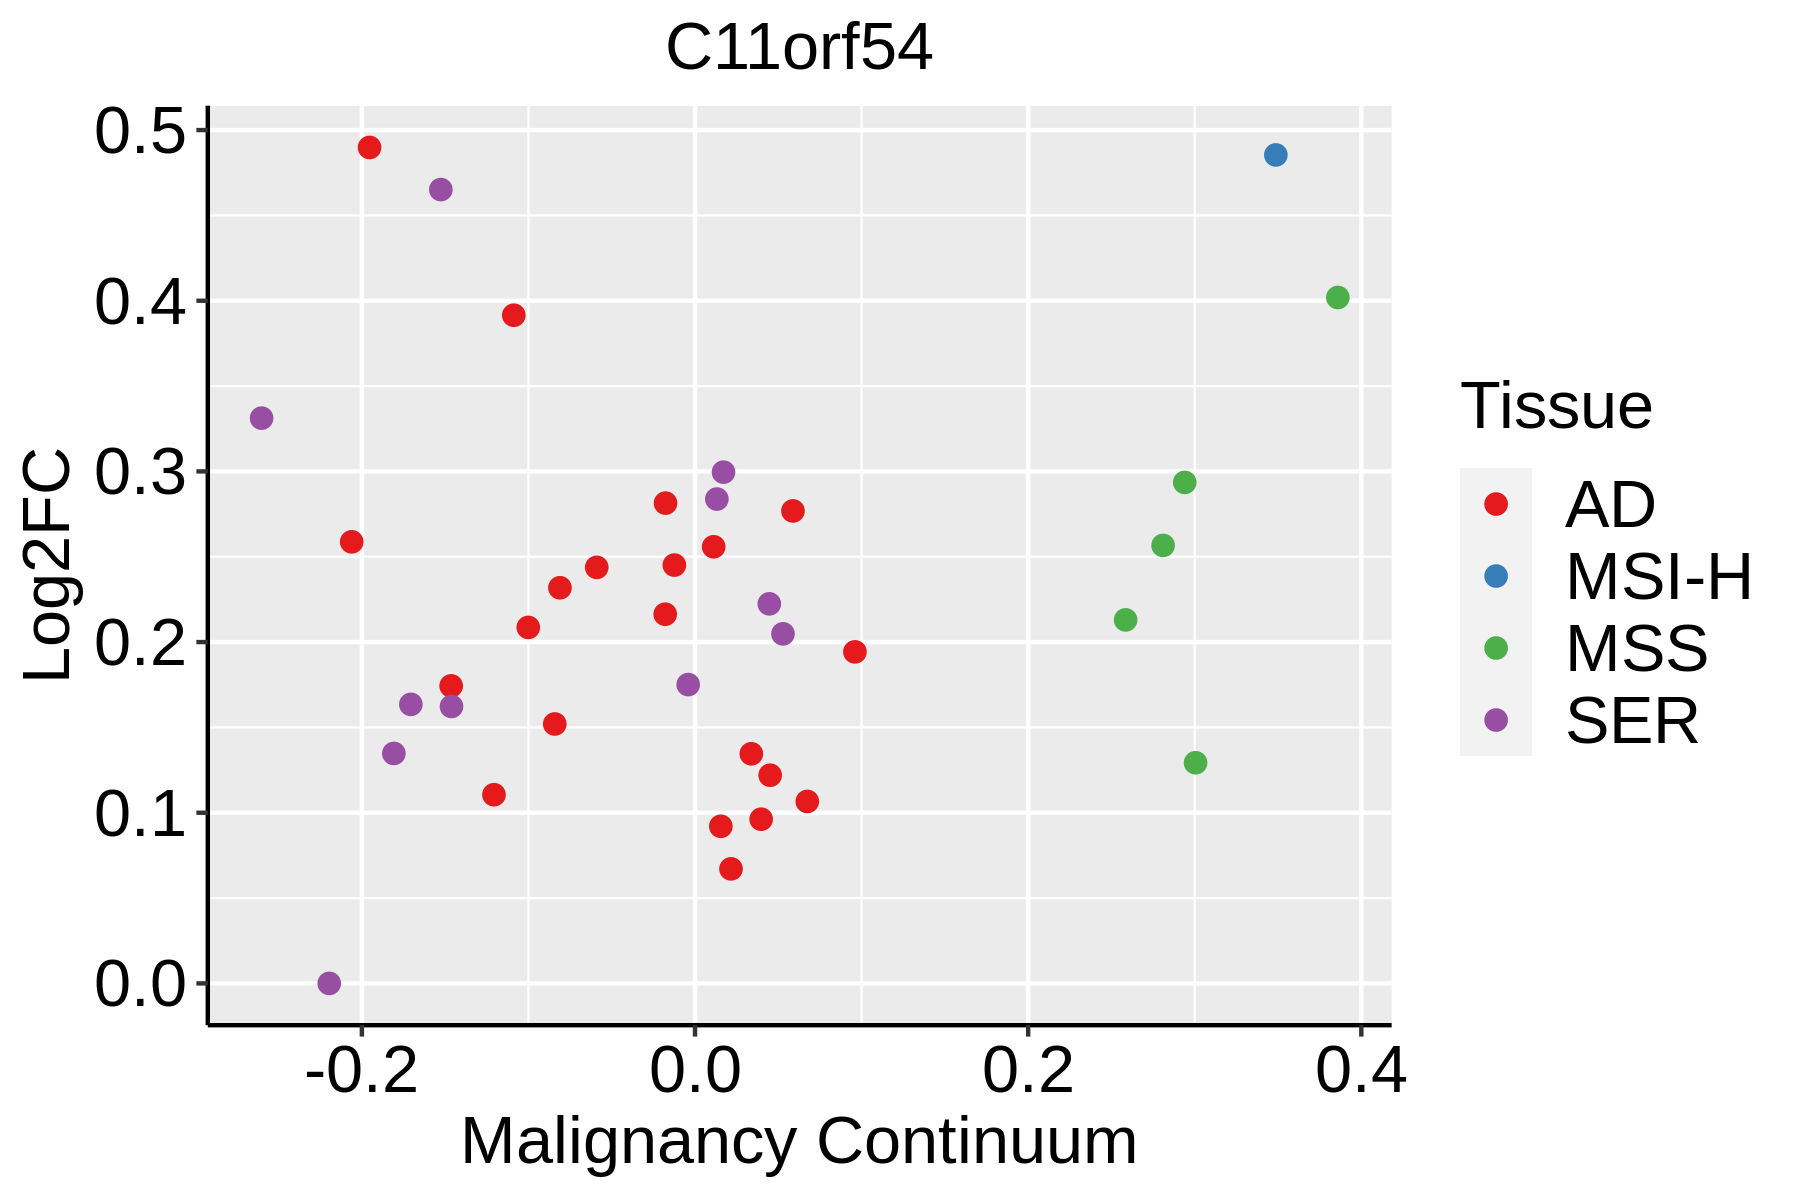 | AD: Adenomas |
| SER: Sessile serrated lesions | ||
| MSI-H: Microsatellite-high colorectal cancer | ||
| MSS: Microsatellite stable colorectal cancer | ||
| Esophagus | 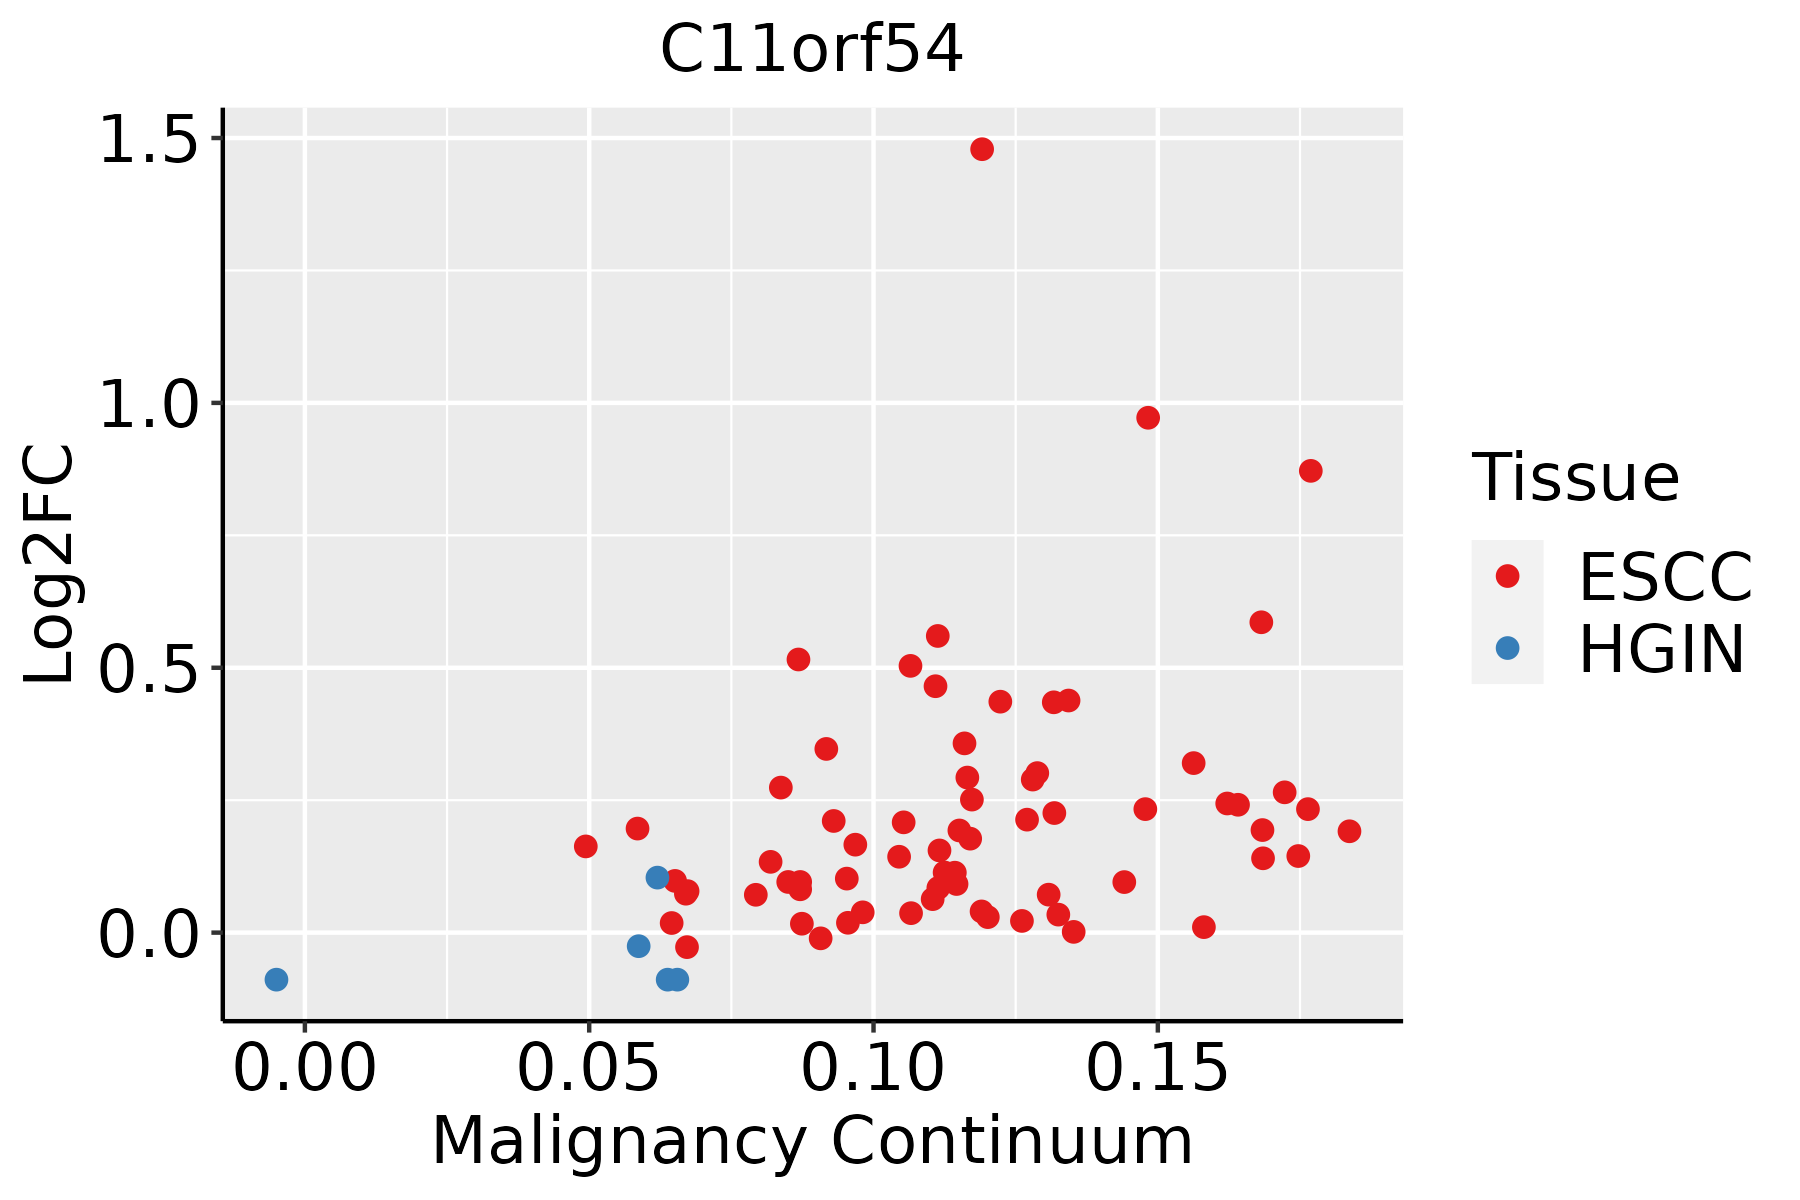 | ESCC: Esophageal squamous cell carcinoma |
| HGIN: High-grade intraepithelial neoplasias | ||
| LGIN: Low-grade intraepithelial neoplasias | ||
| Liver | 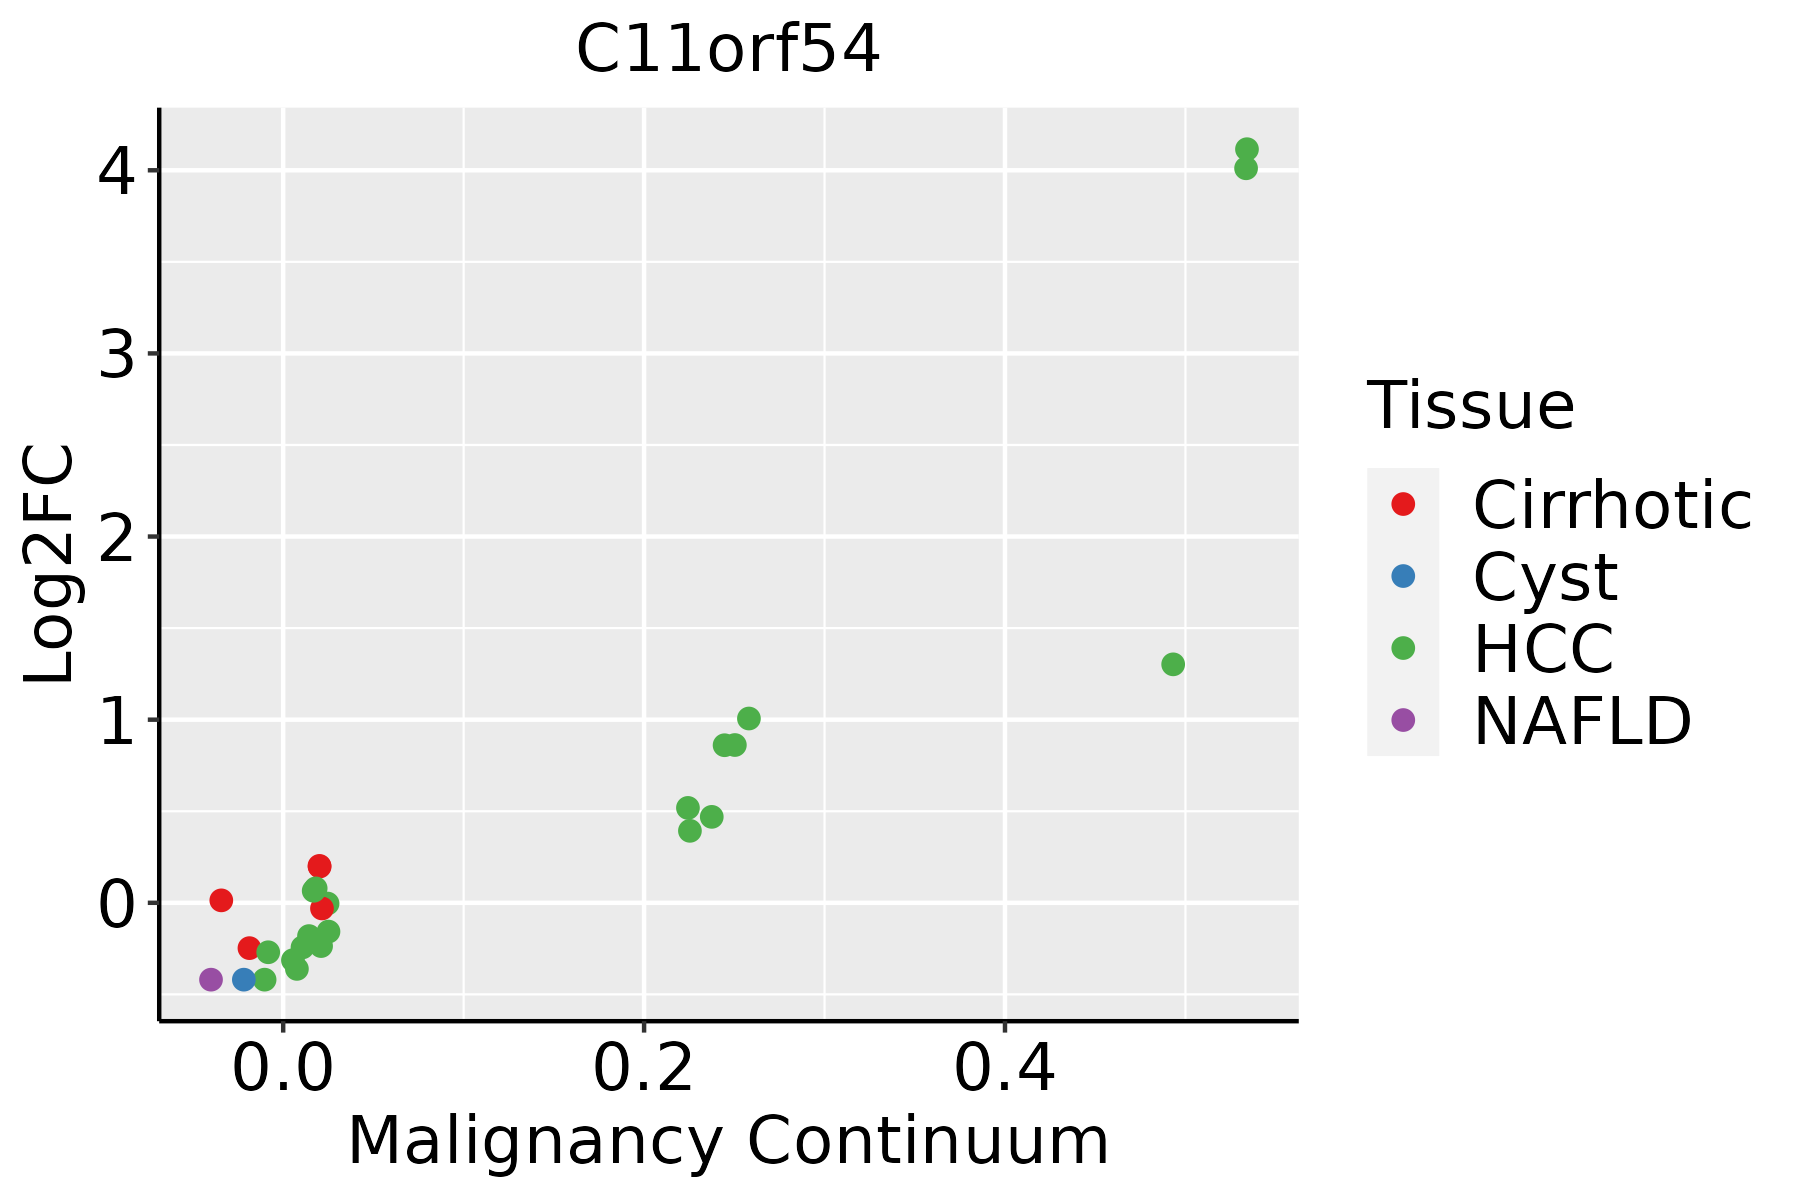 | HCC: Hepatocellular carcinoma |
| NAFLD: Non-alcoholic fatty liver disease | ||
| Thyroid | 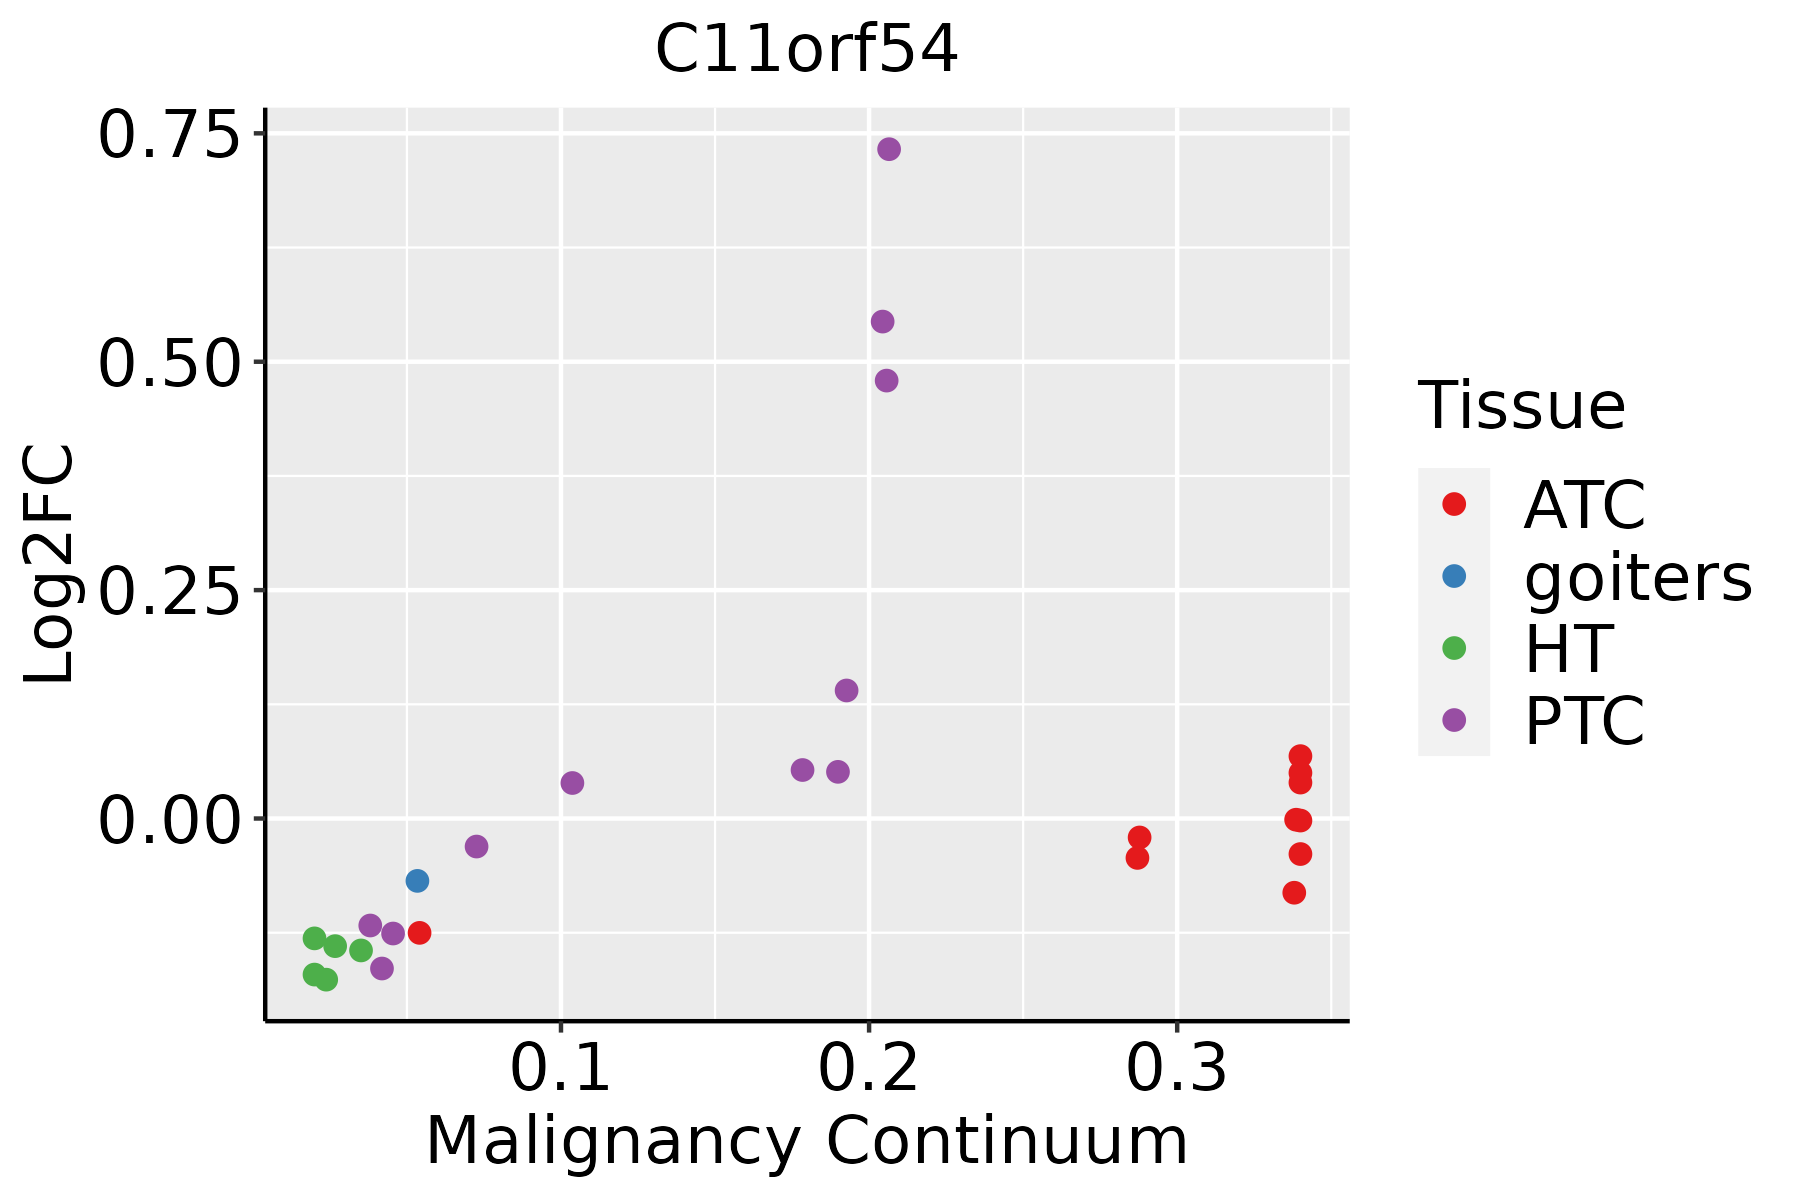 | ATC: Anaplastic thyroid cancer |
| HT: Hashimoto's thyroiditis | ||
| PTC: Papillary thyroid cancer |
| ∗log2FC in expression of this searched gene in stem-like cells from each diseased tissue sample relative to stem-like cells in normal samples in each tissue plotted against the malignancy continuum. Samples are colored based on if they are from different disease stage. |
Top |
Malignant transformation related pathway analysis |
| Find out the enriched GO biological processes and KEGG pathways involved in transition from healthy to precancer to cancer |
| Tissue | Disease Stage | Enriched GO biological Processes |
| Colorectum | AD |  |
| Colorectum | SER |  |
| Colorectum | MSS |  |
| Colorectum | MSI-H |  |
| Colorectum | FAP |  |
| ∗Top 15 enriched GO BP terms are showed in the bar plot of each disease state in each tissue. Each row represents a significant GO biological process which is colored according to the -log10(p.adjust). |
| Page: 1 2 3 4 5 6 7 8 9 |
| GO ID | Tissue | Disease Stage | Description | Gene Ratio | Bg Ratio | pvalue | p.adjust | Count |
| Page: 1 |
| Pathway ID | Tissue | Disease Stage | Description | Gene Ratio | Bg Ratio | pvalue | p.adjust | qvalue | Count |
| Page: 1 |
Top |
Cell-cell communication analysis |
| Identification of potential cell-cell interactions between two cell types and their ligand-receptor pairs for different disease states |
| Ligand | Receptor | LRpair | Pathway | Tissue | Disease Stage |
| Page: 1 |
Top |
Single-cell gene regulatory network inference analysis |
| Find out the significant the regulons (TFs) and the target genes of each regulon across cell types for different disease states |
| TF | Cell Type | Tissue | Disease Stage | Target Gene | RSS | Regulon Activity |
| ∗The dot plots of a searched regulon are shown for all cell subpopulations in each disease state of each tissue based on the regulon specific score inferred using pySCENIC and by calculating the average expression. |
| Page: 1 |
Top |
Somatic mutation of malignant transformation related genes |
| Annotation of somatic variants for genes involved in malignant transformation |
| Hugo Symbol | Variant Class | Variant Classification | dbSNP RS | HGVSc | HGVSp | HGVSp Short | SWISSPROT | BIOTYPE | SIFT | PolyPhen | Tumor Sample Barcode | Tissue | Histology | Sex | Age | Stage | Therapy Types | Drugs | Outcome |
| C11orf54 | SNV | Missense_Mutation | novel | c.773N>G | p.Pro258Arg | p.P258R | Q9H0W9 | protein_coding | deleterious(0.02) | probably_damaging(0.988) | TCGA-A2-A0CR-01 | Breast | breast invasive carcinoma | Female | <65 | I/II | Chemotherapy | adriamycin | CR |
| C11orf54 | SNV | Missense_Mutation | c.328G>C | p.Glu110Gln | p.E110Q | Q9H0W9 | protein_coding | deleterious(0) | probably_damaging(0.999) | TCGA-C5-A3HE-01 | Cervix | cervical & endocervical cancer | Female | <65 | I/II | Unknown | Unknown | PD | |
| C11orf54 | SNV | Missense_Mutation | rs780612413 | c.101N>T | p.Ser34Phe | p.S34F | Q9H0W9 | protein_coding | deleterious(0.01) | possibly_damaging(0.782) | TCGA-VS-A959-01 | Cervix | cervical & endocervical cancer | Female | >=65 | I/II | Unknown | Unknown | SD |
| C11orf54 | SNV | Missense_Mutation | c.445N>G | p.Cys149Gly | p.C149G | Q9H0W9 | protein_coding | tolerated(0.33) | benign(0.059) | TCGA-AG-3892-01 | Colorectum | rectum adenocarcinoma | Female | <65 | I/II | Unknown | Unknown | SD | |
| C11orf54 | deletion | Frame_Shift_Del | c.810delT | p.Phe270LeufsTer18 | p.F270Lfs*18 | Q9H0W9 | protein_coding | TCGA-AA-3864-01 | Colorectum | colon adenocarcinoma | Male | >=65 | I/II | Unknown | Unknown | SD | |||
| C11orf54 | deletion | Frame_Shift_Del | c.810delT | p.Phe270LeufsTer18 | p.F270Lfs*18 | Q9H0W9 | protein_coding | TCGA-AZ-4615-01 | Colorectum | colon adenocarcinoma | Male | >=65 | III/IV | Chemotherapy | xeloda | PD | |||
| C11orf54 | SNV | Missense_Mutation | novel | c.856N>T | p.Asp286Tyr | p.D286Y | Q9H0W9 | protein_coding | deleterious(0) | probably_damaging(0.957) | TCGA-A5-A0G2-01 | Endometrium | uterine corpus endometrioid carcinoma | Female | <65 | III/IV | Unknown | Unknown | SD |
| C11orf54 | SNV | Missense_Mutation | novel | c.145N>T | p.Pro49Ser | p.P49S | Q9H0W9 | protein_coding | tolerated(0.26) | benign(0.245) | TCGA-A5-A1OF-01 | Endometrium | uterine corpus endometrioid carcinoma | Female | <65 | I/II | Unknown | Unknown | SD |
| C11orf54 | SNV | Missense_Mutation | novel | c.590N>A | p.Gly197Glu | p.G197E | Q9H0W9 | protein_coding | tolerated(0.12) | probably_damaging(0.983) | TCGA-A5-A1OF-01 | Endometrium | uterine corpus endometrioid carcinoma | Female | <65 | I/II | Unknown | Unknown | SD |
| C11orf54 | SNV | Missense_Mutation | rs371075089 | c.904N>T | p.Arg302Cys | p.R302C | Q9H0W9 | protein_coding | deleterious(0) | probably_damaging(1) | TCGA-AP-A056-01 | Endometrium | uterine corpus endometrioid carcinoma | Female | <65 | I/II | Unknown | Unknown | SD |
| Page: 1 2 3 |
Top |
Related drugs of malignant transformation related genes |
| Identification of chemicals and drugs interact with genes involved in malignant transfromation |
| (DGIdb 4.0) |
| Entrez ID | Symbol | Category | Interaction Types | Drug Claim Name | Drug Name | PMIDs |
| Page: 1 |

Copyright 2023-Present -The University of Texas Health Science Center at Houston |