
|
|||||
|
 | |
| |
| |
| |
| |
| |
|
Gene: C11orf49 |
Gene summary for C11ORF49 |
| Gene information | Species | Human | Gene symbol | C11orf49 | Gene ID | 79096 |
| Gene name | chromosome 11 open reading frame 49 | |
| Gene Alias | C11orf49 | |
| Cytomap | 11p11.2 | |
| Gene Type | protein-coding | GO ID | GO:0003674 | UniProtAcc | Q9H6J7 |
Top |
Malignant transformation analysis |
| Identification of the aberrant gene expression in precancerous and cancerous lesions by comparing the gene expression of stem-like cells in diseased tissues with normal stem cells |
| Entrez ID | Symbol | Replicates | Species | Organ | Tissue | Adj P-value | Log2FC | Malignancy |
| 79096 | C11orf49 | LZE4T | Human | Esophagus | ESCC | 8.02e-11 | 3.27e-01 | 0.0811 |
| 79096 | C11orf49 | LZE7T | Human | Esophagus | ESCC | 1.62e-14 | 6.11e-01 | 0.0667 |
| 79096 | C11orf49 | LZE8T | Human | Esophagus | ESCC | 1.98e-11 | 2.35e-01 | 0.067 |
| 79096 | C11orf49 | LZE24T | Human | Esophagus | ESCC | 1.54e-16 | 4.23e-01 | 0.0596 |
| 79096 | C11orf49 | LZE21T | Human | Esophagus | ESCC | 6.17e-05 | 3.25e-01 | 0.0655 |
| 79096 | C11orf49 | P2T-E | Human | Esophagus | ESCC | 3.82e-37 | 6.39e-01 | 0.1177 |
| 79096 | C11orf49 | P4T-E | Human | Esophagus | ESCC | 2.68e-28 | 5.82e-01 | 0.1323 |
| 79096 | C11orf49 | P5T-E | Human | Esophagus | ESCC | 7.53e-04 | 8.79e-02 | 0.1327 |
| 79096 | C11orf49 | P8T-E | Human | Esophagus | ESCC | 5.17e-35 | 5.46e-01 | 0.0889 |
| 79096 | C11orf49 | P9T-E | Human | Esophagus | ESCC | 4.19e-19 | 3.90e-01 | 0.1131 |
| 79096 | C11orf49 | P10T-E | Human | Esophagus | ESCC | 3.15e-33 | 5.89e-01 | 0.116 |
| 79096 | C11orf49 | P11T-E | Human | Esophagus | ESCC | 1.88e-21 | 6.23e-01 | 0.1426 |
| 79096 | C11orf49 | P12T-E | Human | Esophagus | ESCC | 1.50e-31 | 5.75e-01 | 0.1122 |
| 79096 | C11orf49 | P15T-E | Human | Esophagus | ESCC | 3.62e-24 | 4.56e-01 | 0.1149 |
| 79096 | C11orf49 | P16T-E | Human | Esophagus | ESCC | 1.08e-30 | 5.25e-01 | 0.1153 |
| 79096 | C11orf49 | P17T-E | Human | Esophagus | ESCC | 3.16e-10 | 4.34e-01 | 0.1278 |
| 79096 | C11orf49 | P20T-E | Human | Esophagus | ESCC | 1.38e-19 | 3.76e-01 | 0.1124 |
| 79096 | C11orf49 | P21T-E | Human | Esophagus | ESCC | 3.52e-21 | 3.76e-01 | 0.1617 |
| 79096 | C11orf49 | P22T-E | Human | Esophagus | ESCC | 1.88e-35 | 5.91e-01 | 0.1236 |
| 79096 | C11orf49 | P23T-E | Human | Esophagus | ESCC | 1.51e-14 | 2.69e-01 | 0.108 |
| Page: 1 2 3 4 5 6 7 |
| Tissue | Expression Dynamics | Abbreviation |
| Esophagus | 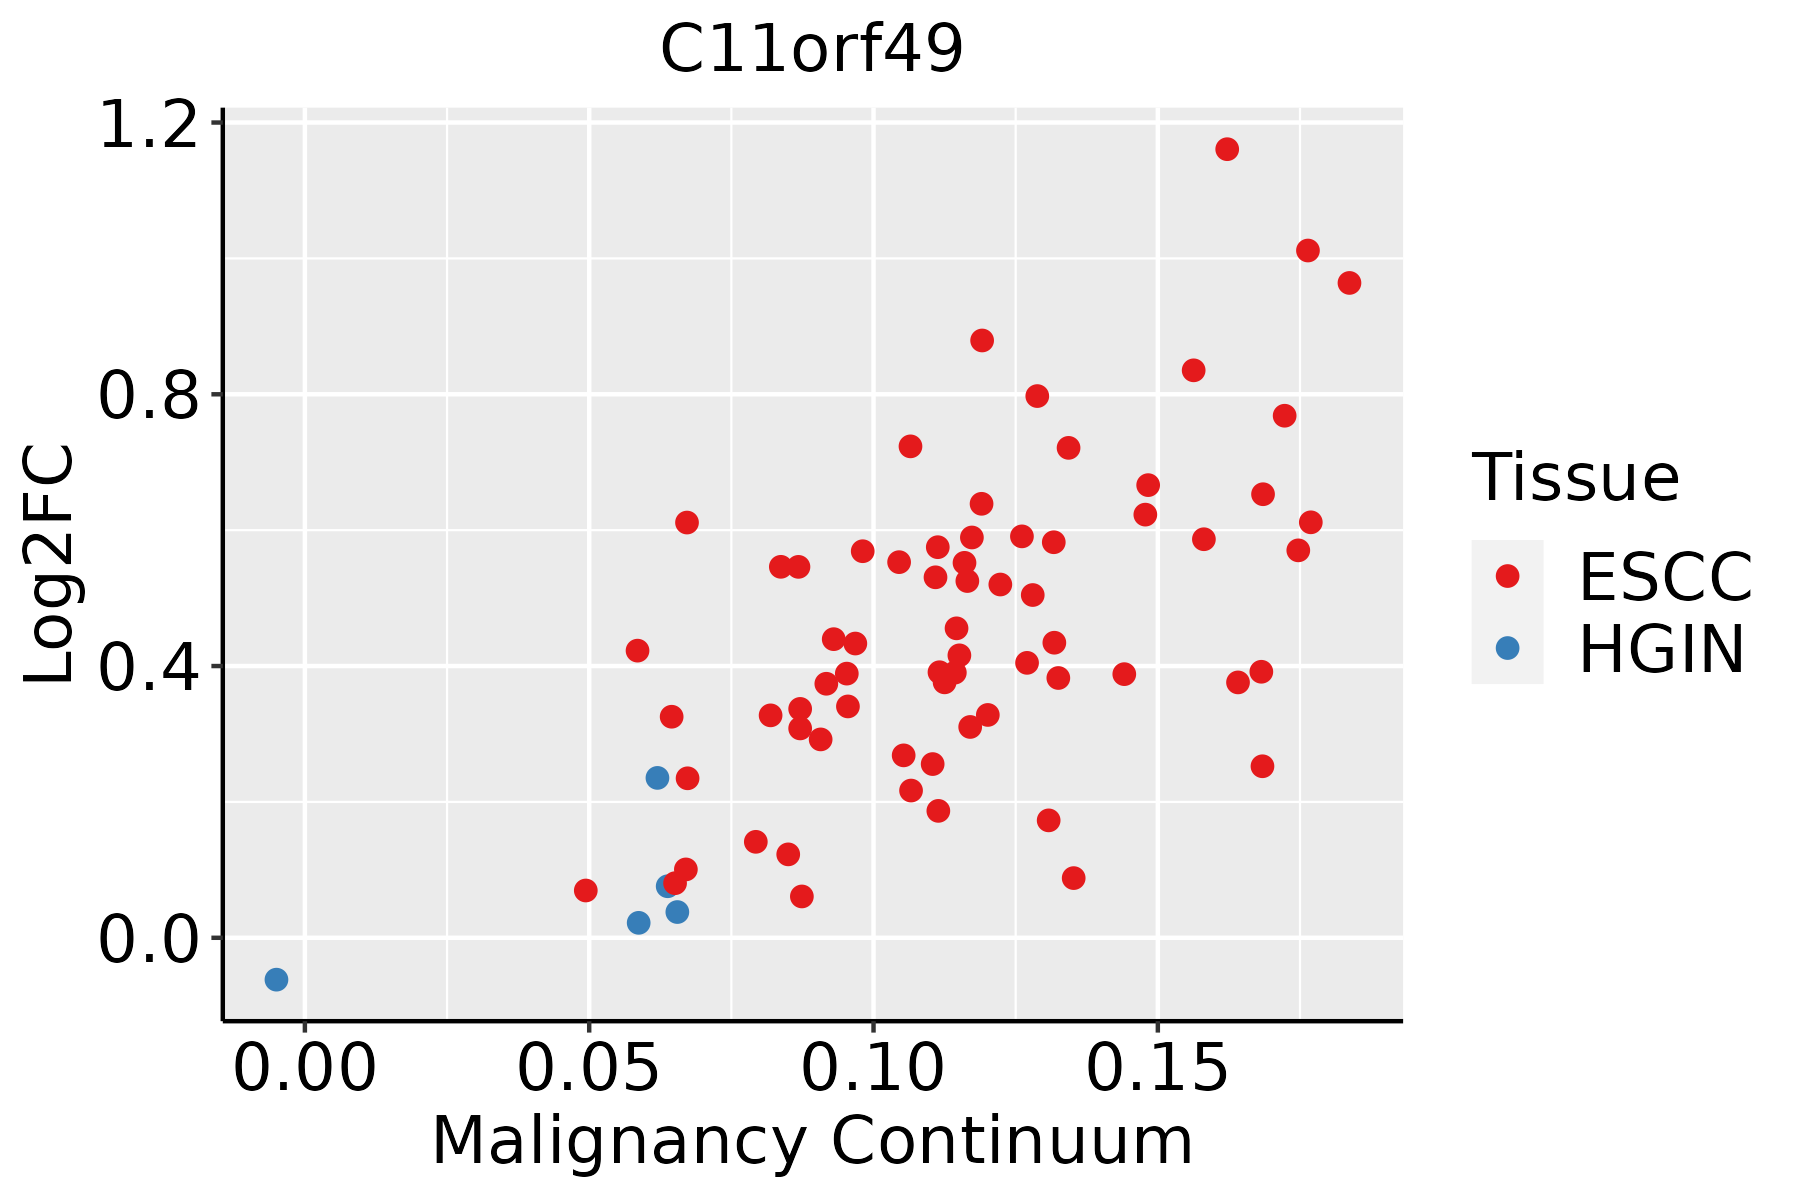 | ESCC: Esophageal squamous cell carcinoma |
| HGIN: High-grade intraepithelial neoplasias | ||
| LGIN: Low-grade intraepithelial neoplasias | ||
| Liver | 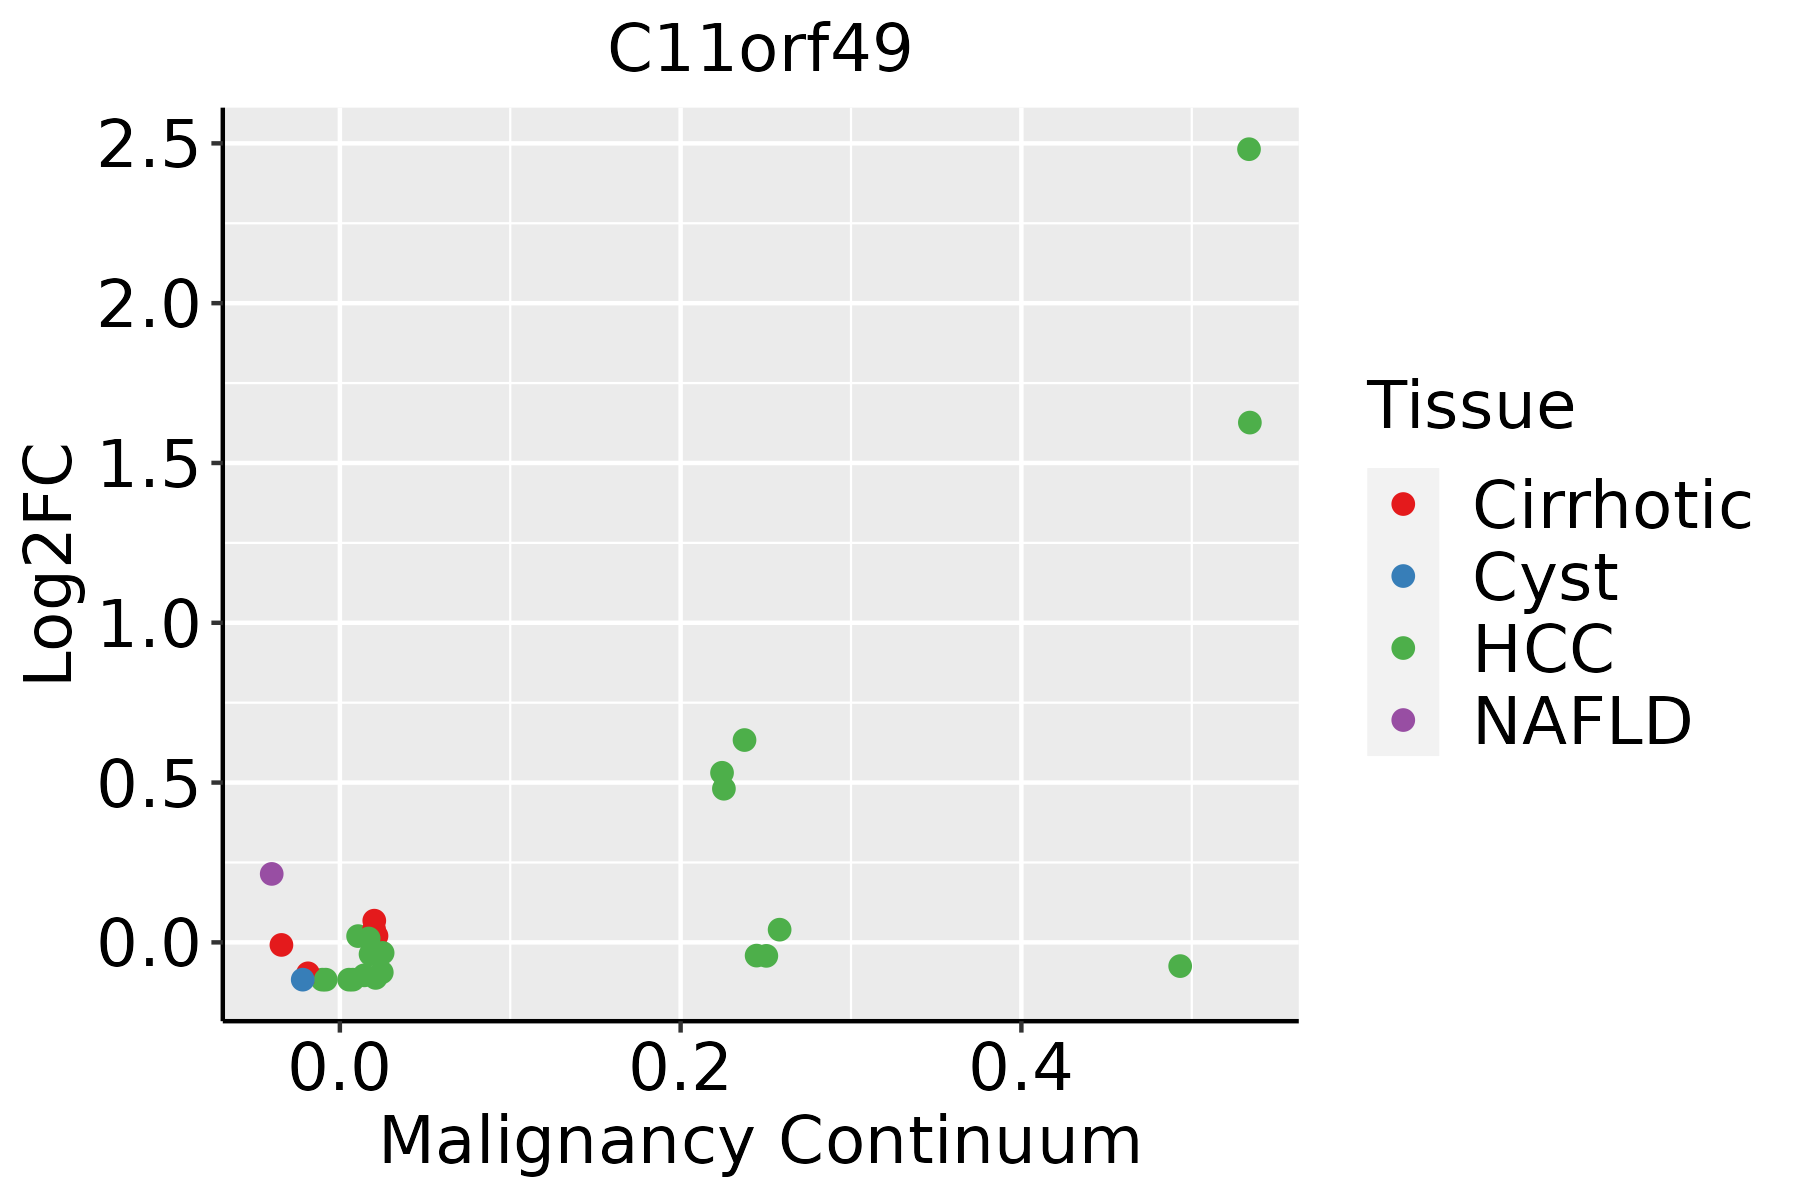 | HCC: Hepatocellular carcinoma |
| NAFLD: Non-alcoholic fatty liver disease | ||
| Lung |  | AAH: Atypical adenomatous hyperplasia |
| AIS: Adenocarcinoma in situ | ||
| IAC: Invasive lung adenocarcinoma | ||
| MIA: Minimally invasive adenocarcinoma | ||
| Oral Cavity |  | EOLP: Erosive Oral lichen planus |
| LP: leukoplakia | ||
| NEOLP: Non-erosive oral lichen planus | ||
| OSCC: Oral squamous cell carcinoma | ||
| Thyroid | 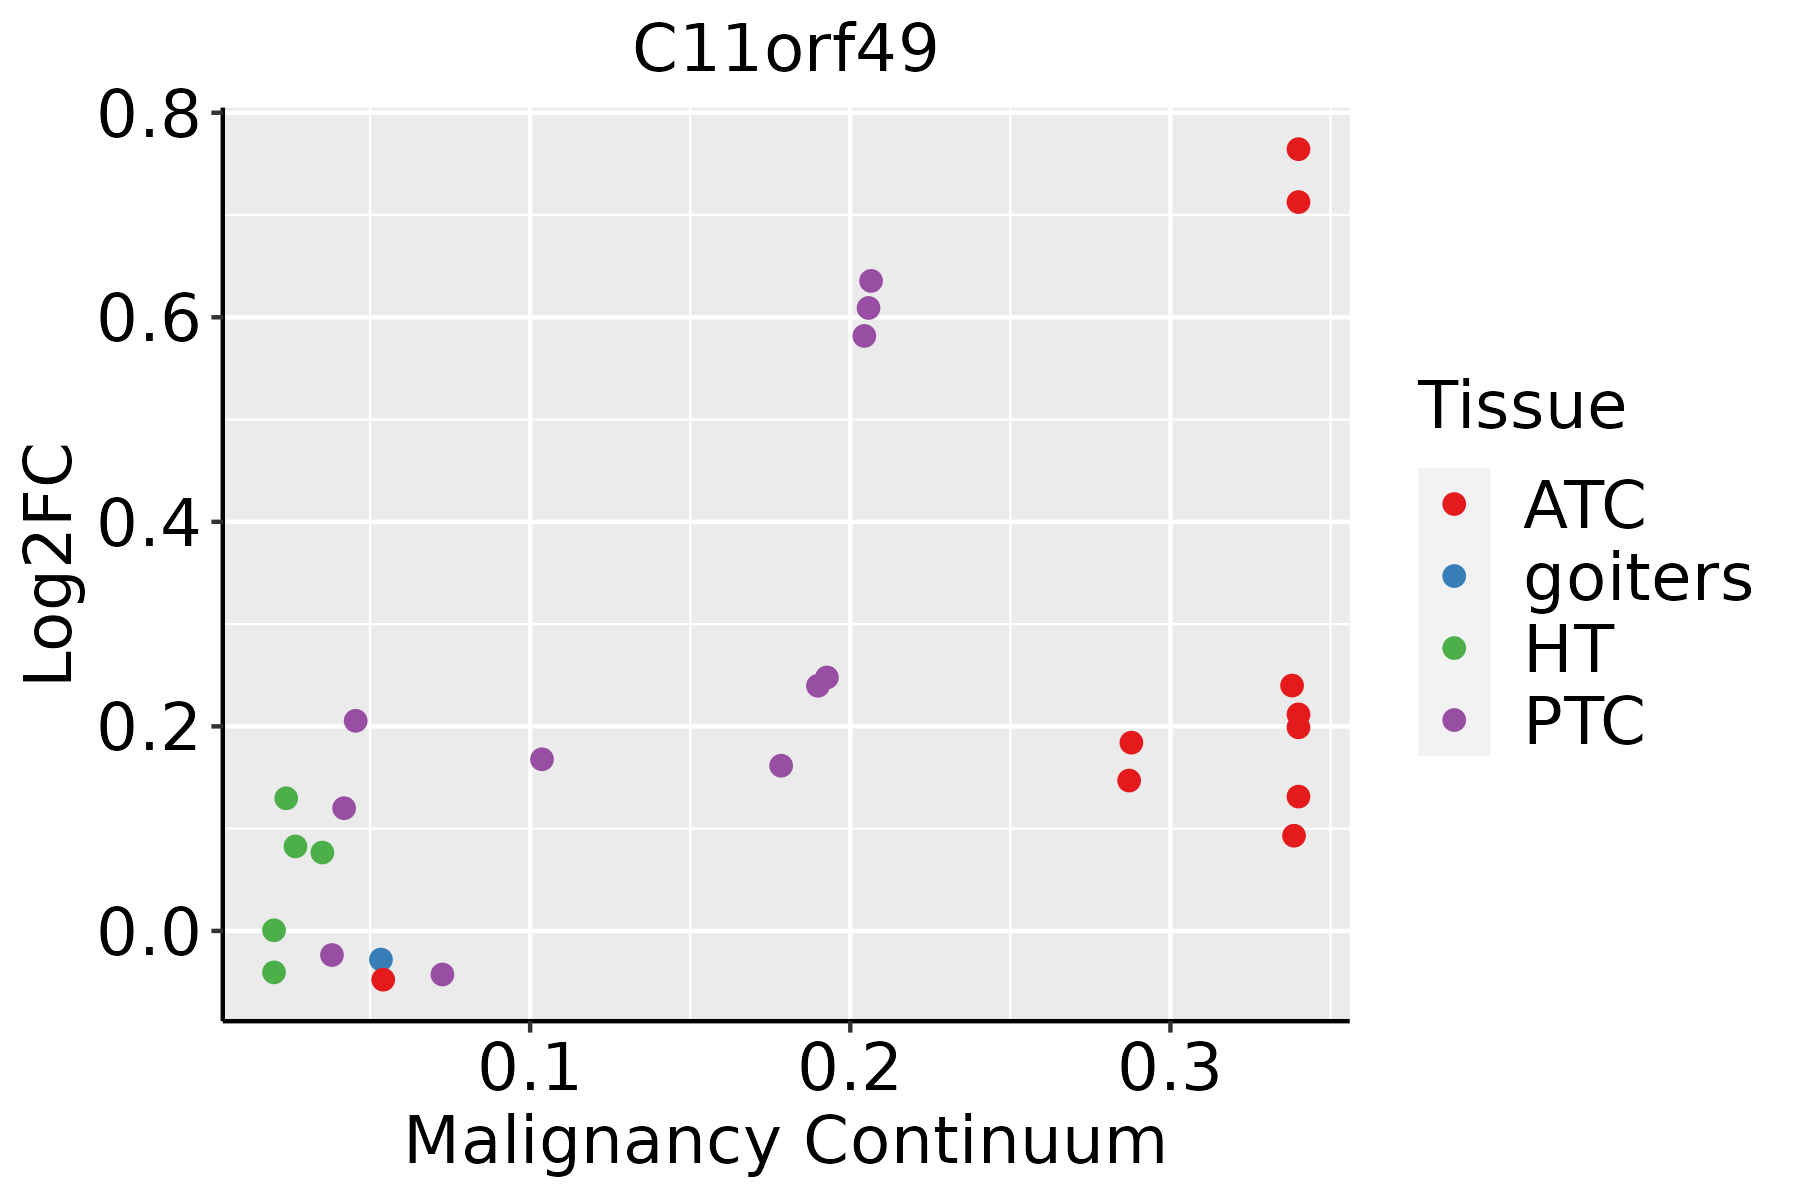 | ATC: Anaplastic thyroid cancer |
| HT: Hashimoto's thyroiditis | ||
| PTC: Papillary thyroid cancer |
| ∗log2FC in expression of this searched gene in stem-like cells from each diseased tissue sample relative to stem-like cells in normal samples in each tissue plotted against the malignancy continuum. Samples are colored based on if they are from different disease stage. |
Top |
Malignant transformation related pathway analysis |
| Find out the enriched GO biological processes and KEGG pathways involved in transition from healthy to precancer to cancer |
| Tissue | Disease Stage | Enriched GO biological Processes |
| Colorectum | AD |  |
| Colorectum | SER |  |
| Colorectum | MSS |  |
| Colorectum | MSI-H |  |
| Colorectum | FAP |  |
| ∗Top 15 enriched GO BP terms are showed in the bar plot of each disease state in each tissue. Each row represents a significant GO biological process which is colored according to the -log10(p.adjust). |
| Page: 1 2 3 4 5 6 7 8 9 |
| GO ID | Tissue | Disease Stage | Description | Gene Ratio | Bg Ratio | pvalue | p.adjust | Count |
| Page: 1 |
| Pathway ID | Tissue | Disease Stage | Description | Gene Ratio | Bg Ratio | pvalue | p.adjust | qvalue | Count |
| Page: 1 |
Top |
Cell-cell communication analysis |
| Identification of potential cell-cell interactions between two cell types and their ligand-receptor pairs for different disease states |
| Ligand | Receptor | LRpair | Pathway | Tissue | Disease Stage |
| Page: 1 |
Top |
Single-cell gene regulatory network inference analysis |
| Find out the significant the regulons (TFs) and the target genes of each regulon across cell types for different disease states |
| TF | Cell Type | Tissue | Disease Stage | Target Gene | RSS | Regulon Activity |
| ∗The dot plots of a searched regulon are shown for all cell subpopulations in each disease state of each tissue based on the regulon specific score inferred using pySCENIC and by calculating the average expression. |
| Page: 1 |
Top |
Somatic mutation of malignant transformation related genes |
| Annotation of somatic variants for genes involved in malignant transformation |
| Hugo Symbol | Variant Class | Variant Classification | dbSNP RS | HGVSc | HGVSp | HGVSp Short | SWISSPROT | BIOTYPE | SIFT | PolyPhen | Tumor Sample Barcode | Tissue | Histology | Sex | Age | Stage | Therapy Types | Drugs | Outcome |
| C11orf49 | SNV | Missense_Mutation | novel | c.248N>T | p.Trp83Leu | p.W83L | Q9H6J7 | protein_coding | deleterious(0.01) | probably_damaging(0.991) | TCGA-A7-A0DB-01 | Breast | breast invasive carcinoma | Female | <65 | I/II | Hormone Therapy | arimidex | SD |
| C11orf49 | SNV | Missense_Mutation | rs766574725 | c.635G>A | p.Arg212Gln | p.R212Q | Q9H6J7 | protein_coding | deleterious(0.02) | probably_damaging(0.986) | TCGA-B6-A400-01 | Breast | breast invasive carcinoma | Female | <65 | III/IV | Unknown | Unknown | SD |
| C11orf49 | SNV | Missense_Mutation | c.997N>A | p.Asp333Asn | p.D333N | Q9H6J7 | protein_coding | deleterious_low_confidence(0.01) | benign(0.424) | TCGA-D8-A1JA-01 | Breast | breast invasive carcinoma | Female | <65 | III/IV | Chemotherapy | adriamycin | PD | |
| C11orf49 | deletion | Frame_Shift_Del | c.454delN | p.Phe152SerfsTer21 | p.F152Sfs*21 | Q9H6J7 | protein_coding | TCGA-AR-A0TX-01 | Breast | breast invasive carcinoma | Female | <65 | I/II | Unknown | Unknown | SD | |||
| C11orf49 | insertion | Nonsense_Mutation | novel | c.252_253insTCCCCTCTTCTAACCTAATCTTT | p.Cys85SerfsTer6 | p.C85Sfs*6 | Q9H6J7 | protein_coding | TCGA-BH-A0HK-01 | Breast | breast invasive carcinoma | Female | >=65 | I/II | Hormone Therapy | arimidex | SD | ||
| C11orf49 | SNV | Missense_Mutation | rs541095717 | c.908N>A | p.Arg303Gln | p.R303Q | Q9H6J7 | protein_coding | deleterious_low_confidence(0.04) | possibly_damaging(0.663) | TCGA-5M-AAT6-01 | Colorectum | colon adenocarcinoma | Female | <65 | III/IV | Unknown | Unknown | PD |
| C11orf49 | SNV | Missense_Mutation | c.889N>A | p.Ala297Thr | p.A297T | Q9H6J7 | protein_coding | tolerated_low_confidence(0.59) | benign(0.001) | TCGA-AZ-6598-01 | Colorectum | colon adenocarcinoma | Female | >=65 | I/II | Unknown | Unknown | SD | |
| C11orf49 | SNV | Missense_Mutation | novel | c.938N>T | p.Arg313Ile | p.R313I | Q9H6J7 | protein_coding | deleterious_low_confidence(0) | benign(0.191) | TCGA-CA-6717-01 | Colorectum | colon adenocarcinoma | Male | <65 | I/II | Chemotherapy | oxaliplatin | CR |
| C11orf49 | SNV | Missense_Mutation | c.385G>A | p.Ala129Thr | p.A129T | Q9H6J7 | protein_coding | tolerated(0.06) | probably_damaging(0.972) | TCGA-AG-A00H-01 | Colorectum | rectum adenocarcinoma | Male | >=65 | I/II | Chemotherapy | 5-fluorouracil | PD | |
| C11orf49 | SNV | Missense_Mutation | novel | c.75N>T | p.Glu25Asp | p.E25D | Q9H6J7 | protein_coding | tolerated(0.06) | probably_damaging(0.971) | TCGA-A5-A0G2-01 | Endometrium | uterine corpus endometrioid carcinoma | Female | <65 | III/IV | Unknown | Unknown | SD |
| Page: 1 2 |
Top |
Related drugs of malignant transformation related genes |
| Identification of chemicals and drugs interact with genes involved in malignant transfromation |
| (DGIdb 4.0) |
| Entrez ID | Symbol | Category | Interaction Types | Drug Claim Name | Drug Name | PMIDs |
| Page: 1 |

Copyright 2023-Present -The University of Texas Health Science Center at Houston |