
|
|||||
|
 | |
| |
| |
| |
| |
| |
|
Gene: C10orf99 |
Gene summary for C10ORF99 |
| Gene information | Species | Human | Gene symbol | C10orf99 | Gene ID | 387695 |
| Gene name | chromosome 10 open reading frame 99 | |
| Gene Alias | AP-57 | |
| Cytomap | 10q23.1 | |
| Gene Type | protein-coding | GO ID | GO:0002376 | UniProtAcc | Q6UWK7 |
Top |
Malignant transformation analysis |
| Identification of the aberrant gene expression in precancerous and cancerous lesions by comparing the gene expression of stem-like cells in diseased tissues with normal stem cells |
| Entrez ID | Symbol | Replicates | Species | Organ | Tissue | Adj P-value | Log2FC | Malignancy |
| 387695 | C10orf99 | CA_HPV_1 | Human | Cervix | CC | 1.93e-06 | -2.14e-01 | 0.0264 |
| 387695 | C10orf99 | N_HPV_2 | Human | Cervix | N_HPV | 4.33e-04 | 2.05e-01 | -0.0131 |
| 387695 | C10orf99 | Tumor | Human | Cervix | CC | 2.04e-65 | 1.24e+00 | 0.1241 |
| 387695 | C10orf99 | sample3 | Human | Cervix | CC | 5.95e-57 | 1.06e+00 | 0.1387 |
| 387695 | C10orf99 | T1 | Human | Cervix | CC | 3.52e-03 | -2.14e-01 | 0.0918 |
| 387695 | C10orf99 | T3 | Human | Cervix | CC | 2.23e-58 | 1.07e+00 | 0.1389 |
| 387695 | C10orf99 | HTA11_3410_2000001011 | Human | Colorectum | AD | 3.03e-29 | 9.24e-01 | 0.0155 |
| 387695 | C10orf99 | HTA11_2487_2000001011 | Human | Colorectum | SER | 5.16e-17 | 9.59e-01 | -0.1808 |
| 387695 | C10orf99 | HTA11_2951_2000001011 | Human | Colorectum | AD | 2.51e-06 | 9.91e-01 | 0.0216 |
| 387695 | C10orf99 | HTA11_1938_2000001011 | Human | Colorectum | AD | 1.70e-15 | 1.02e+00 | -0.0811 |
| 387695 | C10orf99 | HTA11_78_2000001011 | Human | Colorectum | AD | 2.68e-13 | 7.96e-01 | -0.1088 |
| 387695 | C10orf99 | HTA11_347_2000001011 | Human | Colorectum | AD | 3.75e-76 | 2.12e+00 | -0.1954 |
| 387695 | C10orf99 | HTA11_411_2000001011 | Human | Colorectum | SER | 5.23e-10 | 1.51e+00 | -0.2602 |
| 387695 | C10orf99 | HTA11_2112_2000001011 | Human | Colorectum | SER | 4.65e-08 | 1.20e+00 | -0.2196 |
| 387695 | C10orf99 | HTA11_3361_2000001011 | Human | Colorectum | AD | 2.89e-27 | 1.53e+00 | -0.1207 |
| 387695 | C10orf99 | HTA11_83_2000001011 | Human | Colorectum | SER | 1.16e-28 | 1.58e+00 | -0.1526 |
| 387695 | C10orf99 | HTA11_696_2000001011 | Human | Colorectum | AD | 7.92e-60 | 1.93e+00 | -0.1464 |
| 387695 | C10orf99 | HTA11_866_2000001011 | Human | Colorectum | AD | 1.52e-44 | 1.51e+00 | -0.1001 |
| 387695 | C10orf99 | HTA11_1391_2000001011 | Human | Colorectum | AD | 1.04e-41 | 1.93e+00 | -0.059 |
| 387695 | C10orf99 | HTA11_2992_2000001011 | Human | Colorectum | SER | 1.21e-12 | 1.32e+00 | -0.1706 |
| Page: 1 2 3 4 5 |
| Tissue | Expression Dynamics | Abbreviation |
| Cervix |  | CC: Cervix cancer |
| HSIL_HPV: HPV-infected high-grade squamous intraepithelial lesions | ||
| N_HPV: HPV-infected normal cervix | ||
| Colorectum (GSE201348) |  | FAP: Familial adenomatous polyposis |
| CRC: Colorectal cancer | ||
| Colorectum (HTA11) |  | AD: Adenomas |
| SER: Sessile serrated lesions | ||
| MSI-H: Microsatellite-high colorectal cancer | ||
| MSS: Microsatellite stable colorectal cancer | ||
| Esophagus |  | ESCC: Esophageal squamous cell carcinoma |
| HGIN: High-grade intraepithelial neoplasias | ||
| LGIN: Low-grade intraepithelial neoplasias | ||
| Oral Cavity | 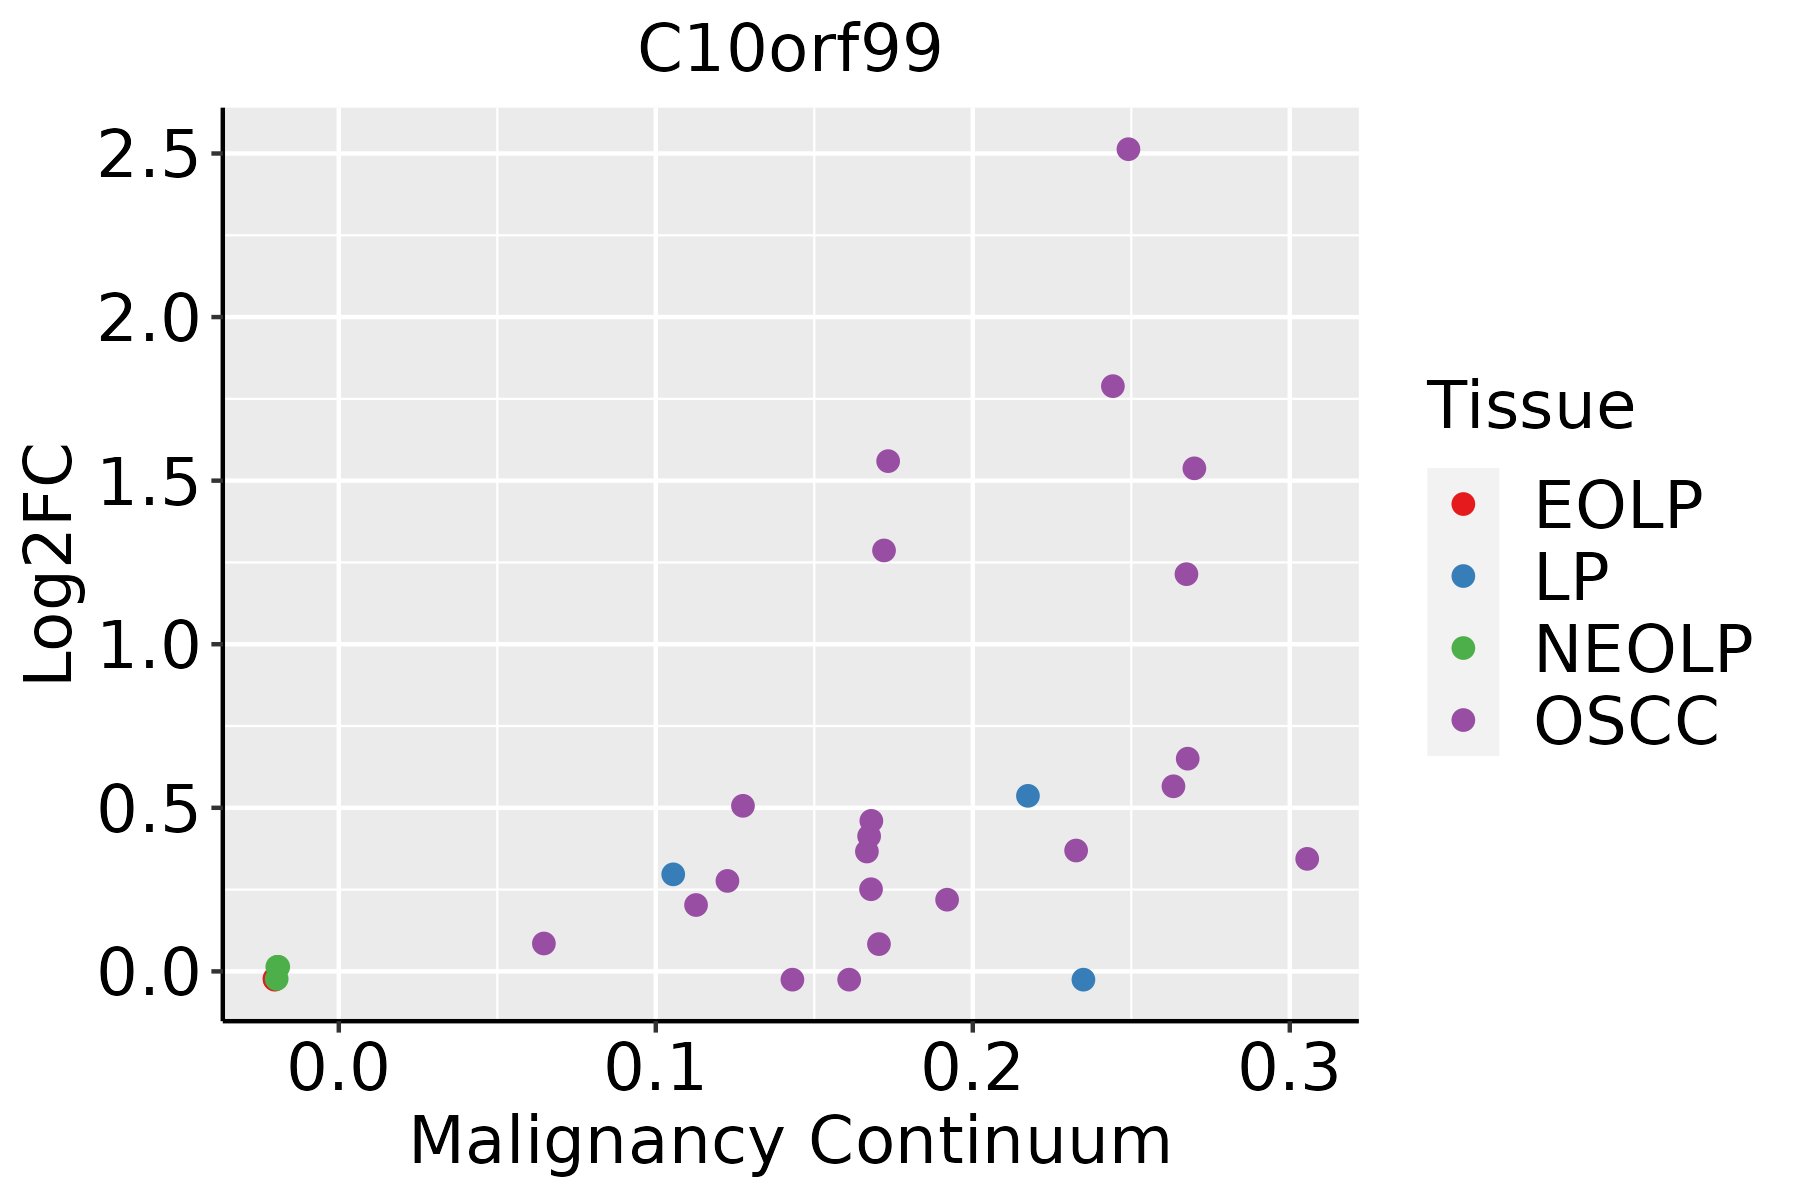 | EOLP: Erosive Oral lichen planus |
| LP: leukoplakia | ||
| NEOLP: Non-erosive oral lichen planus | ||
| OSCC: Oral squamous cell carcinoma |
| ∗log2FC in expression of this searched gene in stem-like cells from each diseased tissue sample relative to stem-like cells in normal samples in each tissue plotted against the malignancy continuum. Samples are colored based on if they are from different disease stage. |
Top |
Malignant transformation related pathway analysis |
| Find out the enriched GO biological processes and KEGG pathways involved in transition from healthy to precancer to cancer |
| Tissue | Disease Stage | Enriched GO biological Processes |
| Colorectum | AD |  |
| Colorectum | SER |  |
| Colorectum | MSS |  |
| Colorectum | MSI-H |  |
| Colorectum | FAP |  |
| ∗Top 15 enriched GO BP terms are showed in the bar plot of each disease state in each tissue. Each row represents a significant GO biological process which is colored according to the -log10(p.adjust). |
| Page: 1 2 3 4 5 6 7 8 9 |
| GO ID | Tissue | Disease Stage | Description | Gene Ratio | Bg Ratio | pvalue | p.adjust | Count |
| GO:00603267 | Cervix | CC | cell chemotaxis | 73/2311 | 310/18723 | 2.82e-08 | 1.96e-06 | 73 |
| GO:00305957 | Cervix | CC | leukocyte chemotaxis | 57/2311 | 230/18723 | 1.48e-07 | 7.07e-06 | 57 |
| GO:00509007 | Cervix | CC | leukocyte migration | 78/2311 | 369/18723 | 1.09e-06 | 3.80e-05 | 78 |
| GO:00026857 | Cervix | CC | regulation of leukocyte migration | 50/2311 | 210/18723 | 2.95e-06 | 8.31e-05 | 50 |
| GO:19028062 | Cervix | CC | regulation of cell cycle G1/S phase transition | 41/2311 | 168/18723 | 1.18e-05 | 2.51e-04 | 41 |
| GO:00716755 | Cervix | CC | regulation of mononuclear cell migration | 31/2311 | 115/18723 | 1.67e-05 | 3.22e-04 | 31 |
| GO:00448434 | Cervix | CC | cell cycle G1/S phase transition | 53/2311 | 241/18723 | 1.76e-05 | 3.32e-04 | 53 |
| GO:19019873 | Cervix | CC | regulation of cell cycle phase transition | 74/2311 | 390/18723 | 9.80e-05 | 1.27e-03 | 74 |
| GO:00513021 | Cervix | CC | regulation of cell division | 39/2311 | 177/18723 | 2.05e-04 | 2.33e-03 | 39 |
| GO:00716745 | Cervix | CC | mononuclear cell migration | 40/2311 | 196/18723 | 8.79e-04 | 7.62e-03 | 40 |
| GO:20004043 | Cervix | CC | regulation of T cell migration | 13/2311 | 42/18723 | 1.18e-03 | 9.56e-03 | 13 |
| GO:00726782 | Cervix | CC | T cell migration | 17/2311 | 66/18723 | 2.20e-03 | 1.58e-02 | 17 |
| GO:00457862 | Cervix | CC | negative regulation of cell cycle | 67/2311 | 385/18723 | 2.21e-03 | 1.59e-02 | 67 |
| GO:20004012 | Cervix | CC | regulation of lymphocyte migration | 16/2311 | 61/18723 | 2.40e-03 | 1.70e-02 | 16 |
| GO:00109482 | Cervix | CC | negative regulation of cell cycle process | 51/2311 | 294/18723 | 7.35e-03 | 3.94e-02 | 51 |
| GO:19028071 | Cervix | CC | negative regulation of cell cycle G1/S phase transition | 20/2311 | 93/18723 | 8.80e-03 | 4.50e-02 | 20 |
| GO:000268522 | Cervix | N_HPV | regulation of leukocyte migration | 23/534 | 210/18723 | 3.69e-08 | 4.31e-06 | 23 |
| GO:007167522 | Cervix | N_HPV | regulation of mononuclear cell migration | 16/534 | 115/18723 | 1.70e-07 | 1.43e-05 | 16 |
| GO:003059522 | Cervix | N_HPV | leukocyte chemotaxis | 23/534 | 230/18723 | 1.97e-07 | 1.60e-05 | 23 |
| GO:005090022 | Cervix | N_HPV | leukocyte migration | 30/534 | 369/18723 | 2.90e-07 | 2.13e-05 | 30 |
| Page: 1 2 3 |
| Pathway ID | Tissue | Disease Stage | Description | Gene Ratio | Bg Ratio | pvalue | p.adjust | qvalue | Count |
| Page: 1 |
Top |
Cell-cell communication analysis |
| Identification of potential cell-cell interactions between two cell types and their ligand-receptor pairs for different disease states |
| Ligand | Receptor | LRpair | Pathway | Tissue | Disease Stage |
| Page: 1 |
Top |
Single-cell gene regulatory network inference analysis |
| Find out the significant the regulons (TFs) and the target genes of each regulon across cell types for different disease states |
| TF | Cell Type | Tissue | Disease Stage | Target Gene | RSS | Regulon Activity |
| ∗The dot plots of a searched regulon are shown for all cell subpopulations in each disease state of each tissue based on the regulon specific score inferred using pySCENIC and by calculating the average expression. |
| Page: 1 |
Top |
Somatic mutation of malignant transformation related genes |
| Annotation of somatic variants for genes involved in malignant transformation |
| Hugo Symbol | Variant Class | Variant Classification | dbSNP RS | HGVSc | HGVSp | HGVSp Short | SWISSPROT | BIOTYPE | SIFT | PolyPhen | Tumor Sample Barcode | Tissue | Histology | Sex | Age | Stage | Therapy Types | Drugs | Outcome |
| C10orf99 | SNV | Missense_Mutation | novel | c.161N>A | p.Gly54Glu | p.G54E | Q6UWK7 | protein_coding | tolerated(0.07) | possibly_damaging(0.888) | TCGA-A2-A04Q-01 | Breast | breast invasive carcinoma | Female | <65 | I/II | Chemotherapy | adriamycin | SD |
| C10orf99 | SNV | Missense_Mutation | c.69A>T | p.Glu23Asp | p.E23D | Q6UWK7 | protein_coding | deleterious(0) | probably_damaging(0.925) | TCGA-BH-A18G-01 | Breast | breast invasive carcinoma | Female | >=65 | I/II | Unknown | Unknown | SD | |
| C10orf99 | SNV | Missense_Mutation | rs771262901 | c.79N>T | p.Arg27Cys | p.R27C | Q6UWK7 | protein_coding | tolerated(0.1) | possibly_damaging(0.453) | TCGA-AP-A051-01 | Endometrium | uterine corpus endometrioid carcinoma | Female | >=65 | I/II | Unknown | Unknown | SD |
| C10orf99 | SNV | Missense_Mutation | c.208N>T | p.Arg70Cys | p.R70C | Q6UWK7 | protein_coding | deleterious(0.03) | benign(0.276) | TCGA-AP-A0LD-01 | Endometrium | uterine corpus endometrioid carcinoma | Female | <65 | I/II | Unknown | Unknown | SD | |
| C10orf99 | SNV | Missense_Mutation | rs771262901 | c.79N>T | p.Arg27Cys | p.R27C | Q6UWK7 | protein_coding | tolerated(0.1) | possibly_damaging(0.453) | TCGA-AX-A1CE-01 | Endometrium | uterine corpus endometrioid carcinoma | Female | <65 | I/II | Unspecific | Paclitaxel | SD |
| C10orf99 | SNV | Missense_Mutation | novel | c.70N>A | p.Gly24Arg | p.G24R | Q6UWK7 | protein_coding | deleterious(0) | probably_damaging(0.995) | TCGA-BG-A221-01 | Endometrium | uterine corpus endometrioid carcinoma | Female | >=65 | I/II | Unknown | Unknown | SD |
| C10orf99 | SNV | Missense_Mutation | novel | c.43N>A | p.Leu15Ile | p.L15I | Q6UWK7 | protein_coding | deleterious(0.02) | probably_damaging(0.925) | TCGA-EO-A22X-01 | Endometrium | uterine corpus endometrioid carcinoma | Female | <65 | III/IV | Unspecific | Carboplatin | Complete Response |
| C10orf99 | SNV | Missense_Mutation | novel | c.220N>T | p.Val74Leu | p.V74L | Q6UWK7 | protein_coding | tolerated(0.11) | probably_damaging(0.992) | TCGA-56-8307-01 | Lung | lung squamous cell carcinoma | Female | <65 | I/II | Unknown | Unknown | SD |
| C10orf99 | SNV | Missense_Mutation | novel | c.133N>A | p.Pro45Thr | p.P45T | Q6UWK7 | protein_coding | deleterious(0.03) | benign(0.06) | TCGA-LA-A7SW-01 | Lung | lung squamous cell carcinoma | Male | >=65 | III/IV | Chemotherapy | cisplatin | PD |
| C10orf99 | SNV | Missense_Mutation | c.57C>G | p.Ile19Met | p.I19M | Q6UWK7 | protein_coding | deleterious(0.01) | benign(0.299) | TCGA-CH-5762-01 | Prostate | prostate adenocarcinoma | Male | <65 | 7 | Unknown | Unknown | SD |
| Page: 1 2 |
Top |
Related drugs of malignant transformation related genes |
| Identification of chemicals and drugs interact with genes involved in malignant transfromation |
| (DGIdb 4.0) |
| Entrez ID | Symbol | Category | Interaction Types | Drug Claim Name | Drug Name | PMIDs |
| Page: 1 |

Copyright 2023-Present -The University of Texas Health Science Center at Houston |