
|
|||||
|
 | |
| |
| |
| |
| |
| |
|
Gene: C10orf11 |
Gene summary for C10ORF11 |
| Gene information | Species | Human | Gene symbol | C10orf11 | Gene ID | 83938 |
| Gene name | leucine rich melanocyte differentiation associated | |
| Gene Alias | C10orf11 | |
| Cytomap | 10q22.2-q22.3 | |
| Gene Type | protein-coding | GO ID | GO:0008150 | UniProtAcc | A0A087WWI0 |
Top |
Malignant transformation analysis |
| Identification of the aberrant gene expression in precancerous and cancerous lesions by comparing the gene expression of stem-like cells in diseased tissues with normal stem cells |
| Entrez ID | Symbol | Replicates | Species | Organ | Tissue | Adj P-value | Log2FC | Malignancy |
| 83938 | C10orf11 | HTA11_99999970781_79442 | Human | Colorectum | MSS | 9.72e-65 | 1.10e+00 | 0.294 |
| 83938 | C10orf11 | HTA11_99999965062_69753 | Human | Colorectum | MSI-H | 7.89e-03 | 4.33e-01 | 0.3487 |
| 83938 | C10orf11 | HTA11_99999965104_69814 | Human | Colorectum | MSS | 4.35e-15 | 5.55e-01 | 0.281 |
| 83938 | C10orf11 | HTA11_99999971662_82457 | Human | Colorectum | MSS | 1.15e-20 | 4.46e-01 | 0.3859 |
| 83938 | C10orf11 | HTA11_99999973899_84307 | Human | Colorectum | MSS | 3.94e-18 | 6.60e-01 | 0.2585 |
| 83938 | C10orf11 | HTA11_99999974143_84620 | Human | Colorectum | MSS | 7.76e-28 | 5.42e-01 | 0.3005 |
| 83938 | C10orf11 | AEH-subject2 | Human | Endometrium | AEH | 2.75e-02 | -9.93e-02 | -0.2525 |
| 83938 | C10orf11 | EEC-subject1 | Human | Endometrium | EEC | 3.51e-03 | -9.93e-02 | -0.2682 |
| 83938 | C10orf11 | EEC-subject2 | Human | Endometrium | EEC | 3.29e-02 | -9.93e-02 | -0.2607 |
| 83938 | C10orf11 | EEC-subject3 | Human | Endometrium | EEC | 3.71e-04 | -9.93e-02 | -0.2525 |
| 83938 | C10orf11 | EEC-subject4 | Human | Endometrium | EEC | 3.51e-03 | -9.93e-02 | -0.2571 |
| 83938 | C10orf11 | EEC-subject5 | Human | Endometrium | EEC | 1.56e-02 | -9.93e-02 | -0.249 |
| 83938 | C10orf11 | GSM5276934 | Human | Endometrium | EEC | 3.29e-02 | -9.93e-02 | -0.0913 |
| 83938 | C10orf11 | GSM5276935 | Human | Endometrium | EEC | 1.56e-02 | -9.93e-02 | -0.123 |
| 83938 | C10orf11 | GSM6177621_NYU_UCEC2_lib1_lib1 | Human | Endometrium | EEC | 1.56e-02 | -9.93e-02 | -0.1934 |
| 83938 | C10orf11 | GSM6177622_NYU_UCEC3_lib2_lib2 | Human | Endometrium | EEC | 8.54e-03 | -9.93e-02 | -0.1916 |
| 83938 | C10orf11 | GSM6177623_NYU_UCEC3_Vis | Human | Endometrium | EEC | 7.40e-03 | -9.93e-02 | -0.1269 |
| Page: 1 |
| Tissue | Expression Dynamics | Abbreviation |
| Colorectum (GSE201348) |  | FAP: Familial adenomatous polyposis |
| CRC: Colorectal cancer | ||
| Colorectum (HTA11) |  | AD: Adenomas |
| SER: Sessile serrated lesions | ||
| MSI-H: Microsatellite-high colorectal cancer | ||
| MSS: Microsatellite stable colorectal cancer | ||
| Endometrium | 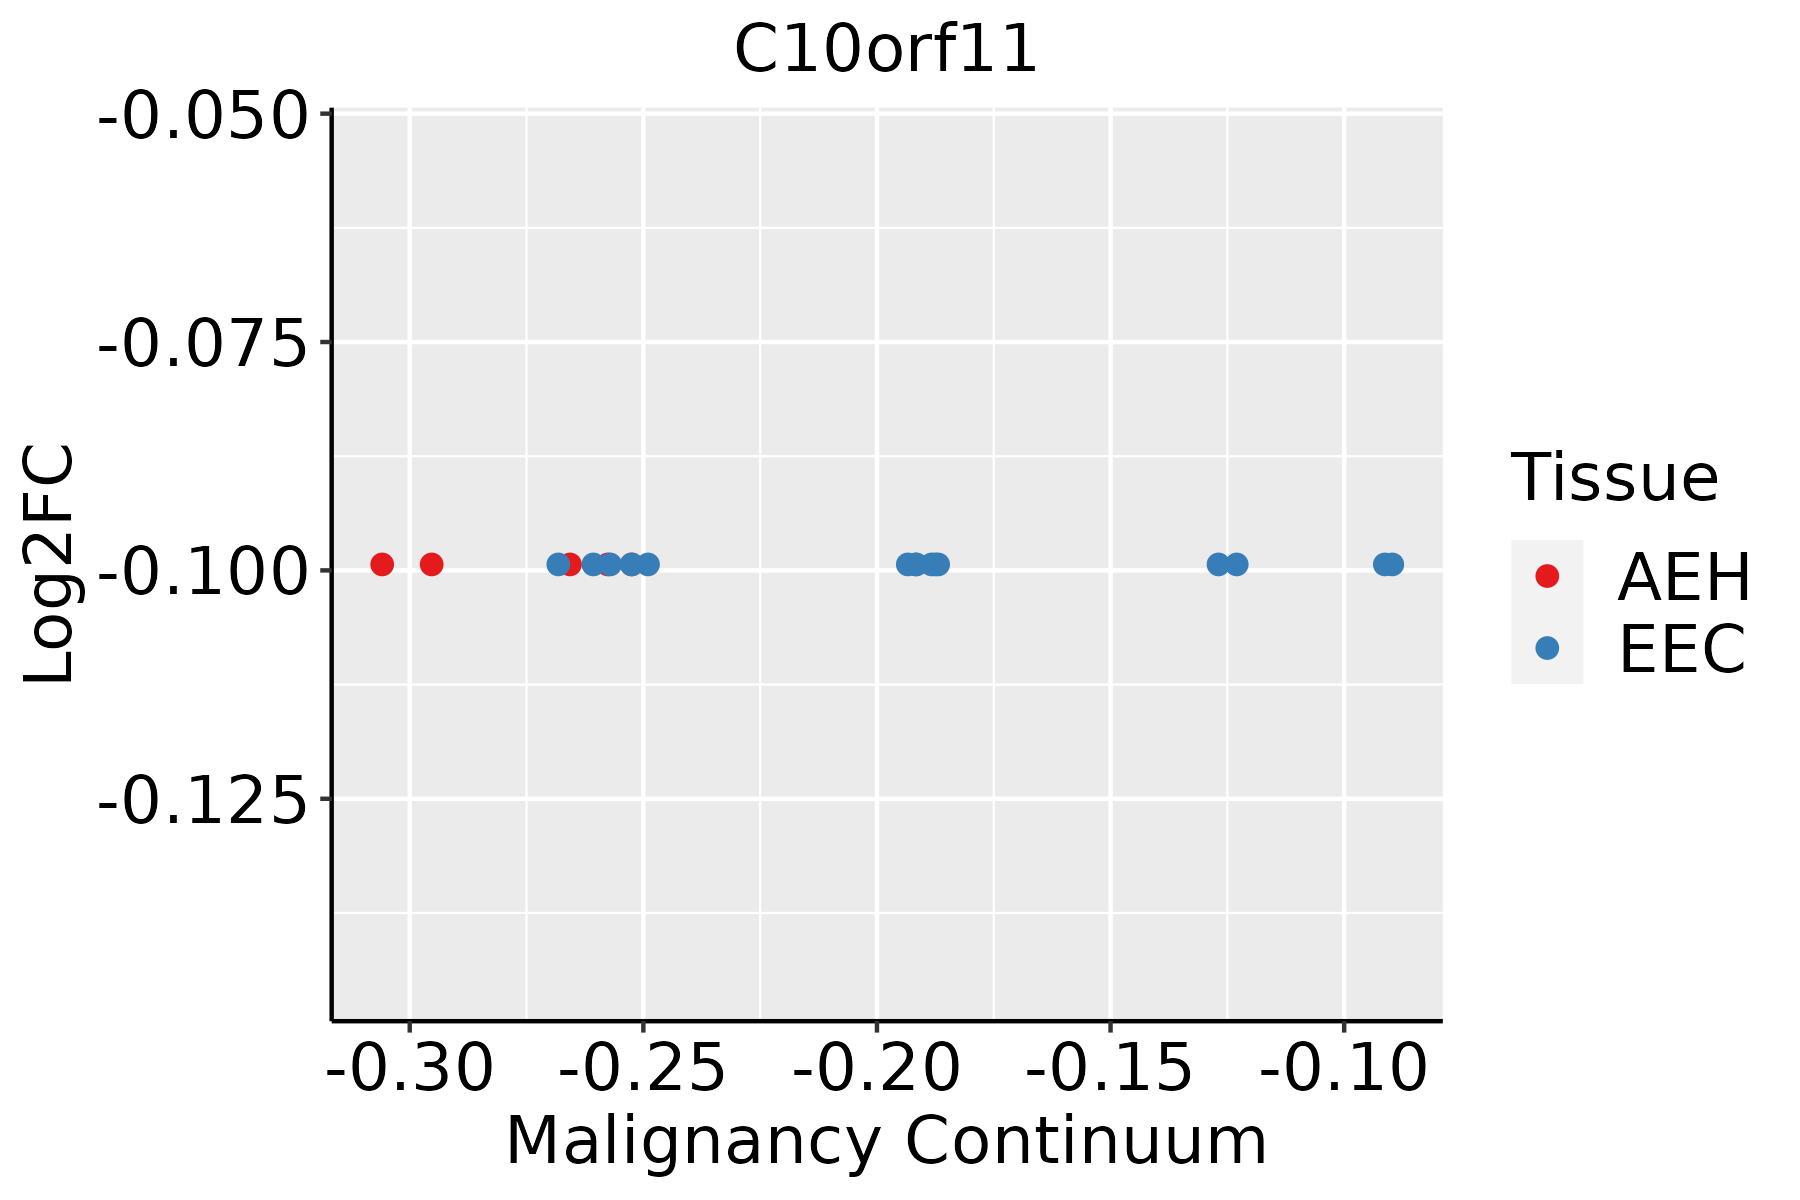 | AEH: Atypical endometrial hyperplasia |
| EEC: Endometrioid Cancer |
| ∗log2FC in expression of this searched gene in stem-like cells from each diseased tissue sample relative to stem-like cells in normal samples in each tissue plotted against the malignancy continuum. Samples are colored based on if they are from different disease stage. |
Top |
Malignant transformation related pathway analysis |
| Find out the enriched GO biological processes and KEGG pathways involved in transition from healthy to precancer to cancer |
| Tissue | Disease Stage | Enriched GO biological Processes |
| Colorectum | AD |  |
| Colorectum | SER |  |
| Colorectum | MSS |  |
| Colorectum | MSI-H |  |
| Colorectum | FAP |  |
| ∗Top 15 enriched GO BP terms are showed in the bar plot of each disease state in each tissue. Each row represents a significant GO biological process which is colored according to the -log10(p.adjust). |
| Page: 1 2 3 4 5 6 7 8 9 |
| GO ID | Tissue | Disease Stage | Description | Gene Ratio | Bg Ratio | pvalue | p.adjust | Count |
| Page: 1 |
| Pathway ID | Tissue | Disease Stage | Description | Gene Ratio | Bg Ratio | pvalue | p.adjust | qvalue | Count |
| Page: 1 |
Top |
Cell-cell communication analysis |
| Identification of potential cell-cell interactions between two cell types and their ligand-receptor pairs for different disease states |
| Ligand | Receptor | LRpair | Pathway | Tissue | Disease Stage |
| Page: 1 |
Top |
Single-cell gene regulatory network inference analysis |
| Find out the significant the regulons (TFs) and the target genes of each regulon across cell types for different disease states |
| TF | Cell Type | Tissue | Disease Stage | Target Gene | RSS | Regulon Activity |
| ∗The dot plots of a searched regulon are shown for all cell subpopulations in each disease state of each tissue based on the regulon specific score inferred using pySCENIC and by calculating the average expression. |
| Page: 1 |
Top |
Somatic mutation of malignant transformation related genes |
| Annotation of somatic variants for genes involved in malignant transformation |
| Hugo Symbol | Variant Class | Variant Classification | dbSNP RS | HGVSc | HGVSp | HGVSp Short | SWISSPROT | BIOTYPE | SIFT | PolyPhen | Tumor Sample Barcode | Tissue | Histology | Sex | Age | Stage | Therapy Types | Drugs | Outcome |
| C10orf11 | SNV | Missense_Mutation | c.190C>G | p.Gln64Glu | p.Q64E | protein_coding | tolerated(1) | benign(0.007) | TCGA-A8-A09G-01 | Breast | breast invasive carcinoma | Female | >=65 | III/IV | Unknown | Unknown | SD | ||
| C10orf11 | SNV | Missense_Mutation | novel | c.199N>A | p.Asp67Asn | p.D67N | protein_coding | tolerated(0.29) | benign(0.073) | TCGA-AN-A046-01 | Breast | breast invasive carcinoma | Female | >=65 | I/II | Unknown | Unknown | SD | |
| C10orf11 | SNV | Missense_Mutation | c.376N>C | p.Glu126Gln | p.E126Q | protein_coding | deleterious(0) | possibly_damaging(0.885) | TCGA-D8-A1JA-01 | Breast | breast invasive carcinoma | Female | <65 | III/IV | Chemotherapy | adriamycin | PD | ||
| C10orf11 | SNV | Missense_Mutation | rs767777499 | c.620G>A | p.Arg207His | p.R207H | protein_coding | tolerated(0.16) | benign(0.077) | TCGA-2W-A8YY-01 | Cervix | cervical & endocervical cancer | Female | <65 | I/II | Chemotherapy | cisplatin | CR | |
| C10orf11 | SNV | Missense_Mutation | c.578N>G | p.Ser193Cys | p.S193C | protein_coding | deleterious(0.04) | probably_damaging(0.947) | TCGA-AA-3851-01 | Colorectum | colon adenocarcinoma | Male | >=65 | I/II | Unknown | Unknown | SD | ||
| C10orf11 | SNV | Missense_Mutation | novel | c.280N>A | p.Leu94Met | p.L94M | protein_coding | deleterious(0) | probably_damaging(0.945) | TCGA-AG-A002-01 | Colorectum | rectum adenocarcinoma | Male | <65 | I/II | Unknown | Unknown | SD | |
| C10orf11 | insertion | Frame_Shift_Ins | novel | c.677_678insC | p.Ter227LeufsTer? | p.*227Lfs*? | protein_coding | TCGA-AM-5820-01 | Colorectum | colon adenocarcinoma | Female | <65 | I/II | Unknown | Unknown | SD | |||
| C10orf11 | SNV | Missense_Mutation | novel | c.649N>T | p.Gly217Cys | p.G217C | protein_coding | deleterious(0) | probably_damaging(1) | TCGA-A5-A0G1-01 | Endometrium | uterine corpus endometrioid carcinoma | Female | >=65 | I/II | Unknown | Unknown | SD | |
| C10orf11 | SNV | Missense_Mutation | rs200703401 | c.665N>A | p.Arg222Gln | p.R222Q | protein_coding | tolerated(0.09) | possibly_damaging(0.562) | TCGA-A5-A2K5-01 | Endometrium | uterine corpus endometrioid carcinoma | Female | >=65 | I/II | Unknown | Unknown | SD | |
| C10orf11 | SNV | Missense_Mutation | novel | c.409C>A | p.Leu137Met | p.L137M | protein_coding | deleterious(0.01) | probably_damaging(0.994) | TCGA-AP-A1DV-01 | Endometrium | uterine corpus endometrioid carcinoma | Female | <65 | I/II | Unknown | Unknown | SD |
| Page: 1 2 3 |
Top |
Related drugs of malignant transformation related genes |
| Identification of chemicals and drugs interact with genes involved in malignant transfromation |
| (DGIdb 4.0) |
| Entrez ID | Symbol | Category | Interaction Types | Drug Claim Name | Drug Name | PMIDs |
| Page: 1 |

Copyright 2023-Present -The University of Texas Health Science Center at Houston |