
|
|||||
|
 | |
| |
| |
| |
| |
| |
|
Gene: C10orf10 |
Gene summary for C10ORF10 |
| Gene information | Species | Human | Gene symbol | C10orf10 | Gene ID | 11067 |
| Gene name | DEPP1 autophagy regulator | |
| Gene Alias | C10orf10 | |
| Cytomap | 10q11.21 | |
| Gene Type | protein-coding | GO ID | GO:0006914 | UniProtAcc | Q9NTK1 |
Top |
Malignant transformation analysis |
| Identification of the aberrant gene expression in precancerous and cancerous lesions by comparing the gene expression of stem-like cells in diseased tissues with normal stem cells |
| Entrez ID | Symbol | Replicates | Species | Organ | Tissue | Adj P-value | Log2FC | Malignancy |
| 11067 | C10orf10 | P1T-E | Human | Esophagus | ESCC | 1.08e-04 | 7.65e-01 | 0.0875 |
| 11067 | C10orf10 | P2T-E | Human | Esophagus | ESCC | 9.25e-17 | 3.87e-01 | 0.1177 |
| 11067 | C10orf10 | P8T-E | Human | Esophagus | ESCC | 2.45e-05 | 2.65e-01 | 0.0889 |
| 11067 | C10orf10 | P11T-E | Human | Esophagus | ESCC | 2.27e-19 | 2.14e+00 | 0.1426 |
| 11067 | C10orf10 | P21T-E | Human | Esophagus | ESCC | 4.35e-09 | 1.16e-01 | 0.1617 |
| 11067 | C10orf10 | P22T-E | Human | Esophagus | ESCC | 1.23e-06 | 4.39e-01 | 0.1236 |
| 11067 | C10orf10 | P23T-E | Human | Esophagus | ESCC | 4.09e-35 | 1.74e+00 | 0.108 |
| 11067 | C10orf10 | P24T-E | Human | Esophagus | ESCC | 9.24e-13 | 7.49e-01 | 0.1287 |
| 11067 | C10orf10 | P26T-E | Human | Esophagus | ESCC | 9.42e-04 | 6.64e-02 | 0.1276 |
| 11067 | C10orf10 | P32T-E | Human | Esophagus | ESCC | 6.67e-04 | 4.27e-01 | 0.1666 |
| 11067 | C10orf10 | P36T-E | Human | Esophagus | ESCC | 1.28e-10 | 9.97e-01 | 0.1187 |
| 11067 | C10orf10 | P37T-E | Human | Esophagus | ESCC | 4.82e-04 | 3.10e-01 | 0.1371 |
| 11067 | C10orf10 | P47T-E | Human | Esophagus | ESCC | 1.22e-07 | 3.68e-01 | 0.1067 |
| 11067 | C10orf10 | P48T-E | Human | Esophagus | ESCC | 3.12e-02 | 6.14e-02 | 0.0959 |
| 11067 | C10orf10 | P52T-E | Human | Esophagus | ESCC | 8.90e-08 | 3.99e-01 | 0.1555 |
| 11067 | C10orf10 | P54T-E | Human | Esophagus | ESCC | 1.28e-14 | 8.05e-01 | 0.0975 |
| 11067 | C10orf10 | P57T-E | Human | Esophagus | ESCC | 9.32e-10 | 6.11e-01 | 0.0926 |
| 11067 | C10orf10 | P61T-E | Human | Esophagus | ESCC | 4.53e-09 | 6.03e-01 | 0.099 |
| 11067 | C10orf10 | P62T-E | Human | Esophagus | ESCC | 8.97e-05 | 4.15e-01 | 0.1302 |
| 11067 | C10orf10 | P74T-E | Human | Esophagus | ESCC | 6.70e-09 | 7.86e-01 | 0.1479 |
| Page: 1 2 3 |
| Tissue | Expression Dynamics | Abbreviation |
| Esophagus | 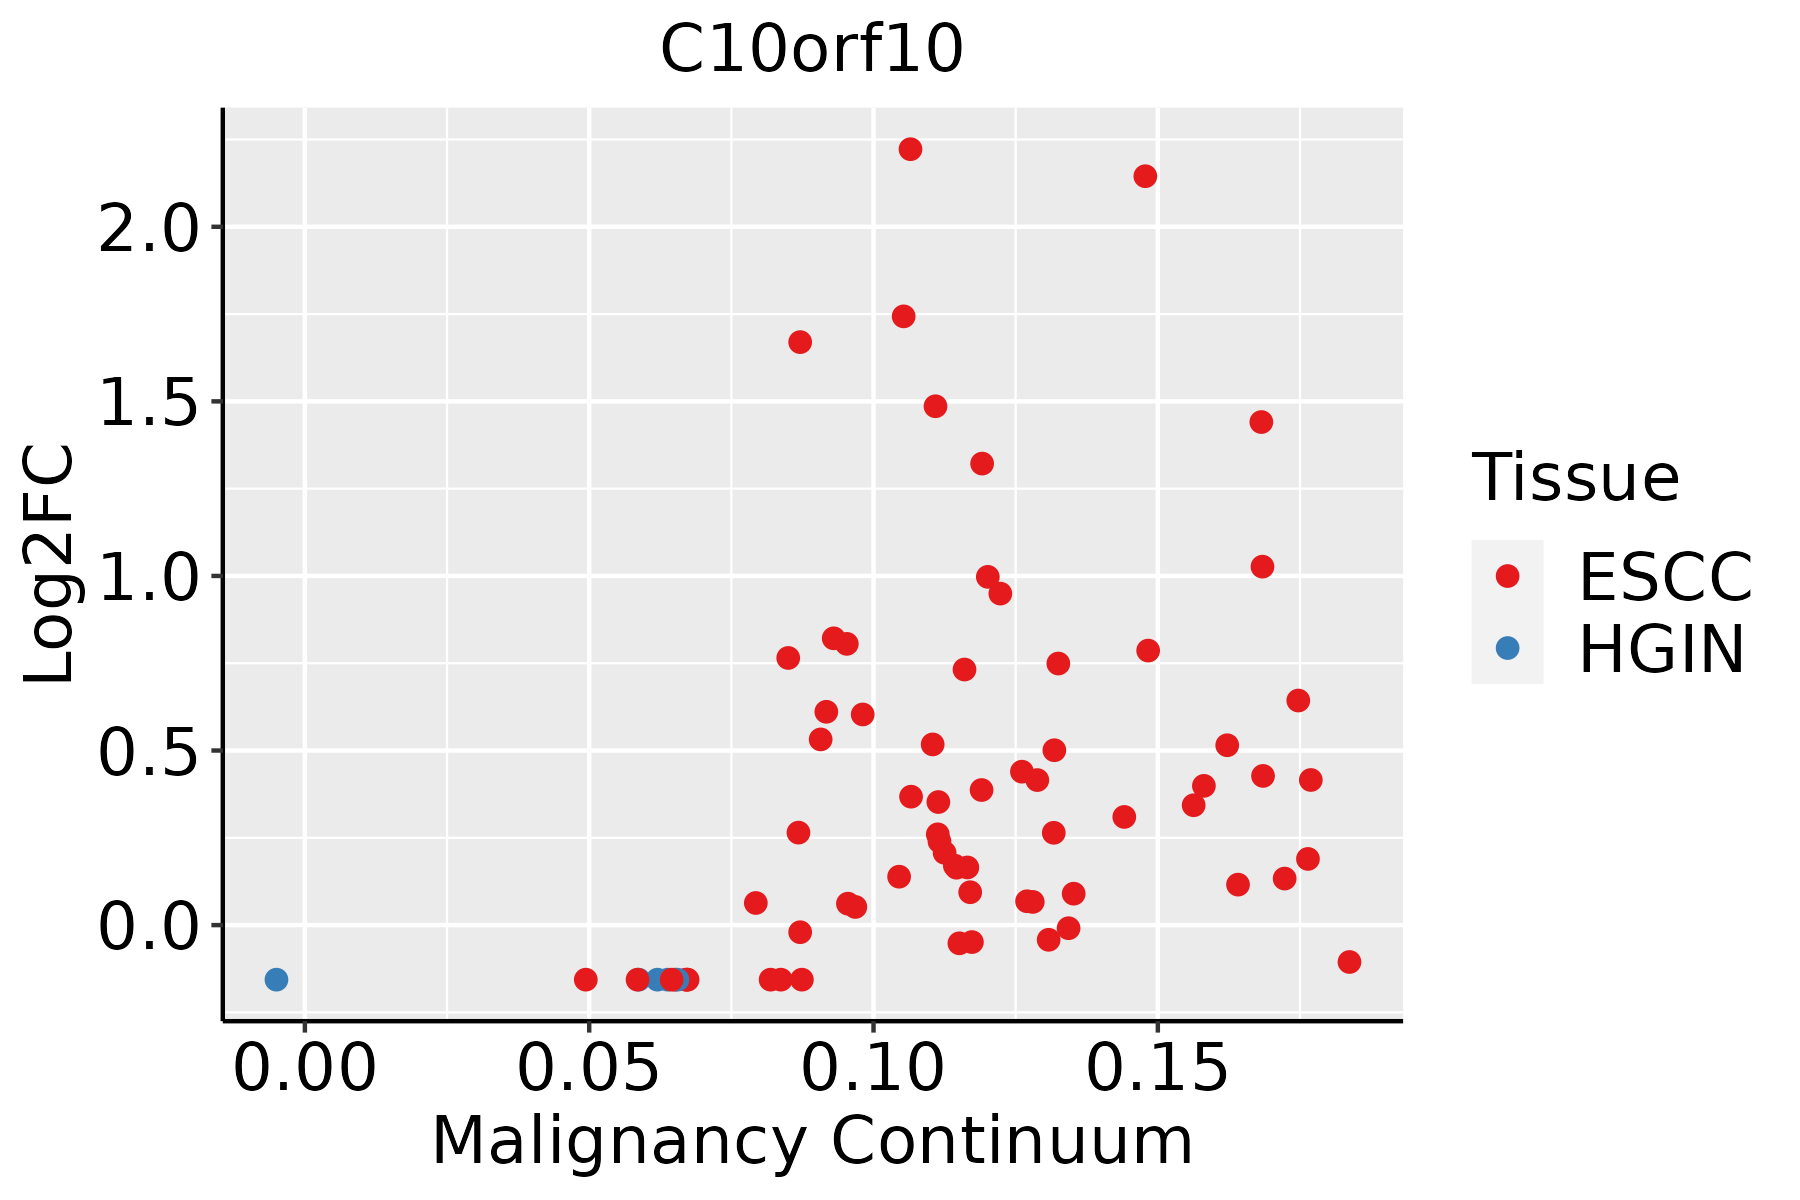 | ESCC: Esophageal squamous cell carcinoma |
| HGIN: High-grade intraepithelial neoplasias | ||
| LGIN: Low-grade intraepithelial neoplasias | ||
| Oral Cavity | 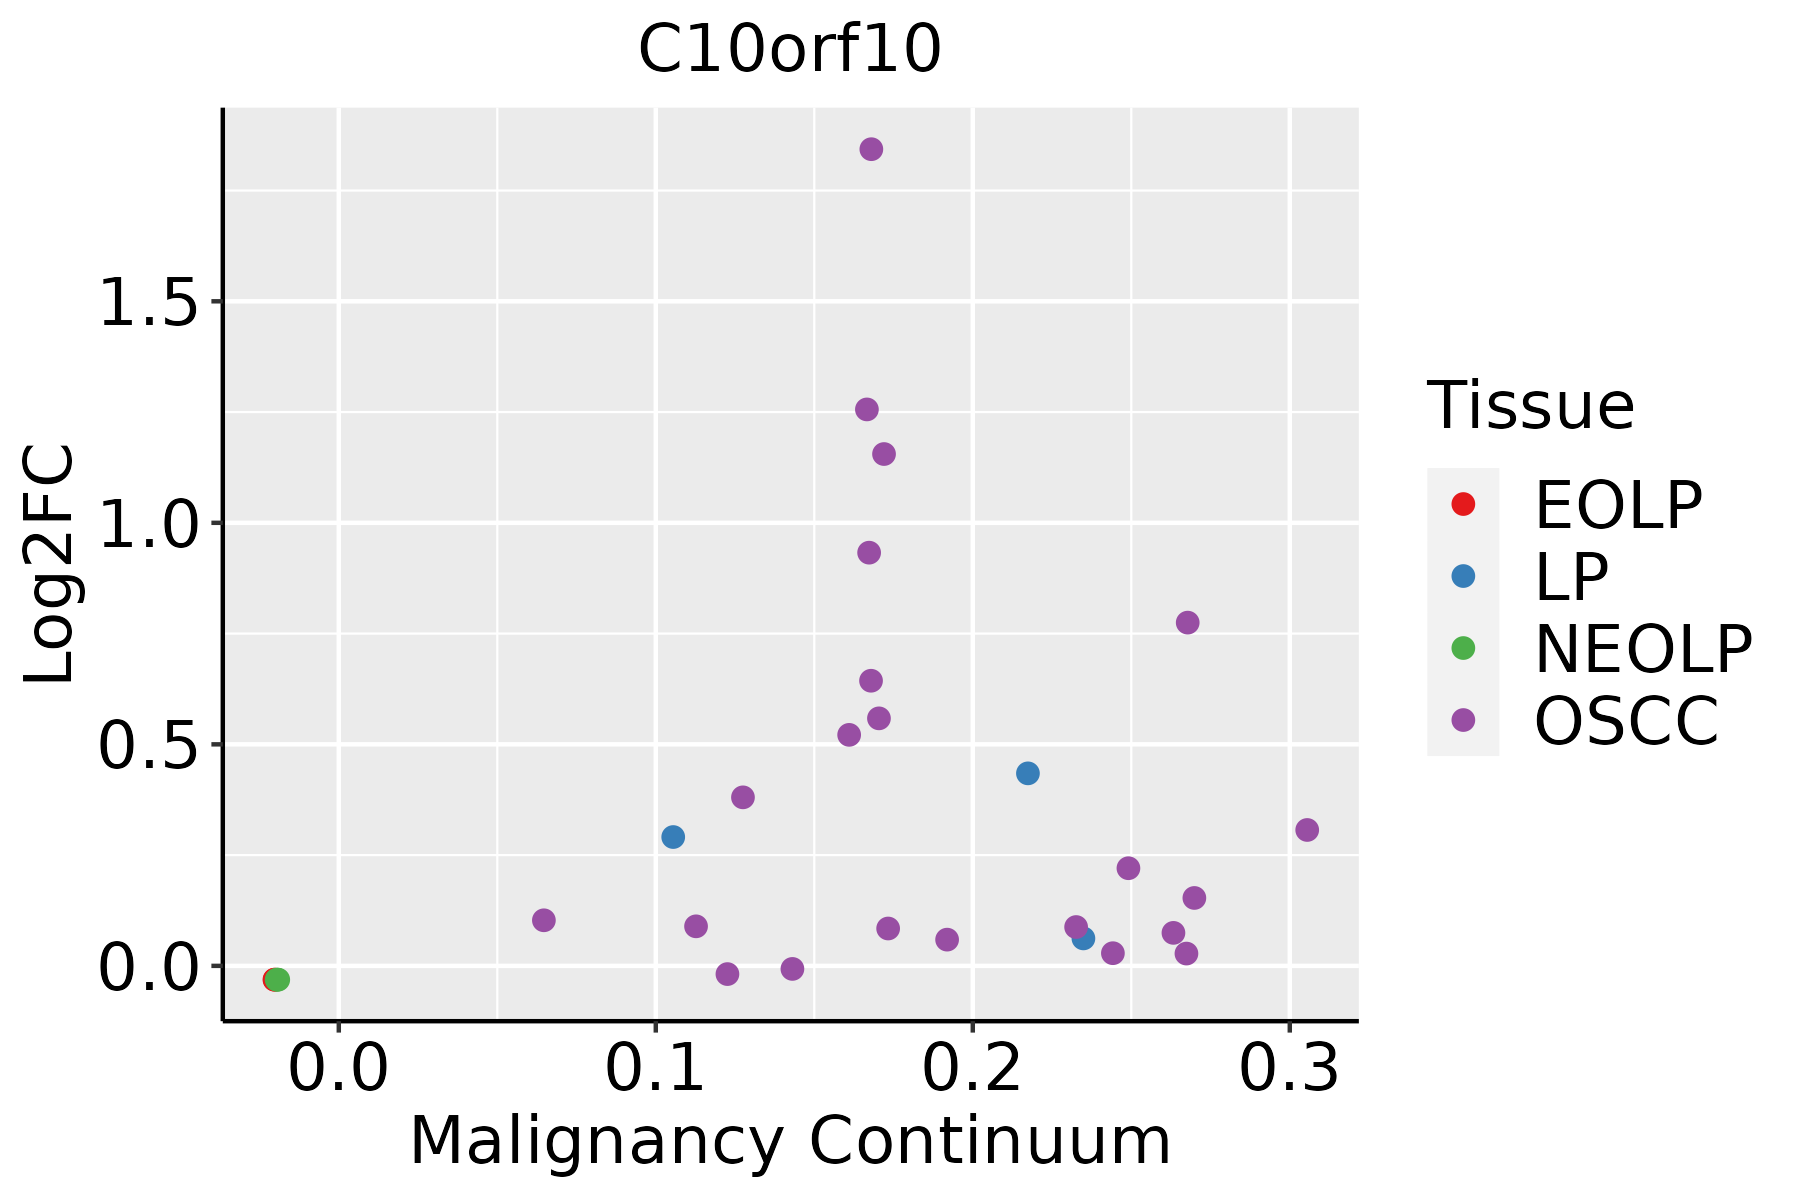 | EOLP: Erosive Oral lichen planus |
| LP: leukoplakia | ||
| NEOLP: Non-erosive oral lichen planus | ||
| OSCC: Oral squamous cell carcinoma | ||
| Prostate | 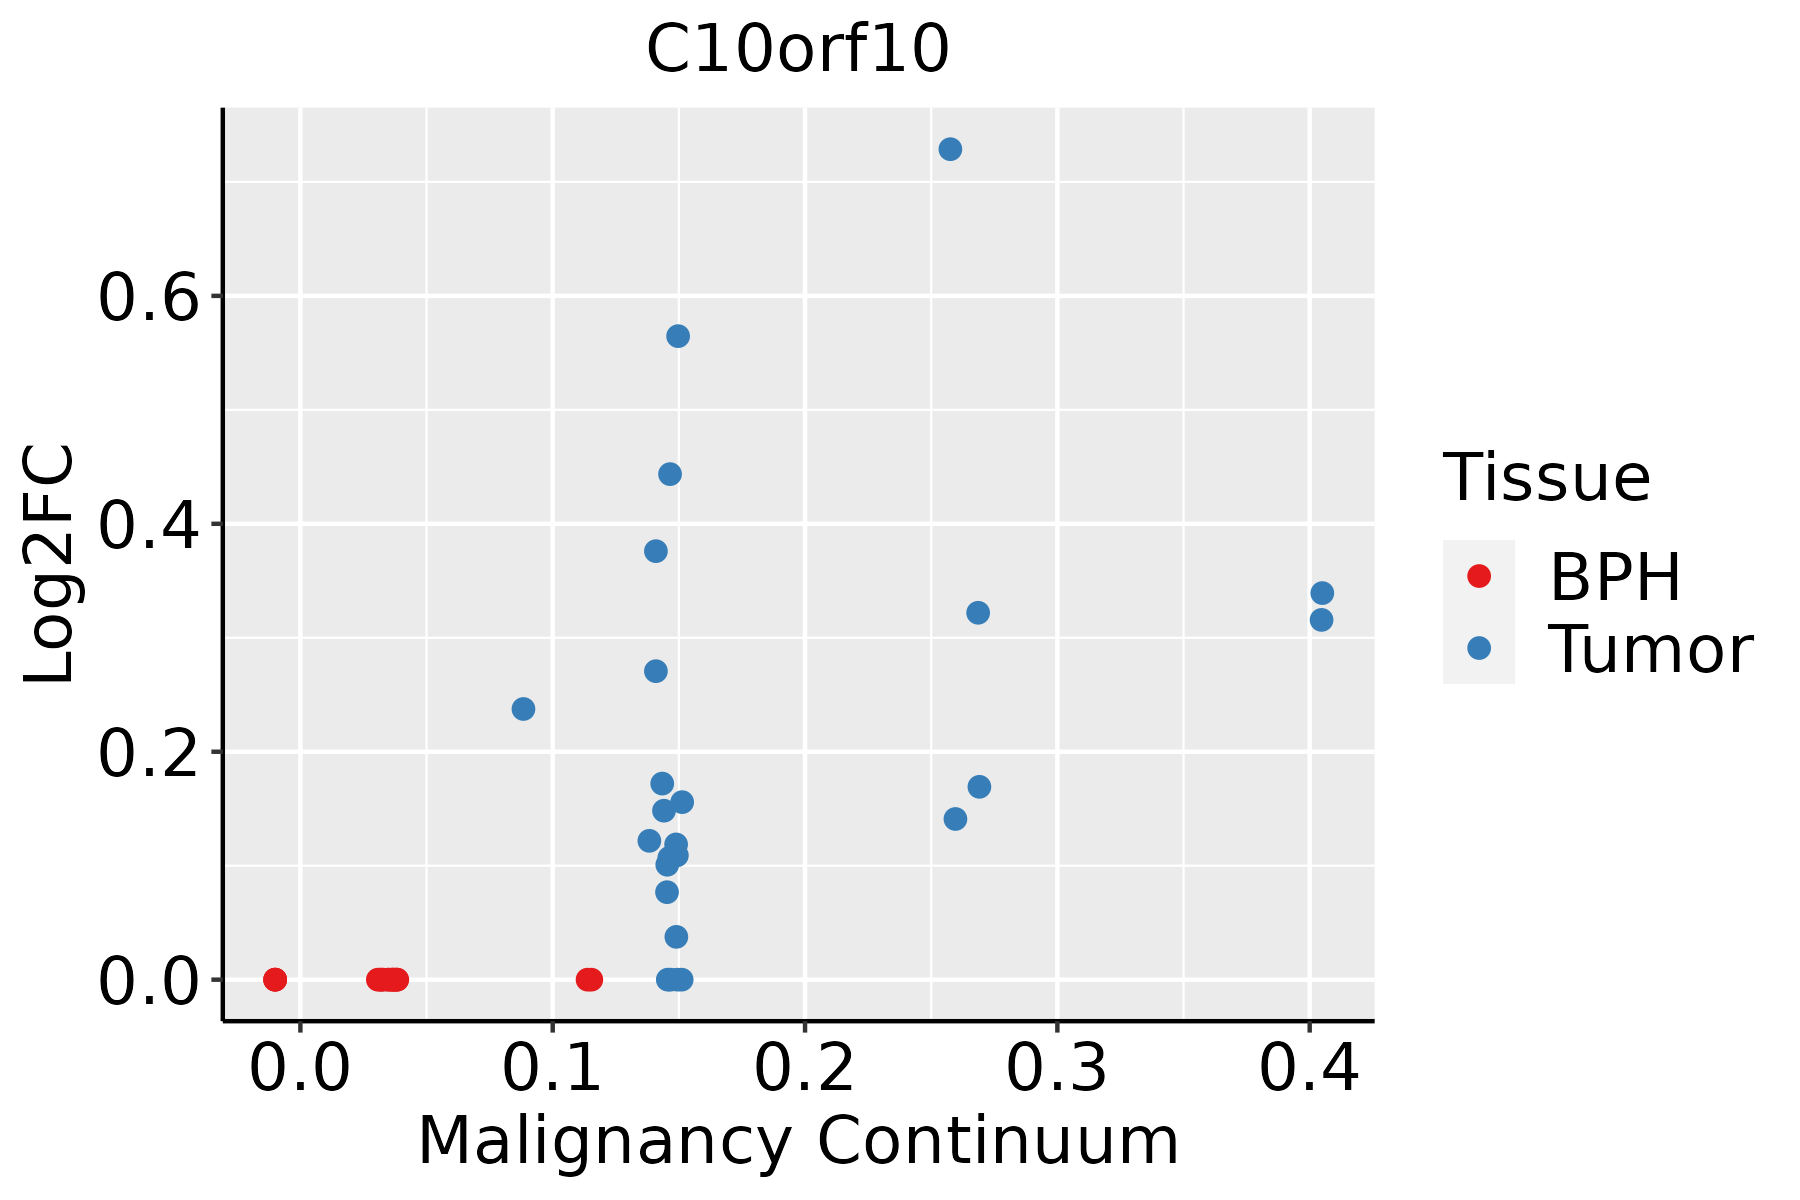 | BPH: Benign Prostatic Hyperplasia |
| ∗log2FC in expression of this searched gene in stem-like cells from each diseased tissue sample relative to stem-like cells in normal samples in each tissue plotted against the malignancy continuum. Samples are colored based on if they are from different disease stage. |
Top |
Malignant transformation related pathway analysis |
| Find out the enriched GO biological processes and KEGG pathways involved in transition from healthy to precancer to cancer |
| Tissue | Disease Stage | Enriched GO biological Processes |
| Colorectum | AD |  |
| Colorectum | SER |  |
| Colorectum | MSS |  |
| Colorectum | MSI-H |  |
| Colorectum | FAP |  |
| ∗Top 15 enriched GO BP terms are showed in the bar plot of each disease state in each tissue. Each row represents a significant GO biological process which is colored according to the -log10(p.adjust). |
| Page: 1 2 3 4 5 6 7 8 9 |
| GO ID | Tissue | Disease Stage | Description | Gene Ratio | Bg Ratio | pvalue | p.adjust | Count |
| Page: 1 |
| Pathway ID | Tissue | Disease Stage | Description | Gene Ratio | Bg Ratio | pvalue | p.adjust | qvalue | Count |
| Page: 1 |
Top |
Cell-cell communication analysis |
| Identification of potential cell-cell interactions between two cell types and their ligand-receptor pairs for different disease states |
| Ligand | Receptor | LRpair | Pathway | Tissue | Disease Stage |
| Page: 1 |
Top |
Single-cell gene regulatory network inference analysis |
| Find out the significant the regulons (TFs) and the target genes of each regulon across cell types for different disease states |
| TF | Cell Type | Tissue | Disease Stage | Target Gene | RSS | Regulon Activity |
| ∗The dot plots of a searched regulon are shown for all cell subpopulations in each disease state of each tissue based on the regulon specific score inferred using pySCENIC and by calculating the average expression. |
| Page: 1 |
Top |
Somatic mutation of malignant transformation related genes |
| Annotation of somatic variants for genes involved in malignant transformation |
| Hugo Symbol | Variant Class | Variant Classification | dbSNP RS | HGVSc | HGVSp | HGVSp Short | SWISSPROT | BIOTYPE | SIFT | PolyPhen | Tumor Sample Barcode | Tissue | Histology | Sex | Age | Stage | Therapy Types | Drugs | Outcome |
| C10orf10 | SNV | Missense_Mutation | c.76N>A | p.Gly26Ser | p.G26S | Q9NTK1 | protein_coding | tolerated(0.22) | possibly_damaging(0.466) | TCGA-Q1-A6DT-01 | Cervix | cervical & endocervical cancer | Female | <65 | I/II | Unknown | Unknown | PD | |
| C10orf10 | SNV | Missense_Mutation | novel | c.326T>G | p.Phe109Cys | p.F109C | Q9NTK1 | protein_coding | deleterious(0) | probably_damaging(0.977) | TCGA-F5-6814-01 | Colorectum | rectum adenocarcinoma | Male | <65 | I/II | Unknown | Unknown | SD |
| C10orf10 | SNV | Missense_Mutation | novel | c.536N>A | p.Thr179Asn | p.T179N | Q9NTK1 | protein_coding | tolerated(0.27) | benign(0.055) | TCGA-A5-A2K5-01 | Endometrium | uterine corpus endometrioid carcinoma | Female | >=65 | I/II | Unknown | Unknown | SD |
| C10orf10 | SNV | Missense_Mutation | novel | c.214N>A | p.Ala72Thr | p.A72T | Q9NTK1 | protein_coding | tolerated(0.46) | benign(0.033) | TCGA-AJ-A3EK-01 | Endometrium | uterine corpus endometrioid carcinoma | Female | <65 | I/II | Chemotherapy | carboplatin | CR |
| C10orf10 | SNV | Missense_Mutation | novel | c.574C>T | p.Arg192Cys | p.R192C | Q9NTK1 | protein_coding | deleterious(0.03) | benign(0.159) | TCGA-B5-A1MX-01 | Endometrium | uterine corpus endometrioid carcinoma | Female | <65 | I/II | Hormone Therapy | megace | SD |
| C10orf10 | SNV | Missense_Mutation | novel | c.56N>T | p.Thr19Met | p.T19M | Q9NTK1 | protein_coding | tolerated(0.06) | benign(0.216) | TCGA-EO-A22U-01 | Endometrium | uterine corpus endometrioid carcinoma | Female | >=65 | I/II | Unknown | Unknown | SD |
| C10orf10 | SNV | Missense_Mutation | rs188702994 | c.259N>A | p.Ala87Thr | p.A87T | Q9NTK1 | protein_coding | tolerated(0.89) | benign(0.001) | TCGA-EY-A215-01 | Endometrium | uterine corpus endometrioid carcinoma | Female | <65 | I/II | Unknown | Unknown | SD |
| C10orf10 | SNV | Missense_Mutation | c.305N>C | p.Val102Ala | p.V102A | Q9NTK1 | protein_coding | tolerated(1) | benign(0.001) | TCGA-33-4566-01 | Lung | lung squamous cell carcinoma | Male | <65 | I/II | Unknown | Unknown | SD | |
| C10orf10 | SNV | Missense_Mutation | novel | c.316G>C | p.Asp106His | p.D106H | Q9NTK1 | protein_coding | deleterious(0.02) | probably_damaging(0.99) | TCGA-34-2605-01 | Lung | lung squamous cell carcinoma | Male | >=65 | III/IV | Chemotherapy | cisplatin | PD |
| C10orf10 | SNV | Missense_Mutation | novel | c.335N>T | p.Ser112Phe | p.S112F | Q9NTK1 | protein_coding | deleterious(0.02) | benign(0.04) | TCGA-NC-A5HD-01 | Lung | lung squamous cell carcinoma | Male | >=65 | I/II | Unknown | Unknown | SD |
| Page: 1 2 |
Top |
Related drugs of malignant transformation related genes |
| Identification of chemicals and drugs interact with genes involved in malignant transfromation |
| (DGIdb 4.0) |
| Entrez ID | Symbol | Category | Interaction Types | Drug Claim Name | Drug Name | PMIDs |
| Page: 1 |

Copyright 2023-Present -The University of Texas Health Science Center at Houston |