
|
|||||
|
 | |
| |
| |
| |
| |
| |
|
Gene: BZW2 |
Gene summary for BZW2 |
| Gene information | Species | Human | Gene symbol | BZW2 | Gene ID | 28969 |
| Gene name | basic leucine zipper and W2 domains 2 | |
| Gene Alias | 5MP1 | |
| Cytomap | 7p21.1 | |
| Gene Type | protein-coding | GO ID | GO:0007275 | UniProtAcc | A0A024RA42 |
Top |
Malignant transformation analysis |
| Identification of the aberrant gene expression in precancerous and cancerous lesions by comparing the gene expression of stem-like cells in diseased tissues with normal stem cells |
| Entrez ID | Symbol | Replicates | Species | Organ | Tissue | Adj P-value | Log2FC | Malignancy |
| 28969 | BZW2 | LZE2T | Human | Esophagus | ESCC | 6.98e-05 | 9.70e-01 | 0.082 |
| 28969 | BZW2 | LZE4T | Human | Esophagus | ESCC | 1.78e-13 | 5.41e-01 | 0.0811 |
| 28969 | BZW2 | LZE7T | Human | Esophagus | ESCC | 3.23e-07 | 7.67e-01 | 0.0667 |
| 28969 | BZW2 | LZE8T | Human | Esophagus | ESCC | 1.30e-14 | 4.44e-01 | 0.067 |
| 28969 | BZW2 | LZE20T | Human | Esophagus | ESCC | 3.69e-07 | 2.86e-01 | 0.0662 |
| 28969 | BZW2 | LZE24T | Human | Esophagus | ESCC | 1.55e-11 | 5.05e-01 | 0.0596 |
| 28969 | BZW2 | LZE21T | Human | Esophagus | ESCC | 1.33e-05 | 5.03e-01 | 0.0655 |
| 28969 | BZW2 | LZE6T | Human | Esophagus | ESCC | 2.36e-07 | 1.74e-01 | 0.0845 |
| 28969 | BZW2 | P1T-E | Human | Esophagus | ESCC | 1.80e-06 | 5.66e-01 | 0.0875 |
| 28969 | BZW2 | P2T-E | Human | Esophagus | ESCC | 5.73e-46 | 9.65e-01 | 0.1177 |
| 28969 | BZW2 | P4T-E | Human | Esophagus | ESCC | 5.61e-34 | 1.10e+00 | 0.1323 |
| 28969 | BZW2 | P5T-E | Human | Esophagus | ESCC | 1.01e-42 | 9.12e-01 | 0.1327 |
| 28969 | BZW2 | P8T-E | Human | Esophagus | ESCC | 3.47e-25 | 6.06e-01 | 0.0889 |
| 28969 | BZW2 | P9T-E | Human | Esophagus | ESCC | 1.06e-26 | 8.43e-01 | 0.1131 |
| 28969 | BZW2 | P10T-E | Human | Esophagus | ESCC | 2.95e-68 | 1.28e+00 | 0.116 |
| 28969 | BZW2 | P11T-E | Human | Esophagus | ESCC | 4.22e-14 | 1.02e+00 | 0.1426 |
| 28969 | BZW2 | P12T-E | Human | Esophagus | ESCC | 7.83e-37 | 8.70e-01 | 0.1122 |
| 28969 | BZW2 | P15T-E | Human | Esophagus | ESCC | 6.73e-39 | 1.08e+00 | 0.1149 |
| 28969 | BZW2 | P16T-E | Human | Esophagus | ESCC | 1.38e-65 | 1.36e+00 | 0.1153 |
| 28969 | BZW2 | P17T-E | Human | Esophagus | ESCC | 1.07e-06 | 7.40e-01 | 0.1278 |
| Page: 1 2 3 4 5 6 |
| Tissue | Expression Dynamics | Abbreviation |
| Esophagus |  | ESCC: Esophageal squamous cell carcinoma |
| HGIN: High-grade intraepithelial neoplasias | ||
| LGIN: Low-grade intraepithelial neoplasias | ||
| Liver | 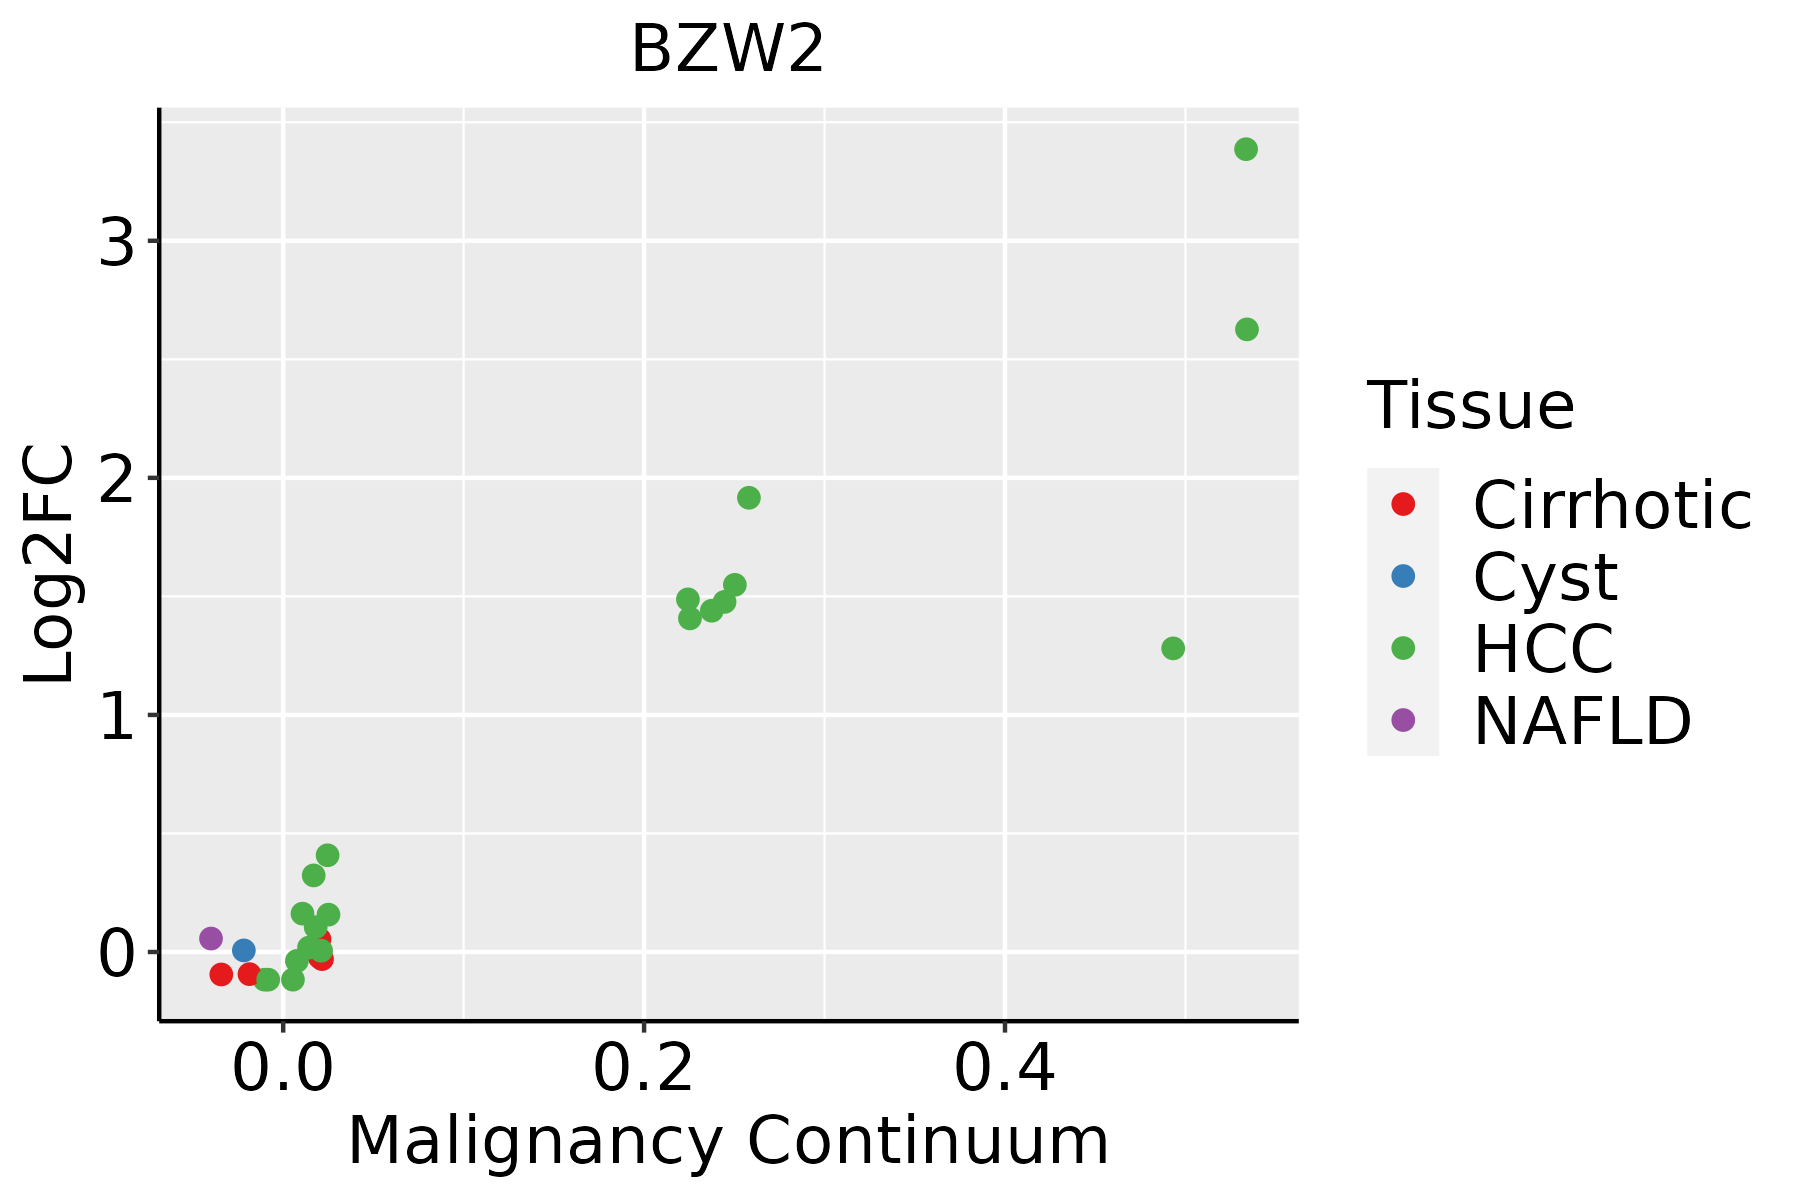 | HCC: Hepatocellular carcinoma |
| NAFLD: Non-alcoholic fatty liver disease | ||
| Oral Cavity |  | EOLP: Erosive Oral lichen planus |
| LP: leukoplakia | ||
| NEOLP: Non-erosive oral lichen planus | ||
| OSCC: Oral squamous cell carcinoma | ||
| Prostate |  | BPH: Benign Prostatic Hyperplasia |
| Skin |  | AK: Actinic keratosis |
| cSCC: Cutaneous squamous cell carcinoma | ||
| SCCIS:squamous cell carcinoma in situ | ||
| Thyroid | 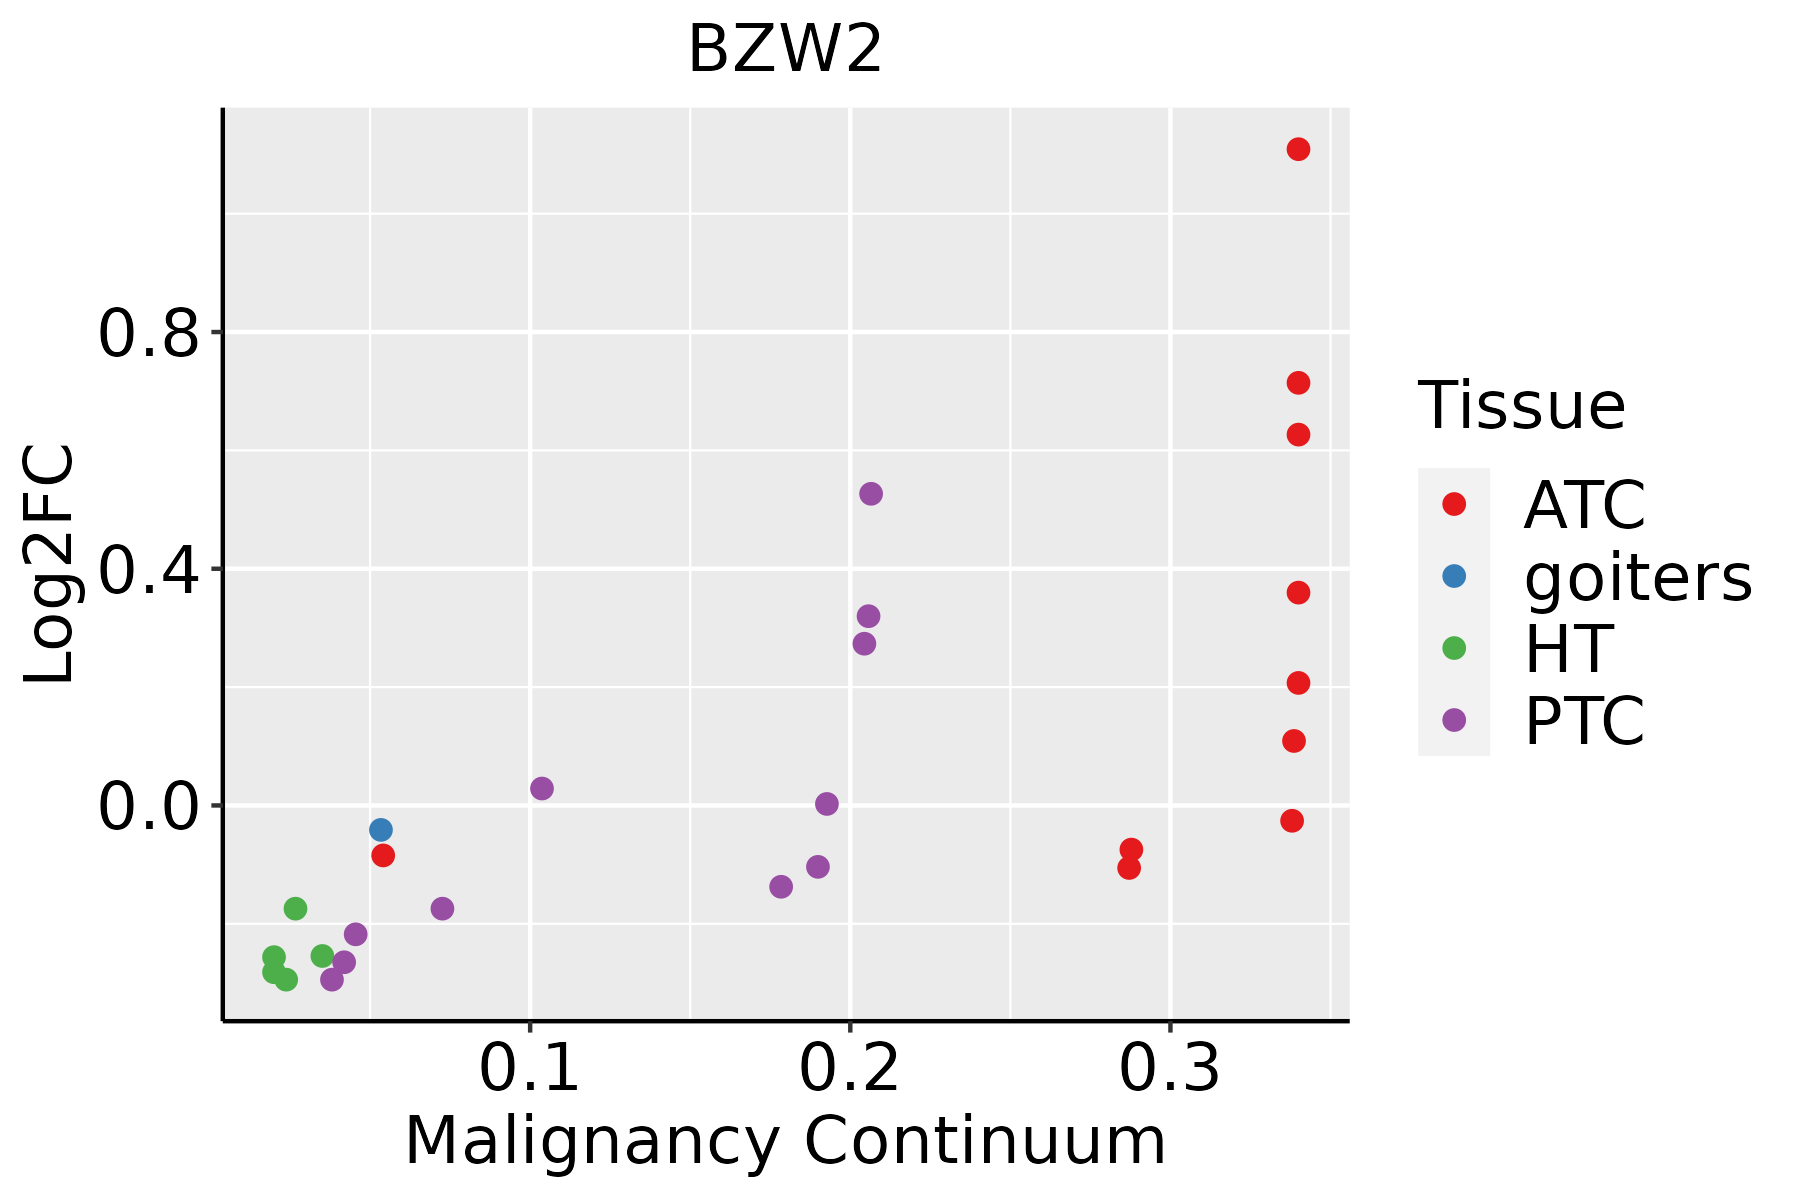 | ATC: Anaplastic thyroid cancer |
| HT: Hashimoto's thyroiditis | ||
| PTC: Papillary thyroid cancer |
| ∗log2FC in expression of this searched gene in stem-like cells from each diseased tissue sample relative to stem-like cells in normal samples in each tissue plotted against the malignancy continuum. Samples are colored based on if they are from different disease stage. |
Top |
Malignant transformation related pathway analysis |
| Find out the enriched GO biological processes and KEGG pathways involved in transition from healthy to precancer to cancer |
| Tissue | Disease Stage | Enriched GO biological Processes |
| Colorectum | AD |  |
| Colorectum | SER |  |
| Colorectum | MSS |  |
| Colorectum | MSI-H |  |
| Colorectum | FAP |  |
| ∗Top 15 enriched GO BP terms are showed in the bar plot of each disease state in each tissue. Each row represents a significant GO biological process which is colored according to the -log10(p.adjust). |
| Page: 1 2 3 4 5 6 7 8 9 |
| GO ID | Tissue | Disease Stage | Description | Gene Ratio | Bg Ratio | pvalue | p.adjust | Count |
| Page: 1 |
| Pathway ID | Tissue | Disease Stage | Description | Gene Ratio | Bg Ratio | pvalue | p.adjust | qvalue | Count |
| Page: 1 |
Top |
Cell-cell communication analysis |
| Identification of potential cell-cell interactions between two cell types and their ligand-receptor pairs for different disease states |
| Ligand | Receptor | LRpair | Pathway | Tissue | Disease Stage |
| Page: 1 |
Top |
Single-cell gene regulatory network inference analysis |
| Find out the significant the regulons (TFs) and the target genes of each regulon across cell types for different disease states |
| TF | Cell Type | Tissue | Disease Stage | Target Gene | RSS | Regulon Activity |
| ∗The dot plots of a searched regulon are shown for all cell subpopulations in each disease state of each tissue based on the regulon specific score inferred using pySCENIC and by calculating the average expression. |
| Page: 1 |
Top |
Somatic mutation of malignant transformation related genes |
| Annotation of somatic variants for genes involved in malignant transformation |
| Hugo Symbol | Variant Class | Variant Classification | dbSNP RS | HGVSc | HGVSp | HGVSp Short | SWISSPROT | BIOTYPE | SIFT | PolyPhen | Tumor Sample Barcode | Tissue | Histology | Sex | Age | Stage | Therapy Types | Drugs | Outcome |
| BZW2 | SNV | Missense_Mutation | rs779376411 | c.901N>G | p.Ile301Val | p.I301V | Q9Y6E2 | protein_coding | tolerated(1) | benign(0) | TCGA-BH-A0HA-01 | Breast | breast invasive carcinoma | Female | <65 | I/II | Unknown | Unknown | SD |
| BZW2 | SNV | Missense_Mutation | novel | c.130G>T | p.Asp44Tyr | p.D44Y | Q9Y6E2 | protein_coding | deleterious(0) | probably_damaging(0.993) | TCGA-E9-A3QA-01 | Breast | breast invasive carcinoma | Female | <65 | I/II | Unknown | Unknown | SD |
| BZW2 | SNV | Missense_Mutation | c.1194N>T | p.Met398Ile | p.M398I | Q9Y6E2 | protein_coding | deleterious(0.03) | probably_damaging(0.932) | TCGA-GI-A2C8-01 | Breast | breast invasive carcinoma | Female | <65 | III/IV | Unspecific | Adriamycin | SD | |
| BZW2 | SNV | Missense_Mutation | novel | c.877G>A | p.Val293Met | p.V293M | Q9Y6E2 | protein_coding | tolerated(0.17) | benign(0.01) | TCGA-2W-A8YY-01 | Cervix | cervical & endocervical cancer | Female | <65 | I/II | Chemotherapy | cisplatin | CR |
| BZW2 | SNV | Missense_Mutation | c.307G>A | p.Glu103Lys | p.E103K | Q9Y6E2 | protein_coding | tolerated(0.16) | probably_damaging(0.956) | TCGA-DR-A0ZM-01 | Cervix | cervical & endocervical cancer | Female | <65 | III/IV | Unspecific | Cisplatin | SD | |
| BZW2 | SNV | Missense_Mutation | c.158N>G | p.Asp53Gly | p.D53G | Q9Y6E2 | protein_coding | deleterious(0) | probably_damaging(0.977) | TCGA-AD-6895-01 | Colorectum | colon adenocarcinoma | Male | >=65 | III/IV | Unknown | Unknown | SD | |
| BZW2 | SNV | Missense_Mutation | rs755081715 | c.1237G>A | p.Glu413Lys | p.E413K | Q9Y6E2 | protein_coding | tolerated(0.08) | probably_damaging(0.974) | TCGA-AG-A002-01 | Colorectum | rectum adenocarcinoma | Male | <65 | I/II | Unknown | Unknown | SD |
| BZW2 | insertion | In_Frame_Ins | novel | c.704_705insATT | p.Thr235_Asp236insPhe | p.T235_D236insF | Q9Y6E2 | protein_coding | TCGA-AM-5820-01 | Colorectum | colon adenocarcinoma | Female | <65 | I/II | Unknown | Unknown | SD | ||
| BZW2 | insertion | Nonsense_Mutation | novel | c.706_707insGAAGAAAAGAATA | p.Asp236GlyfsTer5 | p.D236Gfs*5 | Q9Y6E2 | protein_coding | TCGA-AM-5820-01 | Colorectum | colon adenocarcinoma | Female | <65 | I/II | Unknown | Unknown | SD | ||
| BZW2 | SNV | Missense_Mutation | novel | c.560N>A | p.Ala187Asp | p.A187D | Q9Y6E2 | protein_coding | deleterious(0.02) | probably_damaging(0.99) | TCGA-AJ-A3EL-01 | Endometrium | uterine corpus endometrioid carcinoma | Female | <65 | I/II | Unknown | Unknown | SD |
| Page: 1 2 3 4 |
Top |
Related drugs of malignant transformation related genes |
| Identification of chemicals and drugs interact with genes involved in malignant transfromation |
| (DGIdb 4.0) |
| Entrez ID | Symbol | Category | Interaction Types | Drug Claim Name | Drug Name | PMIDs |
| Page: 1 |

Copyright 2023-Present -The University of Texas Health Science Center at Houston |