
|
|||||
|
 | |
| |
| |
| |
| |
| |
|
Gene: BYSL |
Gene summary for BYSL |
| Gene information | Species | Human | Gene symbol | BYSL | Gene ID | 705 |
| Gene name | bystin like | |
| Gene Alias | BYSTIN | |
| Cytomap | 6p21.1 | |
| Gene Type | protein-coding | GO ID | GO:0000462 | UniProtAcc | Q13895 |
Top |
Malignant transformation analysis |
| Identification of the aberrant gene expression in precancerous and cancerous lesions by comparing the gene expression of stem-like cells in diseased tissues with normal stem cells |
| Entrez ID | Symbol | Replicates | Species | Organ | Tissue | Adj P-value | Log2FC | Malignancy |
| 705 | BYSL | LZE2T | Human | Esophagus | ESCC | 6.25e-04 | 8.17e-01 | 0.082 |
| 705 | BYSL | LZE7T | Human | Esophagus | ESCC | 9.72e-03 | 1.70e-01 | 0.0667 |
| 705 | BYSL | LZE22T | Human | Esophagus | ESCC | 3.26e-03 | 1.03e-01 | 0.068 |
| 705 | BYSL | LZE24T | Human | Esophagus | ESCC | 3.68e-04 | 7.08e-02 | 0.0596 |
| 705 | BYSL | P1T-E | Human | Esophagus | ESCC | 4.64e-02 | 5.53e-02 | 0.0875 |
| 705 | BYSL | P2T-E | Human | Esophagus | ESCC | 3.33e-12 | 2.02e-01 | 0.1177 |
| 705 | BYSL | P4T-E | Human | Esophagus | ESCC | 2.64e-08 | 2.89e-01 | 0.1323 |
| 705 | BYSL | P5T-E | Human | Esophagus | ESCC | 2.73e-18 | 3.54e-01 | 0.1327 |
| 705 | BYSL | P9T-E | Human | Esophagus | ESCC | 3.47e-10 | 2.31e-01 | 0.1131 |
| 705 | BYSL | P10T-E | Human | Esophagus | ESCC | 2.96e-10 | 1.07e-01 | 0.116 |
| 705 | BYSL | P11T-E | Human | Esophagus | ESCC | 9.57e-09 | 2.67e-01 | 0.1426 |
| 705 | BYSL | P12T-E | Human | Esophagus | ESCC | 1.01e-08 | 1.49e-01 | 0.1122 |
| 705 | BYSL | P15T-E | Human | Esophagus | ESCC | 8.55e-08 | 1.25e-01 | 0.1149 |
| 705 | BYSL | P16T-E | Human | Esophagus | ESCC | 4.28e-16 | 1.62e-01 | 0.1153 |
| 705 | BYSL | P17T-E | Human | Esophagus | ESCC | 6.48e-11 | 4.49e-01 | 0.1278 |
| 705 | BYSL | P19T-E | Human | Esophagus | ESCC | 2.78e-03 | 3.43e-01 | 0.1662 |
| 705 | BYSL | P20T-E | Human | Esophagus | ESCC | 1.97e-08 | -1.45e-02 | 0.1124 |
| 705 | BYSL | P21T-E | Human | Esophagus | ESCC | 4.32e-14 | 3.78e-01 | 0.1617 |
| 705 | BYSL | P22T-E | Human | Esophagus | ESCC | 6.74e-15 | 1.50e-01 | 0.1236 |
| 705 | BYSL | P23T-E | Human | Esophagus | ESCC | 3.88e-14 | 3.55e-01 | 0.108 |
| Page: 1 2 3 4 5 |
| Tissue | Expression Dynamics | Abbreviation |
| Esophagus |  | ESCC: Esophageal squamous cell carcinoma |
| HGIN: High-grade intraepithelial neoplasias | ||
| LGIN: Low-grade intraepithelial neoplasias | ||
| Liver | 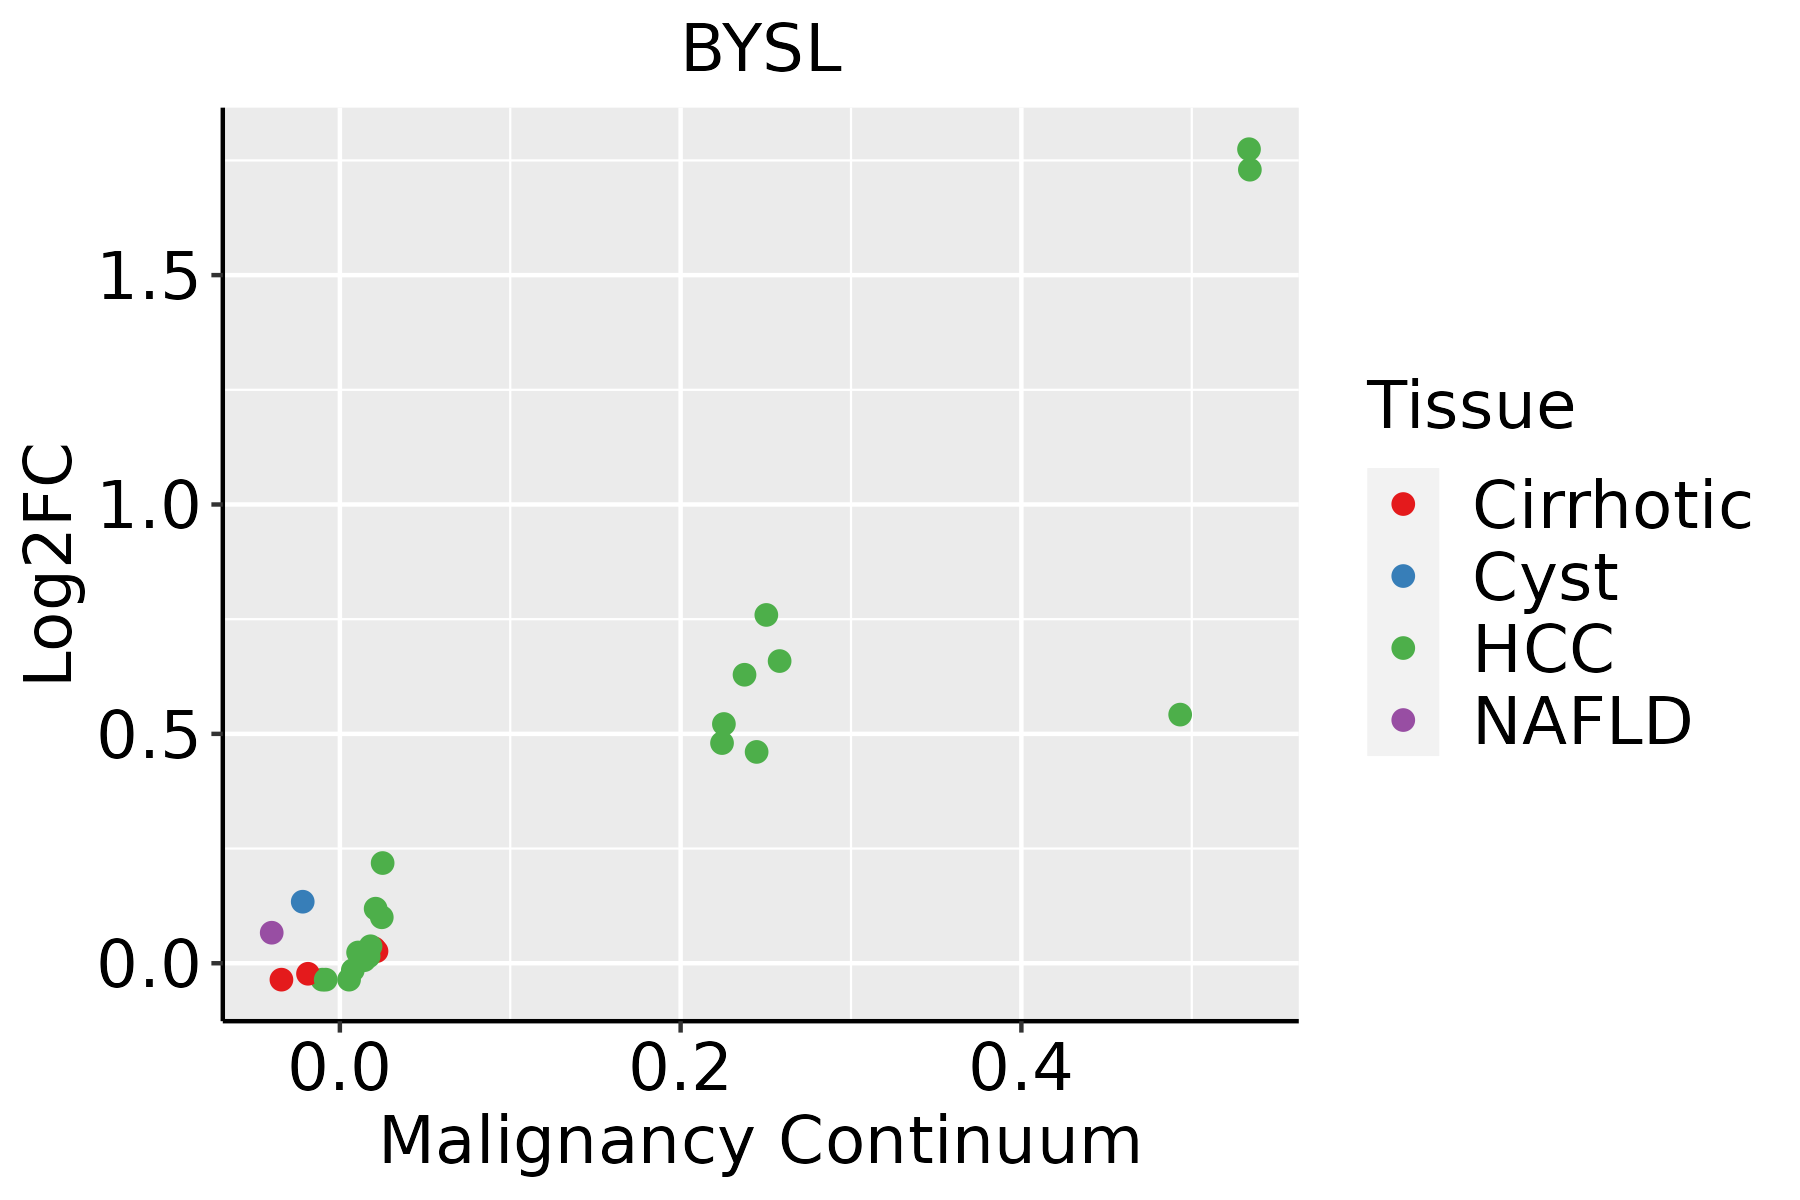 | HCC: Hepatocellular carcinoma |
| NAFLD: Non-alcoholic fatty liver disease | ||
| Oral Cavity | 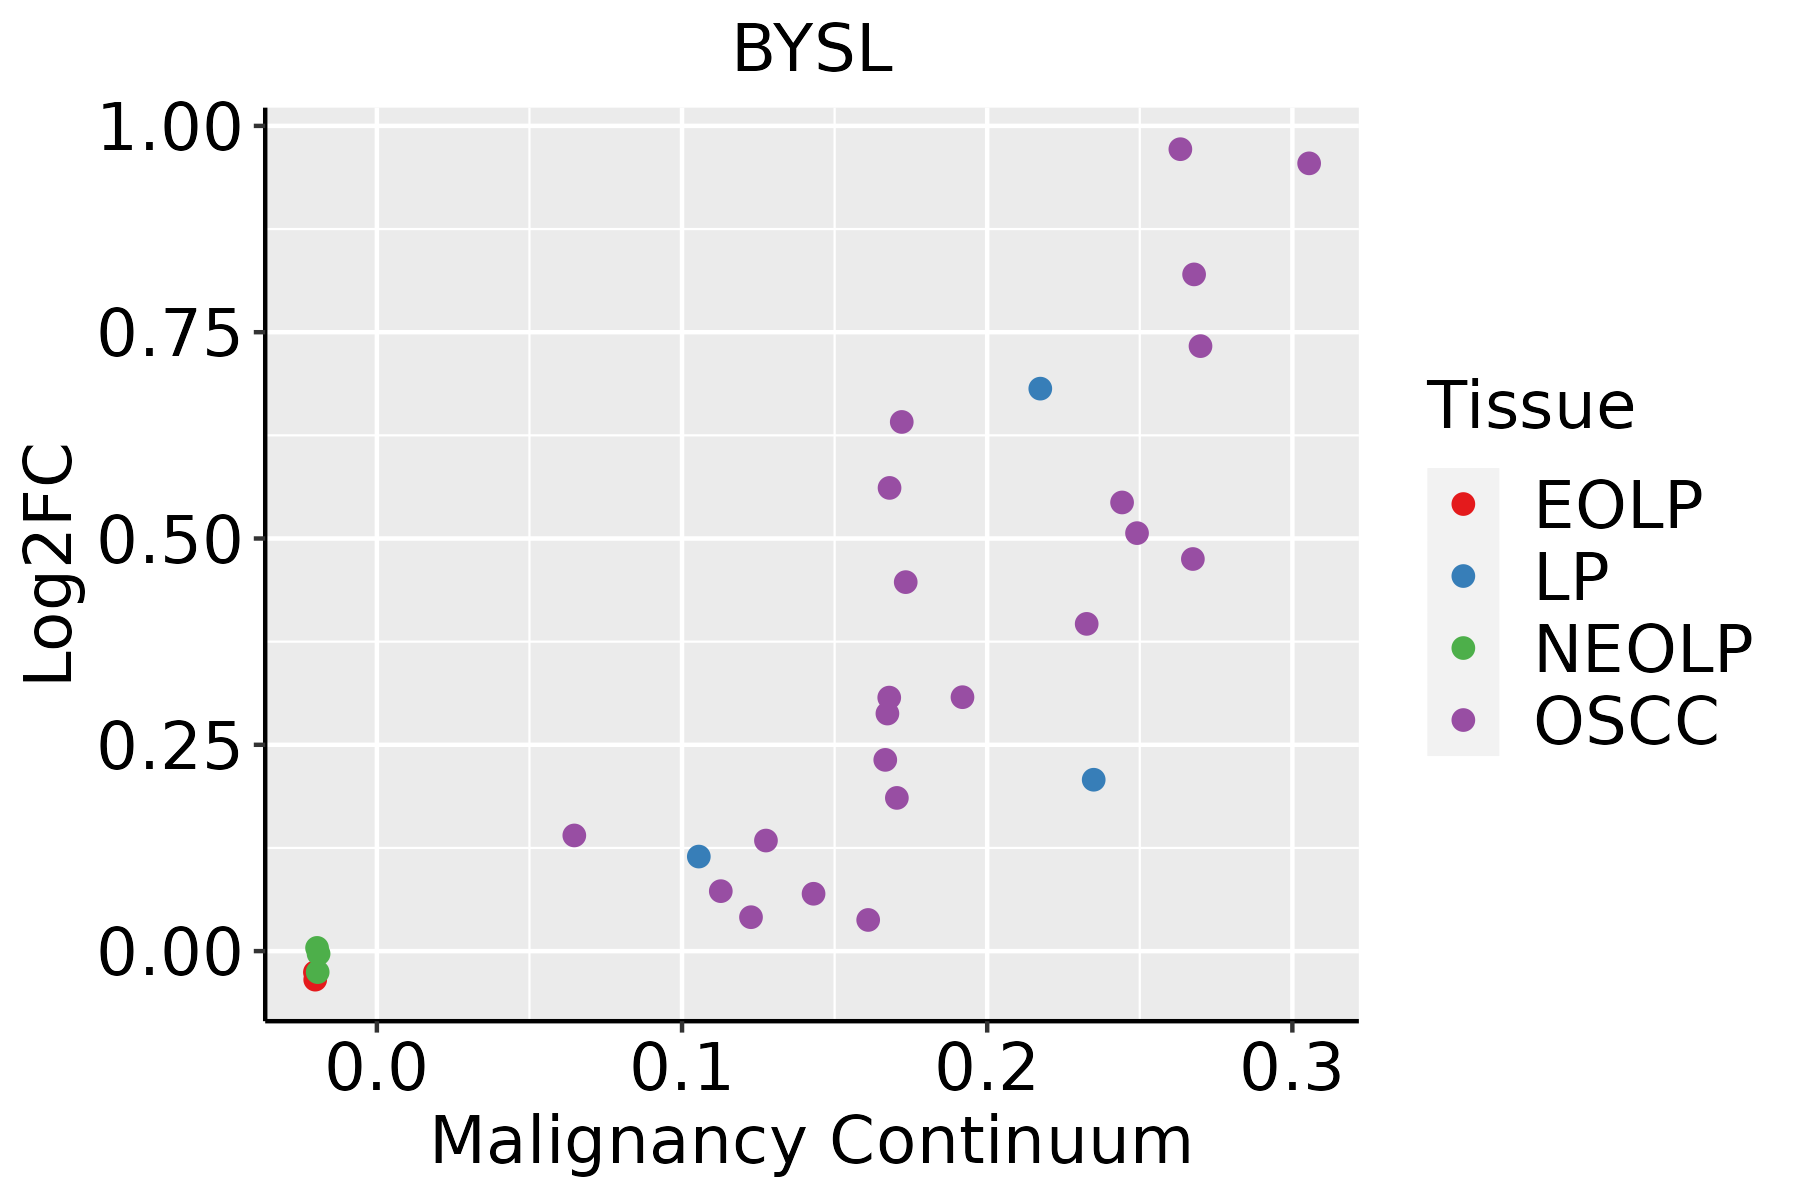 | EOLP: Erosive Oral lichen planus |
| LP: leukoplakia | ||
| NEOLP: Non-erosive oral lichen planus | ||
| OSCC: Oral squamous cell carcinoma | ||
| Skin |  | AK: Actinic keratosis |
| cSCC: Cutaneous squamous cell carcinoma | ||
| SCCIS:squamous cell carcinoma in situ | ||
| Thyroid | 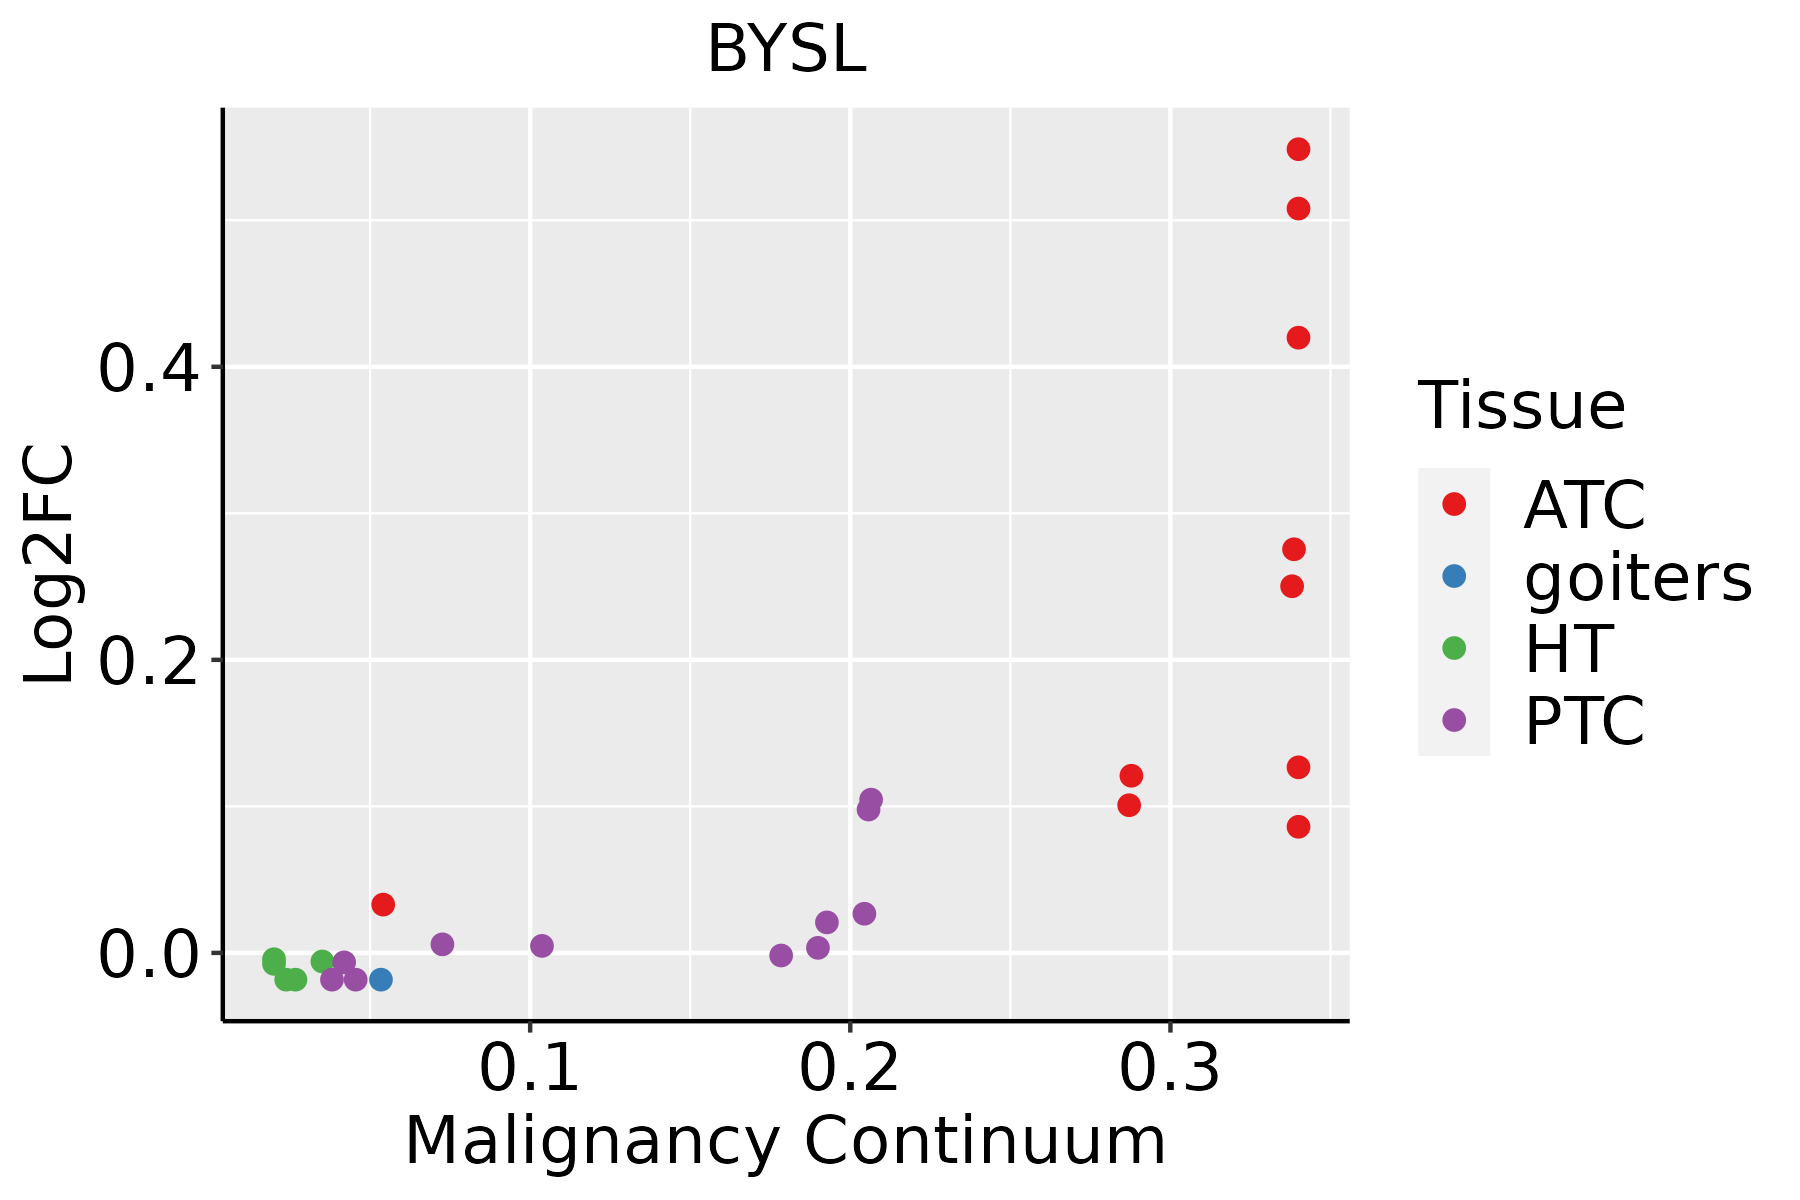 | ATC: Anaplastic thyroid cancer |
| HT: Hashimoto's thyroiditis | ||
| PTC: Papillary thyroid cancer |
| ∗log2FC in expression of this searched gene in stem-like cells from each diseased tissue sample relative to stem-like cells in normal samples in each tissue plotted against the malignancy continuum. Samples are colored based on if they are from different disease stage. |
Top |
Malignant transformation related pathway analysis |
| Find out the enriched GO biological processes and KEGG pathways involved in transition from healthy to precancer to cancer |
| Tissue | Disease Stage | Enriched GO biological Processes |
| Colorectum | AD |  |
| Colorectum | SER |  |
| Colorectum | MSS |  |
| Colorectum | MSI-H |  |
| Colorectum | FAP |  |
| ∗Top 15 enriched GO BP terms are showed in the bar plot of each disease state in each tissue. Each row represents a significant GO biological process which is colored according to the -log10(p.adjust). |
| Page: 1 2 3 4 5 6 7 8 9 |
| GO ID | Tissue | Disease Stage | Description | Gene Ratio | Bg Ratio | pvalue | p.adjust | Count |
| GO:0022613111 | Esophagus | ESCC | ribonucleoprotein complex biogenesis | 365/8552 | 463/18723 | 1.74e-49 | 1.11e-45 | 365 |
| GO:0042254111 | Esophagus | ESCC | ribosome biogenesis | 252/8552 | 299/18723 | 3.27e-44 | 1.04e-40 | 252 |
| GO:003447015 | Esophagus | ESCC | ncRNA processing | 300/8552 | 395/18723 | 3.09e-35 | 3.26e-32 | 300 |
| GO:0016072110 | Esophagus | ESCC | rRNA metabolic process | 197/8552 | 236/18723 | 1.31e-33 | 1.18e-30 | 197 |
| GO:0006364110 | Esophagus | ESCC | rRNA processing | 189/8552 | 225/18723 | 4.88e-33 | 3.87e-30 | 189 |
| GO:003466012 | Esophagus | ESCC | ncRNA metabolic process | 346/8552 | 485/18723 | 4.35e-31 | 2.51e-28 | 346 |
| GO:003450418 | Esophagus | ESCC | protein localization to nucleus | 211/8552 | 290/18723 | 4.06e-21 | 6.60e-19 | 211 |
| GO:0042274111 | Esophagus | ESCC | ribosomal small subunit biogenesis | 67/8552 | 73/18723 | 6.62e-17 | 5.38e-15 | 67 |
| GO:000170119 | Esophagus | ESCC | in utero embryonic development | 243/8552 | 367/18723 | 1.00e-15 | 6.86e-14 | 243 |
| GO:190018018 | Esophagus | ESCC | regulation of protein localization to nucleus | 102/8552 | 136/18723 | 2.84e-12 | 1.13e-10 | 102 |
| GO:00304904 | Esophagus | ESCC | maturation of SSU-rRNA | 45/8552 | 50/18723 | 5.07e-11 | 1.63e-09 | 45 |
| GO:00004623 | Esophagus | ESCC | maturation of SSU-rRNA from tricistronic rRNA transcript (SSU-rRNA, 5.8S rRNA, LSU-rRNA) | 32/8552 | 37/18723 | 2.96e-07 | 4.23e-06 | 32 |
| GO:000182412 | Esophagus | ESCC | blastocyst development | 73/8552 | 106/18723 | 1.13e-06 | 1.40e-05 | 73 |
| GO:00018253 | Esophagus | ESCC | blastocyst formation | 29/8552 | 38/18723 | 1.18e-04 | 8.13e-04 | 29 |
| GO:190257011 | Esophagus | ESCC | protein localization to nucleolus | 13/8552 | 16/18723 | 4.05e-03 | 1.62e-02 | 13 |
| GO:00018294 | Esophagus | ESCC | trophectodermal cell differentiation | 13/8552 | 17/18723 | 1.00e-02 | 3.42e-02 | 13 |
| GO:002261322 | Liver | HCC | ribonucleoprotein complex biogenesis | 355/7958 | 463/18723 | 7.76e-52 | 4.92e-48 | 355 |
| GO:004225422 | Liver | HCC | ribosome biogenesis | 246/7958 | 299/18723 | 4.99e-46 | 1.58e-42 | 246 |
| GO:00344702 | Liver | HCC | ncRNA processing | 293/7958 | 395/18723 | 4.26e-38 | 6.76e-35 | 293 |
| GO:001607212 | Liver | HCC | rRNA metabolic process | 193/7958 | 236/18723 | 1.26e-35 | 1.14e-32 | 193 |
| Page: 1 2 3 4 5 |
| Pathway ID | Tissue | Disease Stage | Description | Gene Ratio | Bg Ratio | pvalue | p.adjust | qvalue | Count |
| Page: 1 |
Top |
Cell-cell communication analysis |
| Identification of potential cell-cell interactions between two cell types and their ligand-receptor pairs for different disease states |
| Ligand | Receptor | LRpair | Pathway | Tissue | Disease Stage |
| Page: 1 |
Top |
Single-cell gene regulatory network inference analysis |
| Find out the significant the regulons (TFs) and the target genes of each regulon across cell types for different disease states |
| TF | Cell Type | Tissue | Disease Stage | Target Gene | RSS | Regulon Activity |
| ∗The dot plots of a searched regulon are shown for all cell subpopulations in each disease state of each tissue based on the regulon specific score inferred using pySCENIC and by calculating the average expression. |
| Page: 1 |
Top |
Somatic mutation of malignant transformation related genes |
| Annotation of somatic variants for genes involved in malignant transformation |
| Hugo Symbol | Variant Class | Variant Classification | dbSNP RS | HGVSc | HGVSp | HGVSp Short | SWISSPROT | BIOTYPE | SIFT | PolyPhen | Tumor Sample Barcode | Tissue | Histology | Sex | Age | Stage | Therapy Types | Drugs | Outcome |
| BYSL | SNV | Missense_Mutation | c.61G>A | p.Asp21Asn | p.D21N | Q13895 | protein_coding | tolerated(0.2) | benign(0.033) | TCGA-IR-A3LK-01 | Cervix | cervical & endocervical cancer | Female | >=65 | I/II | Chemotherapy | cisplatin | PD | |
| BYSL | SNV | Missense_Mutation | rs539386229 | c.593N>C | p.Gly198Ala | p.G198A | Q13895 | protein_coding | deleterious(0) | probably_damaging(1) | TCGA-VS-A958-01 | Cervix | cervical & endocervical cancer | Female | <65 | I/II | Chemotherapy | cisplatin | CR |
| BYSL | SNV | Missense_Mutation | c.686N>T | p.Ala229Val | p.A229V | Q13895 | protein_coding | deleterious(0) | probably_damaging(0.998) | TCGA-F4-6856-01 | Colorectum | colon adenocarcinoma | Male | <65 | I/II | Ancillary | leucovorin | CR | |
| BYSL | SNV | Missense_Mutation | rs765781821 | c.434N>A | p.Arg145His | p.R145H | Q13895 | protein_coding | deleterious(0) | benign(0.228) | TCGA-EI-6917-01 | Colorectum | rectum adenocarcinoma | Male | <65 | III/IV | Chemotherapy | 5fluorouracil+oxaciplatina+l-folinian | SD |
| BYSL | SNV | Missense_Mutation | rs753749685 | c.743G>A | p.Arg248His | p.R248H | Q13895 | protein_coding | deleterious(0.02) | probably_damaging(0.949) | TCGA-F5-6814-01 | Colorectum | rectum adenocarcinoma | Male | <65 | I/II | Unknown | Unknown | SD |
| BYSL | SNV | Missense_Mutation | novel | c.953N>A | p.Pro318His | p.P318H | Q13895 | protein_coding | deleterious(0) | probably_damaging(0.999) | TCGA-AJ-A3BH-01 | Endometrium | uterine corpus endometrioid carcinoma | Female | Unknown | I/II | Unknown | Unknown | SD |
| BYSL | SNV | Missense_Mutation | novel | c.1213C>T | p.Leu405Phe | p.L405F | Q13895 | protein_coding | deleterious(0.03) | probably_damaging(0.992) | TCGA-AJ-A3EK-01 | Endometrium | uterine corpus endometrioid carcinoma | Female | <65 | I/II | Chemotherapy | carboplatin | CR |
| BYSL | SNV | Missense_Mutation | c.670N>A | p.Ala224Thr | p.A224T | Q13895 | protein_coding | tolerated(0.83) | benign(0.006) | TCGA-AP-A051-01 | Endometrium | uterine corpus endometrioid carcinoma | Female | >=65 | I/II | Unknown | Unknown | SD | |
| BYSL | SNV | Missense_Mutation | c.1033C>A | p.Leu345Met | p.L345M | Q13895 | protein_coding | deleterious(0.02) | probably_damaging(0.929) | TCGA-AP-A059-01 | Endometrium | uterine corpus endometrioid carcinoma | Female | >=65 | I/II | Unknown | Unknown | SD | |
| BYSL | SNV | Missense_Mutation | rs747035538 | c.886N>A | p.Glu296Lys | p.E296K | Q13895 | protein_coding | deleterious(0) | possibly_damaging(0.846) | TCGA-AP-A0LM-01 | Endometrium | uterine corpus endometrioid carcinoma | Female | <65 | III/IV | Chemotherapy | cisplatin | SD |
| Page: 1 2 3 |
Top |
Related drugs of malignant transformation related genes |
| Identification of chemicals and drugs interact with genes involved in malignant transfromation |
| (DGIdb 4.0) |
| Entrez ID | Symbol | Category | Interaction Types | Drug Claim Name | Drug Name | PMIDs |
| Page: 1 |

Copyright 2023-Present -The University of Texas Health Science Center at Houston |