
|
|||||
|
 | |
| |
| |
| |
| |
| |
|
Gene: BUD31 |
Gene summary for BUD31 |
| Gene information | Species | Human | Gene symbol | BUD31 | Gene ID | 8896 |
| Gene name | BUD31 homolog | |
| Gene Alias | Cwc14 | |
| Cytomap | 7q22.1 | |
| Gene Type | protein-coding | GO ID | GO:0000375 | UniProtAcc | P41223 |
Top |
Malignant transformation analysis |
| Identification of the aberrant gene expression in precancerous and cancerous lesions by comparing the gene expression of stem-like cells in diseased tissues with normal stem cells |
| Entrez ID | Symbol | Replicates | Species | Organ | Tissue | Adj P-value | Log2FC | Malignancy |
| 8896 | BUD31 | AEH-subject1 | Human | Endometrium | AEH | 3.77e-08 | -2.88e-01 | -0.3059 |
| 8896 | BUD31 | AEH-subject2 | Human | Endometrium | AEH | 1.10e-14 | -2.93e-01 | -0.2525 |
| 8896 | BUD31 | AEH-subject3 | Human | Endometrium | AEH | 3.11e-07 | -2.34e-01 | -0.2576 |
| 8896 | BUD31 | AEH-subject4 | Human | Endometrium | AEH | 2.47e-08 | -1.82e-01 | -0.2657 |
| 8896 | BUD31 | AEH-subject5 | Human | Endometrium | AEH | 1.29e-03 | -2.37e-01 | -0.2953 |
| 8896 | BUD31 | EEC-subject1 | Human | Endometrium | EEC | 1.81e-11 | -3.21e-01 | -0.2682 |
| 8896 | BUD31 | EEC-subject2 | Human | Endometrium | EEC | 9.48e-16 | -3.55e-01 | -0.2607 |
| 8896 | BUD31 | EEC-subject3 | Human | Endometrium | EEC | 1.62e-39 | -3.44e-01 | -0.2525 |
| 8896 | BUD31 | GSM5276934 | Human | Endometrium | EEC | 4.50e-02 | 5.01e-02 | -0.0913 |
| 8896 | BUD31 | GSM5276937 | Human | Endometrium | EEC | 9.01e-03 | 1.17e-01 | -0.0897 |
| 8896 | BUD31 | GSM6177620_NYU_UCEC1_lib1_lib1 | Human | Endometrium | EEC | 5.36e-30 | -2.66e-01 | -0.1869 |
| 8896 | BUD31 | GSM6177620_NYU_UCEC1_lib2_lib2 | Human | Endometrium | EEC | 4.09e-35 | -2.58e-01 | -0.1875 |
| 8896 | BUD31 | GSM6177620_NYU_UCEC1_lib3_lib3 | Human | Endometrium | EEC | 6.55e-36 | -3.15e-01 | -0.1883 |
| 8896 | BUD31 | GSM6177621_NYU_UCEC2_lib1_lib1 | Human | Endometrium | EEC | 9.81e-23 | -2.32e-01 | -0.1934 |
| 8896 | BUD31 | GSM6177622_NYU_UCEC3_lib1_lib1 | Human | Endometrium | EEC | 5.73e-41 | -2.14e-01 | -0.1917 |
| 8896 | BUD31 | GSM6177622_NYU_UCEC3_lib2_lib2 | Human | Endometrium | EEC | 5.84e-49 | -1.27e-01 | -0.1916 |
| 8896 | BUD31 | GSM6177623_NYU_UCEC3_Vis | Human | Endometrium | EEC | 4.52e-07 | -1.76e-01 | -0.1269 |
| 8896 | BUD31 | LZE4T | Human | Esophagus | ESCC | 1.34e-16 | 4.67e-01 | 0.0811 |
| 8896 | BUD31 | LZE7T | Human | Esophagus | ESCC | 2.48e-06 | 9.80e-01 | 0.0667 |
| 8896 | BUD31 | LZE8T | Human | Esophagus | ESCC | 1.91e-04 | 4.65e-01 | 0.067 |
| Page: 1 2 3 4 5 6 7 8 9 |
| Tissue | Expression Dynamics | Abbreviation |
| Endometrium |  | AEH: Atypical endometrial hyperplasia |
| EEC: Endometrioid Cancer | ||
| Esophagus | 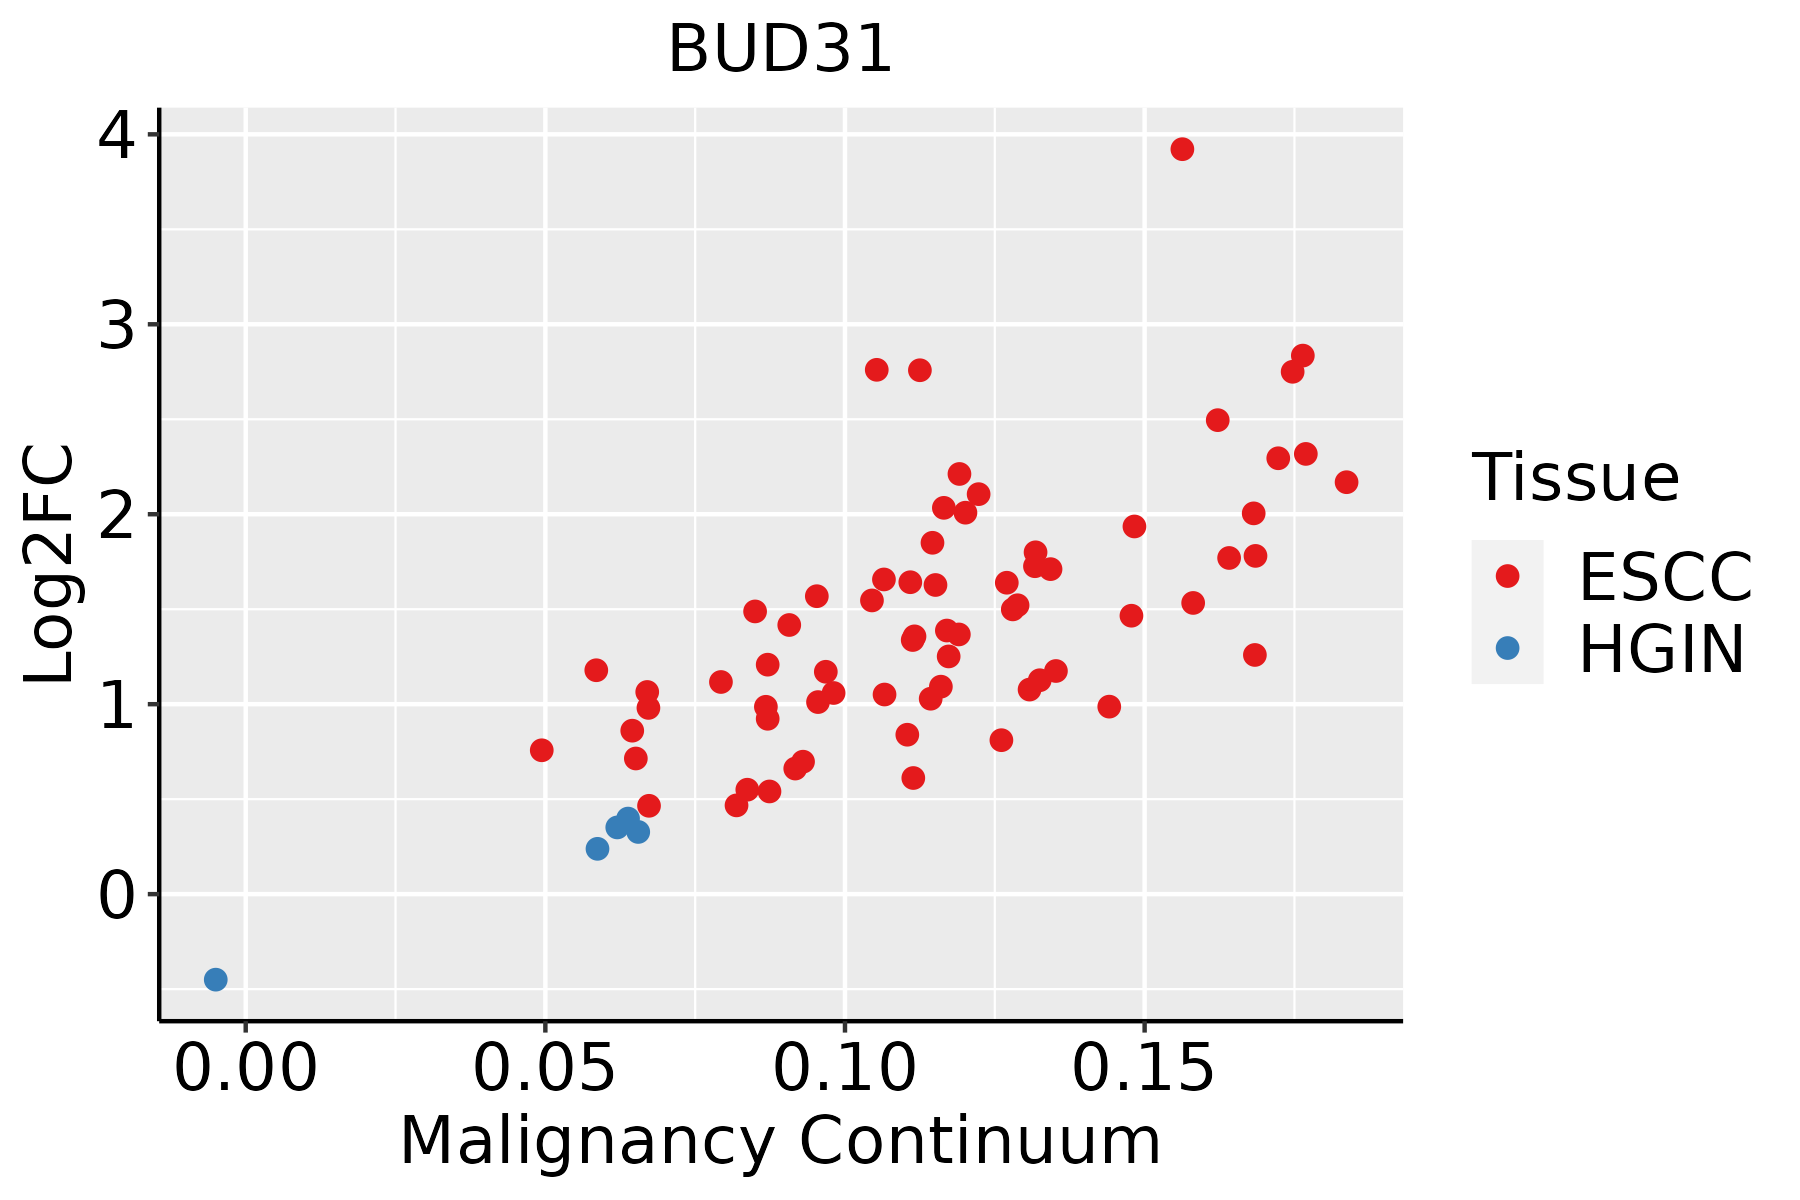 | ESCC: Esophageal squamous cell carcinoma |
| HGIN: High-grade intraepithelial neoplasias | ||
| LGIN: Low-grade intraepithelial neoplasias | ||
| Liver | 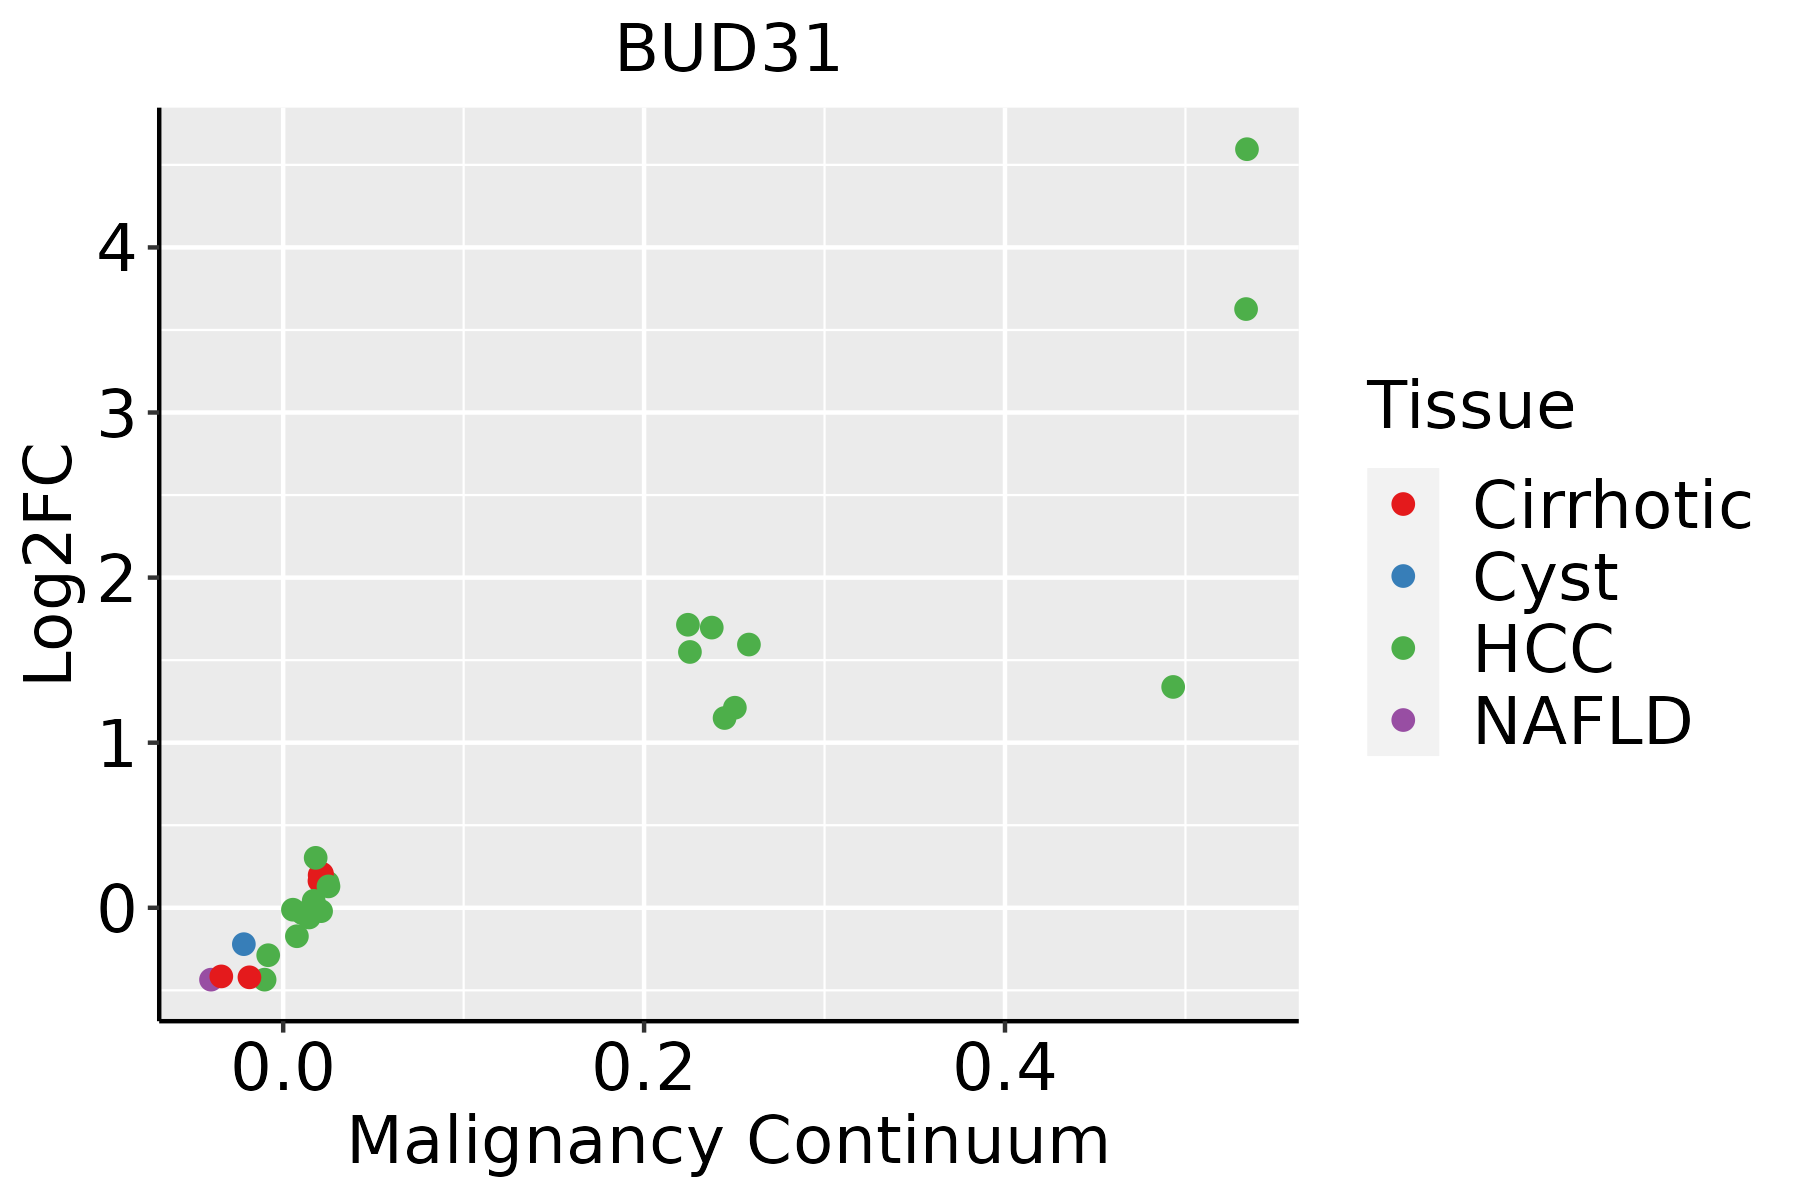 | HCC: Hepatocellular carcinoma |
| NAFLD: Non-alcoholic fatty liver disease | ||
| Oral Cavity | 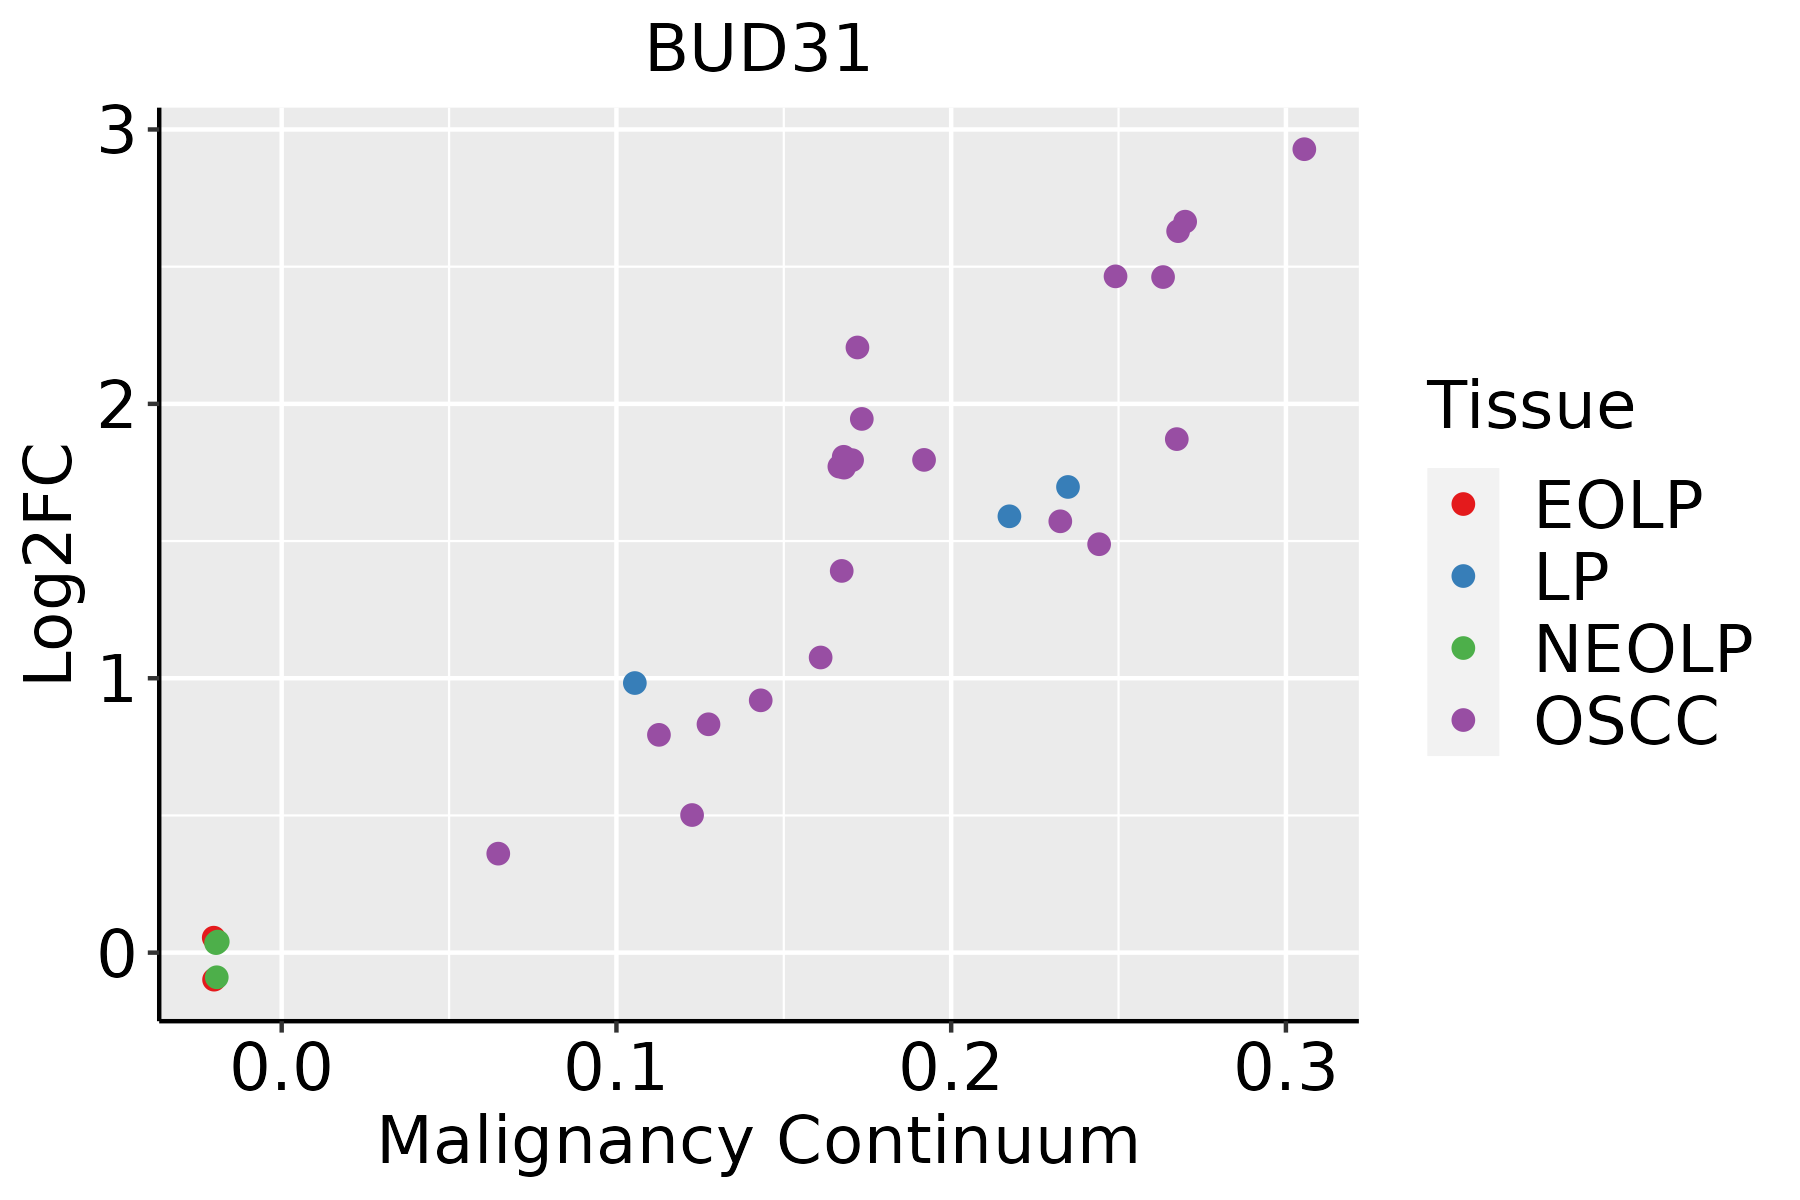 | EOLP: Erosive Oral lichen planus |
| LP: leukoplakia | ||
| NEOLP: Non-erosive oral lichen planus | ||
| OSCC: Oral squamous cell carcinoma | ||
| Prostate |  | BPH: Benign Prostatic Hyperplasia |
| Skin |  | AK: Actinic keratosis |
| cSCC: Cutaneous squamous cell carcinoma | ||
| SCCIS:squamous cell carcinoma in situ | ||
| Thyroid | 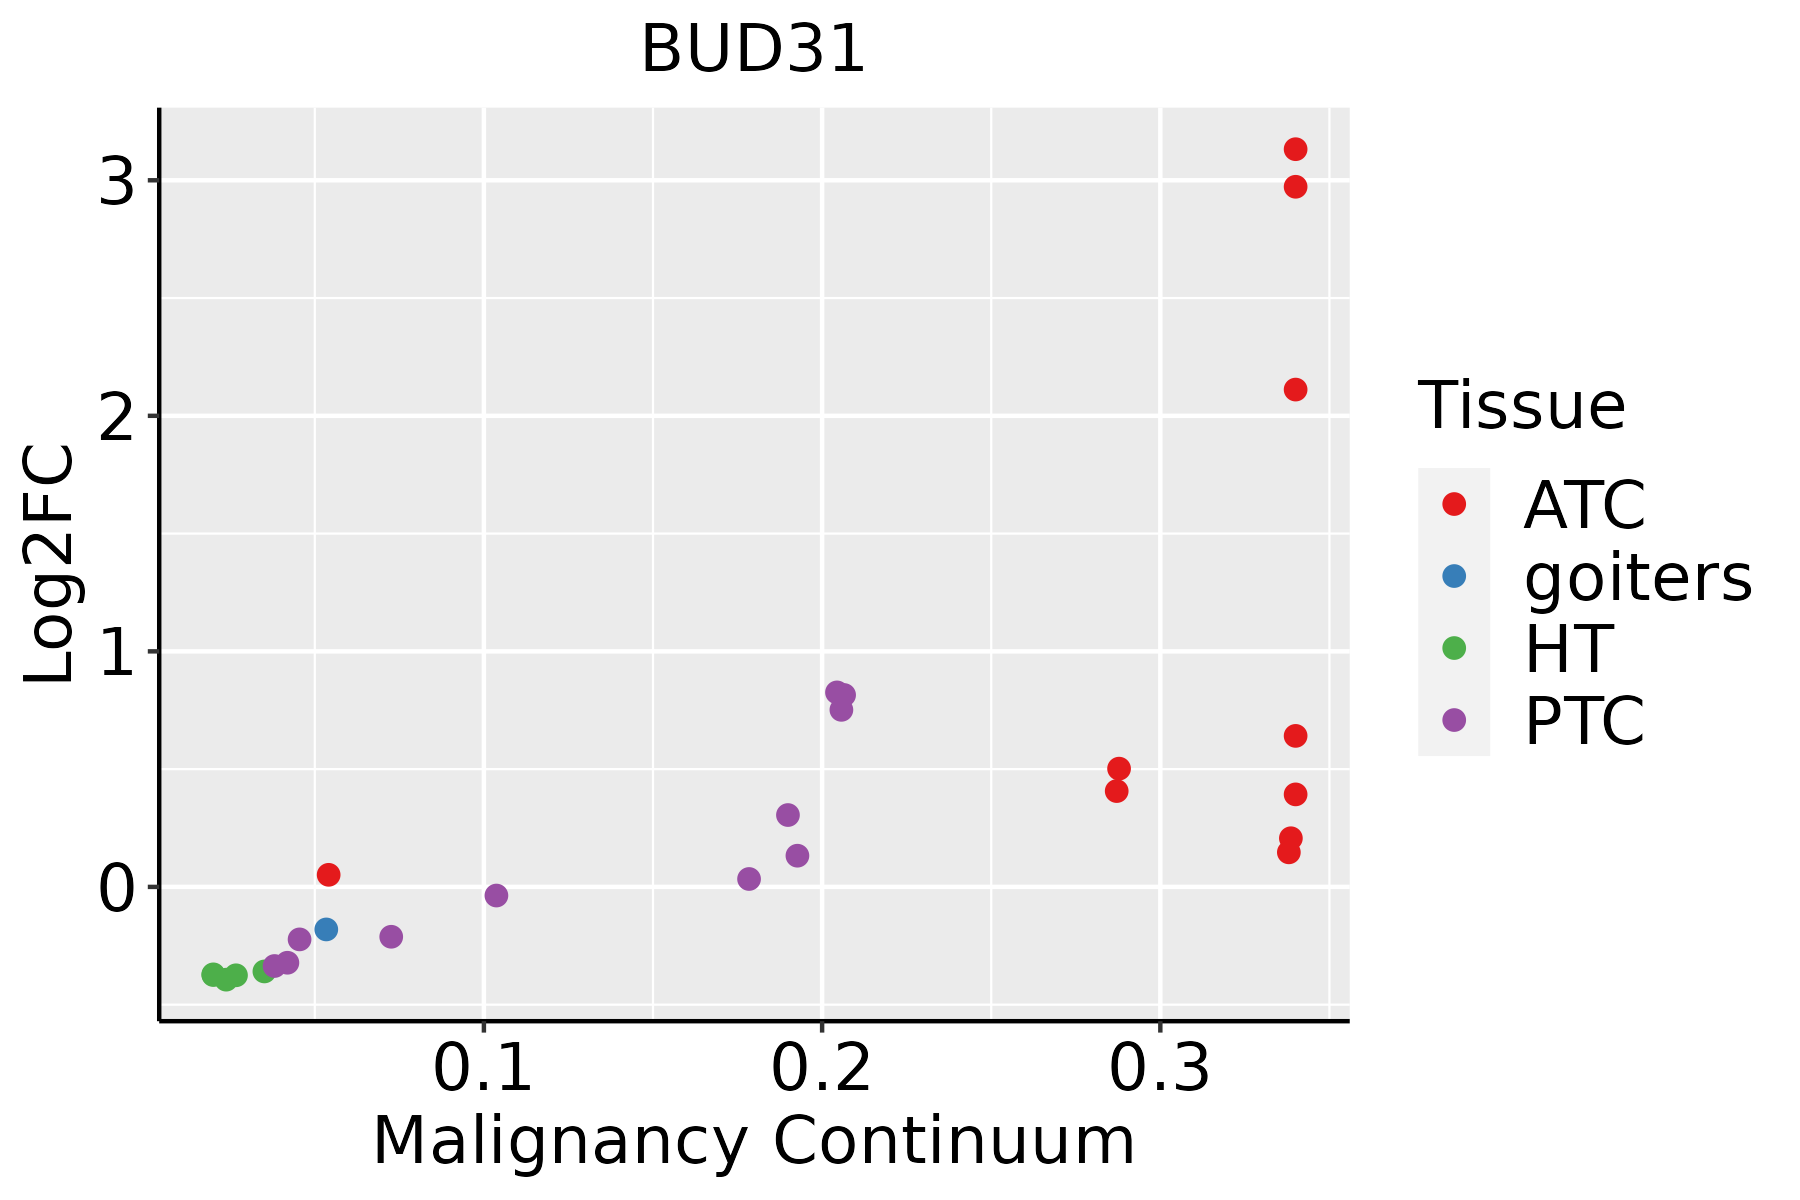 | ATC: Anaplastic thyroid cancer |
| HT: Hashimoto's thyroiditis | ||
| PTC: Papillary thyroid cancer |
| ∗log2FC in expression of this searched gene in stem-like cells from each diseased tissue sample relative to stem-like cells in normal samples in each tissue plotted against the malignancy continuum. Samples are colored based on if they are from different disease stage. |
Top |
Malignant transformation related pathway analysis |
| Find out the enriched GO biological processes and KEGG pathways involved in transition from healthy to precancer to cancer |
| Tissue | Disease Stage | Enriched GO biological Processes |
| Colorectum | AD |  |
| Colorectum | SER |  |
| Colorectum | MSS |  |
| Colorectum | MSI-H |  |
| Colorectum | FAP |  |
| ∗Top 15 enriched GO BP terms are showed in the bar plot of each disease state in each tissue. Each row represents a significant GO biological process which is colored according to the -log10(p.adjust). |
| Page: 1 2 3 4 5 6 7 8 9 |
| GO ID | Tissue | Disease Stage | Description | Gene Ratio | Bg Ratio | pvalue | p.adjust | Count |
| GO:000838016 | Endometrium | AEH | RNA splicing | 111/2100 | 434/18723 | 2.42e-17 | 1.12e-14 | 111 |
| GO:000037515 | Endometrium | AEH | RNA splicing, via transesterification reactions | 88/2100 | 324/18723 | 1.11e-15 | 3.91e-13 | 88 |
| GO:000037715 | Endometrium | AEH | RNA splicing, via transesterification reactions with bulged adenosine as nucleophile | 87/2100 | 320/18723 | 1.51e-15 | 4.78e-13 | 87 |
| GO:000039815 | Endometrium | AEH | mRNA splicing, via spliceosome | 87/2100 | 320/18723 | 1.51e-15 | 4.78e-13 | 87 |
| GO:00510905 | Endometrium | AEH | regulation of DNA-binding transcription factor activity | 69/2100 | 440/18723 | 2.51e-03 | 1.87e-02 | 69 |
| GO:000838017 | Endometrium | EEC | RNA splicing | 111/2168 | 434/18723 | 2.45e-16 | 1.13e-13 | 111 |
| GO:000037516 | Endometrium | EEC | RNA splicing, via transesterification reactions | 88/2168 | 324/18723 | 7.46e-15 | 2.63e-12 | 88 |
| GO:000037716 | Endometrium | EEC | RNA splicing, via transesterification reactions with bulged adenosine as nucleophile | 87/2168 | 320/18723 | 9.97e-15 | 3.15e-12 | 87 |
| GO:000039816 | Endometrium | EEC | mRNA splicing, via spliceosome | 87/2168 | 320/18723 | 9.97e-15 | 3.15e-12 | 87 |
| GO:005109013 | Endometrium | EEC | regulation of DNA-binding transcription factor activity | 75/2168 | 440/18723 | 3.71e-04 | 3.97e-03 | 75 |
| GO:0008380111 | Esophagus | ESCC | RNA splicing | 336/8552 | 434/18723 | 1.74e-42 | 3.67e-39 | 336 |
| GO:0000375111 | Esophagus | ESCC | RNA splicing, via transesterification reactions | 248/8552 | 324/18723 | 3.05e-30 | 1.49e-27 | 248 |
| GO:0000377111 | Esophagus | ESCC | RNA splicing, via transesterification reactions with bulged adenosine as nucleophile | 244/8552 | 320/18723 | 2.52e-29 | 1.07e-26 | 244 |
| GO:0000398111 | Esophagus | ESCC | mRNA splicing, via spliceosome | 244/8552 | 320/18723 | 2.52e-29 | 1.07e-26 | 244 |
| GO:00510908 | Esophagus | ESCC | regulation of DNA-binding transcription factor activity | 252/8552 | 440/18723 | 5.22e-07 | 6.97e-06 | 252 |
| GO:00510918 | Esophagus | ESCC | positive regulation of DNA-binding transcription factor activity | 155/8552 | 260/18723 | 3.83e-06 | 4.14e-05 | 155 |
| GO:000838012 | Liver | Cirrhotic | RNA splicing | 229/4634 | 434/18723 | 9.13e-37 | 2.86e-33 | 229 |
| GO:000037512 | Liver | Cirrhotic | RNA splicing, via transesterification reactions | 175/4634 | 324/18723 | 5.95e-30 | 7.47e-27 | 175 |
| GO:000037712 | Liver | Cirrhotic | RNA splicing, via transesterification reactions with bulged adenosine as nucleophile | 172/4634 | 320/18723 | 4.02e-29 | 3.60e-26 | 172 |
| GO:000039812 | Liver | Cirrhotic | mRNA splicing, via spliceosome | 172/4634 | 320/18723 | 4.02e-29 | 3.60e-26 | 172 |
| Page: 1 2 3 4 |
| Pathway ID | Tissue | Disease Stage | Description | Gene Ratio | Bg Ratio | pvalue | p.adjust | qvalue | Count |
| hsa0304027 | Esophagus | ESCC | Spliceosome | 128/4205 | 217/8465 | 3.31e-03 | 8.79e-03 | 4.50e-03 | 128 |
| hsa0304037 | Esophagus | ESCC | Spliceosome | 128/4205 | 217/8465 | 3.31e-03 | 8.79e-03 | 4.50e-03 | 128 |
| hsa030407 | Liver | Cirrhotic | Spliceosome | 102/2530 | 217/8465 | 5.69e-08 | 9.47e-07 | 5.84e-07 | 102 |
| hsa0304012 | Liver | Cirrhotic | Spliceosome | 102/2530 | 217/8465 | 5.69e-08 | 9.47e-07 | 5.84e-07 | 102 |
| hsa0304022 | Liver | HCC | Spliceosome | 122/4020 | 217/8465 | 5.55e-03 | 1.60e-02 | 8.91e-03 | 122 |
| hsa0304032 | Liver | HCC | Spliceosome | 122/4020 | 217/8465 | 5.55e-03 | 1.60e-02 | 8.91e-03 | 122 |
| hsa0304016 | Oral cavity | OSCC | Spliceosome | 123/3704 | 217/8465 | 7.21e-05 | 2.74e-04 | 1.40e-04 | 123 |
| hsa0304017 | Oral cavity | OSCC | Spliceosome | 123/3704 | 217/8465 | 7.21e-05 | 2.74e-04 | 1.40e-04 | 123 |
| Page: 1 |
Top |
Cell-cell communication analysis |
| Identification of potential cell-cell interactions between two cell types and their ligand-receptor pairs for different disease states |
| Ligand | Receptor | LRpair | Pathway | Tissue | Disease Stage |
| Page: 1 |
Top |
Single-cell gene regulatory network inference analysis |
| Find out the significant the regulons (TFs) and the target genes of each regulon across cell types for different disease states |
| TF | Cell Type | Tissue | Disease Stage | Target Gene | RSS | Regulon Activity |
| ∗The dot plots of a searched regulon are shown for all cell subpopulations in each disease state of each tissue based on the regulon specific score inferred using pySCENIC and by calculating the average expression. |
| Page: 1 |
Top |
Somatic mutation of malignant transformation related genes |
| Annotation of somatic variants for genes involved in malignant transformation |
| Hugo Symbol | Variant Class | Variant Classification | dbSNP RS | HGVSc | HGVSp | HGVSp Short | SWISSPROT | BIOTYPE | SIFT | PolyPhen | Tumor Sample Barcode | Tissue | Histology | Sex | Age | Stage | Therapy Types | Drugs | Outcome |
| BUD31 | SNV | Missense_Mutation | c.215N>C | p.Arg72Thr | p.R72T | P41223 | protein_coding | deleterious(0.03) | possibly_damaging(0.9) | TCGA-AC-A23H-01 | Breast | breast invasive carcinoma | Female | >=65 | I/II | Unknown | Unknown | PD | |
| BUD31 | SNV | Missense_Mutation | novel | c.97G>C | p.Glu33Gln | p.E33Q | P41223 | protein_coding | tolerated(0.3) | possibly_damaging(0.856) | TCGA-VS-A9UC-01 | Cervix | cervical & endocervical cancer | Female | <65 | I/II | Chemotherapy | cisplatin | SD |
| BUD31 | SNV | Missense_Mutation | c.400N>C | p.Cys134Arg | p.C134R | P41223 | protein_coding | deleterious(0) | possibly_damaging(0.904) | TCGA-DM-A1HB-01 | Colorectum | colon adenocarcinoma | Male | >=65 | III/IV | Unknown | Unknown | SD | |
| BUD31 | SNV | Missense_Mutation | rs865774528 | c.359G>A | p.Arg120His | p.R120H | P41223 | protein_coding | deleterious(0) | probably_damaging(0.989) | TCGA-AG-3592-01 | Colorectum | rectum adenocarcinoma | Male | >=65 | I/II | Unknown | Unknown | SD |
| BUD31 | SNV | Missense_Mutation | novel | c.172C>A | p.Arg58Ser | p.R58S | P41223 | protein_coding | deleterious(0) | possibly_damaging(0.878) | TCGA-A5-A0G1-01 | Endometrium | uterine corpus endometrioid carcinoma | Female | >=65 | I/II | Unknown | Unknown | SD |
| BUD31 | SNV | Missense_Mutation | novel | c.172N>A | p.Arg58Ser | p.R58S | P41223 | protein_coding | deleterious(0) | possibly_damaging(0.878) | TCGA-A5-A0GG-01 | Endometrium | uterine corpus endometrioid carcinoma | Female | >=65 | I/II | Unknown | Unknown | SD |
| BUD31 | SNV | Missense_Mutation | novel | c.259A>C | p.Asn87His | p.N87H | P41223 | protein_coding | tolerated(0.09) | possibly_damaging(0.841) | TCGA-A5-A2K5-01 | Endometrium | uterine corpus endometrioid carcinoma | Female | >=65 | I/II | Unknown | Unknown | SD |
| BUD31 | SNV | Missense_Mutation | rs568467012 | c.184N>A | p.Asp62Asn | p.D62N | P41223 | protein_coding | tolerated(0.07) | benign(0.072) | TCGA-AP-A0LM-01 | Endometrium | uterine corpus endometrioid carcinoma | Female | <65 | III/IV | Chemotherapy | cisplatin | SD |
| BUD31 | SNV | Missense_Mutation | novel | c.220N>T | p.Leu74Phe | p.L74F | P41223 | protein_coding | deleterious(0.01) | probably_damaging(1) | TCGA-AX-A1CE-01 | Endometrium | uterine corpus endometrioid carcinoma | Female | <65 | I/II | Unspecific | Paclitaxel | SD |
| BUD31 | SNV | Missense_Mutation | c.208N>C | p.Ile70Leu | p.I70L | P41223 | protein_coding | deleterious(0) | benign(0.215) | TCGA-D1-A103-01 | Endometrium | uterine corpus endometrioid carcinoma | Female | >=65 | I/II | Unknown | Unknown | SD |
| Page: 1 2 3 |
Top |
Related drugs of malignant transformation related genes |
| Identification of chemicals and drugs interact with genes involved in malignant transfromation |
| (DGIdb 4.0) |
| Entrez ID | Symbol | Category | Interaction Types | Drug Claim Name | Drug Name | PMIDs |
| Page: 1 |

Copyright 2023-Present -The University of Texas Health Science Center at Houston |