
|
|||||
|
 | |
| |
| |
| |
| |
| |
|
Gene: BUD23 |
Gene summary for BUD23 |
| Gene information | Species | Human | Gene symbol | BUD23 | Gene ID | 114049 |
| Gene name | BUD23 rRNA methyltransferase and ribosome maturation factor | |
| Gene Alias | HASJ4442 | |
| Cytomap | 7q11.23 | |
| Gene Type | protein-coding | GO ID | GO:0000154 | UniProtAcc | O43709 |
Top |
Malignant transformation analysis |
| Identification of the aberrant gene expression in precancerous and cancerous lesions by comparing the gene expression of stem-like cells in diseased tissues with normal stem cells |
| Entrez ID | Symbol | Replicates | Species | Organ | Tissue | Adj P-value | Log2FC | Malignancy |
| 114049 | BUD23 | AEH-subject1 | Human | Endometrium | AEH | 2.01e-31 | 5.82e-01 | -0.3059 |
| 114049 | BUD23 | AEH-subject2 | Human | Endometrium | AEH | 6.52e-24 | 5.32e-01 | -0.2525 |
| 114049 | BUD23 | AEH-subject3 | Human | Endometrium | AEH | 6.74e-36 | 6.22e-01 | -0.2576 |
| 114049 | BUD23 | AEH-subject4 | Human | Endometrium | AEH | 3.26e-19 | 4.54e-01 | -0.2657 |
| 114049 | BUD23 | AEH-subject5 | Human | Endometrium | AEH | 2.58e-15 | 2.93e-01 | -0.2953 |
| 114049 | BUD23 | EEC-subject1 | Human | Endometrium | EEC | 9.89e-17 | 3.92e-01 | -0.2682 |
| 114049 | BUD23 | EEC-subject2 | Human | Endometrium | EEC | 5.65e-20 | 4.18e-01 | -0.2607 |
| 114049 | BUD23 | EEC-subject3 | Human | Endometrium | EEC | 1.85e-09 | 2.47e-01 | -0.2525 |
| 114049 | BUD23 | EEC-subject4 | Human | Endometrium | EEC | 1.60e-18 | 3.67e-01 | -0.2571 |
| 114049 | BUD23 | EEC-subject5 | Human | Endometrium | EEC | 1.73e-27 | 4.83e-01 | -0.249 |
| 114049 | BUD23 | GSM5276934 | Human | Endometrium | EEC | 1.93e-29 | 4.87e-01 | -0.0913 |
| 114049 | BUD23 | GSM5276935 | Human | Endometrium | EEC | 4.35e-48 | 5.54e-01 | -0.123 |
| 114049 | BUD23 | GSM5276937 | Human | Endometrium | EEC | 2.24e-40 | 6.32e-01 | -0.0897 |
| 114049 | BUD23 | GSM6177620_NYU_UCEC1_lib1_lib1 | Human | Endometrium | EEC | 3.94e-10 | 3.86e-01 | -0.1869 |
| 114049 | BUD23 | GSM6177620_NYU_UCEC1_lib2_lib2 | Human | Endometrium | EEC | 6.74e-09 | 4.13e-01 | -0.1875 |
| 114049 | BUD23 | GSM6177620_NYU_UCEC1_lib3_lib3 | Human | Endometrium | EEC | 8.61e-06 | 3.05e-01 | -0.1883 |
| 114049 | BUD23 | GSM6177621_NYU_UCEC2_lib1_lib1 | Human | Endometrium | EEC | 3.21e-13 | 4.43e-01 | -0.1934 |
| 114049 | BUD23 | GSM6177622_NYU_UCEC3_lib1_lib1 | Human | Endometrium | EEC | 8.77e-08 | 3.37e-01 | -0.1917 |
| 114049 | BUD23 | GSM6177622_NYU_UCEC3_lib2_lib2 | Human | Endometrium | EEC | 5.51e-05 | 2.55e-01 | -0.1916 |
| 114049 | BUD23 | GSM6177623_NYU_UCEC3_Vis | Human | Endometrium | EEC | 2.01e-31 | 5.09e-01 | -0.1269 |
| Page: 1 2 3 4 5 |
| Tissue | Expression Dynamics | Abbreviation |
| Endometrium | 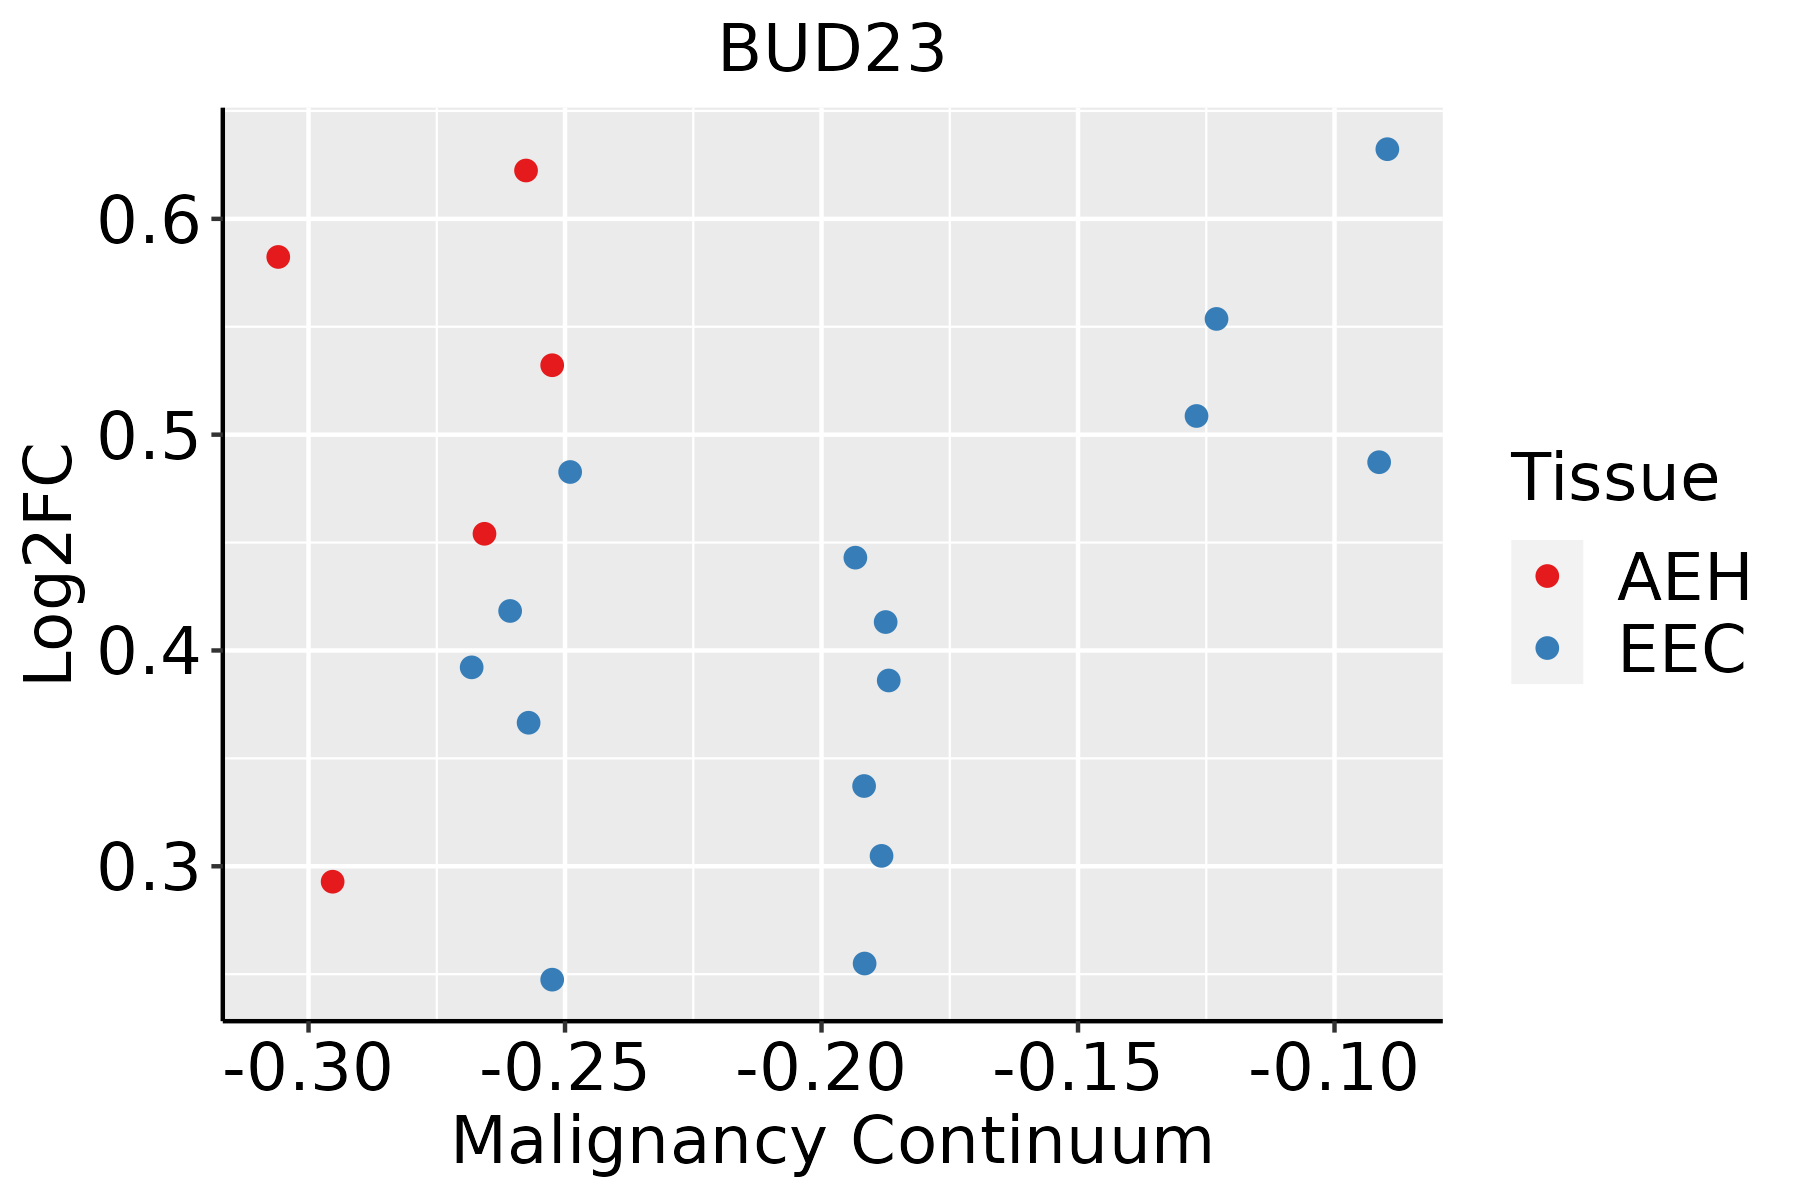 | AEH: Atypical endometrial hyperplasia |
| EEC: Endometrioid Cancer | ||
| Esophagus | 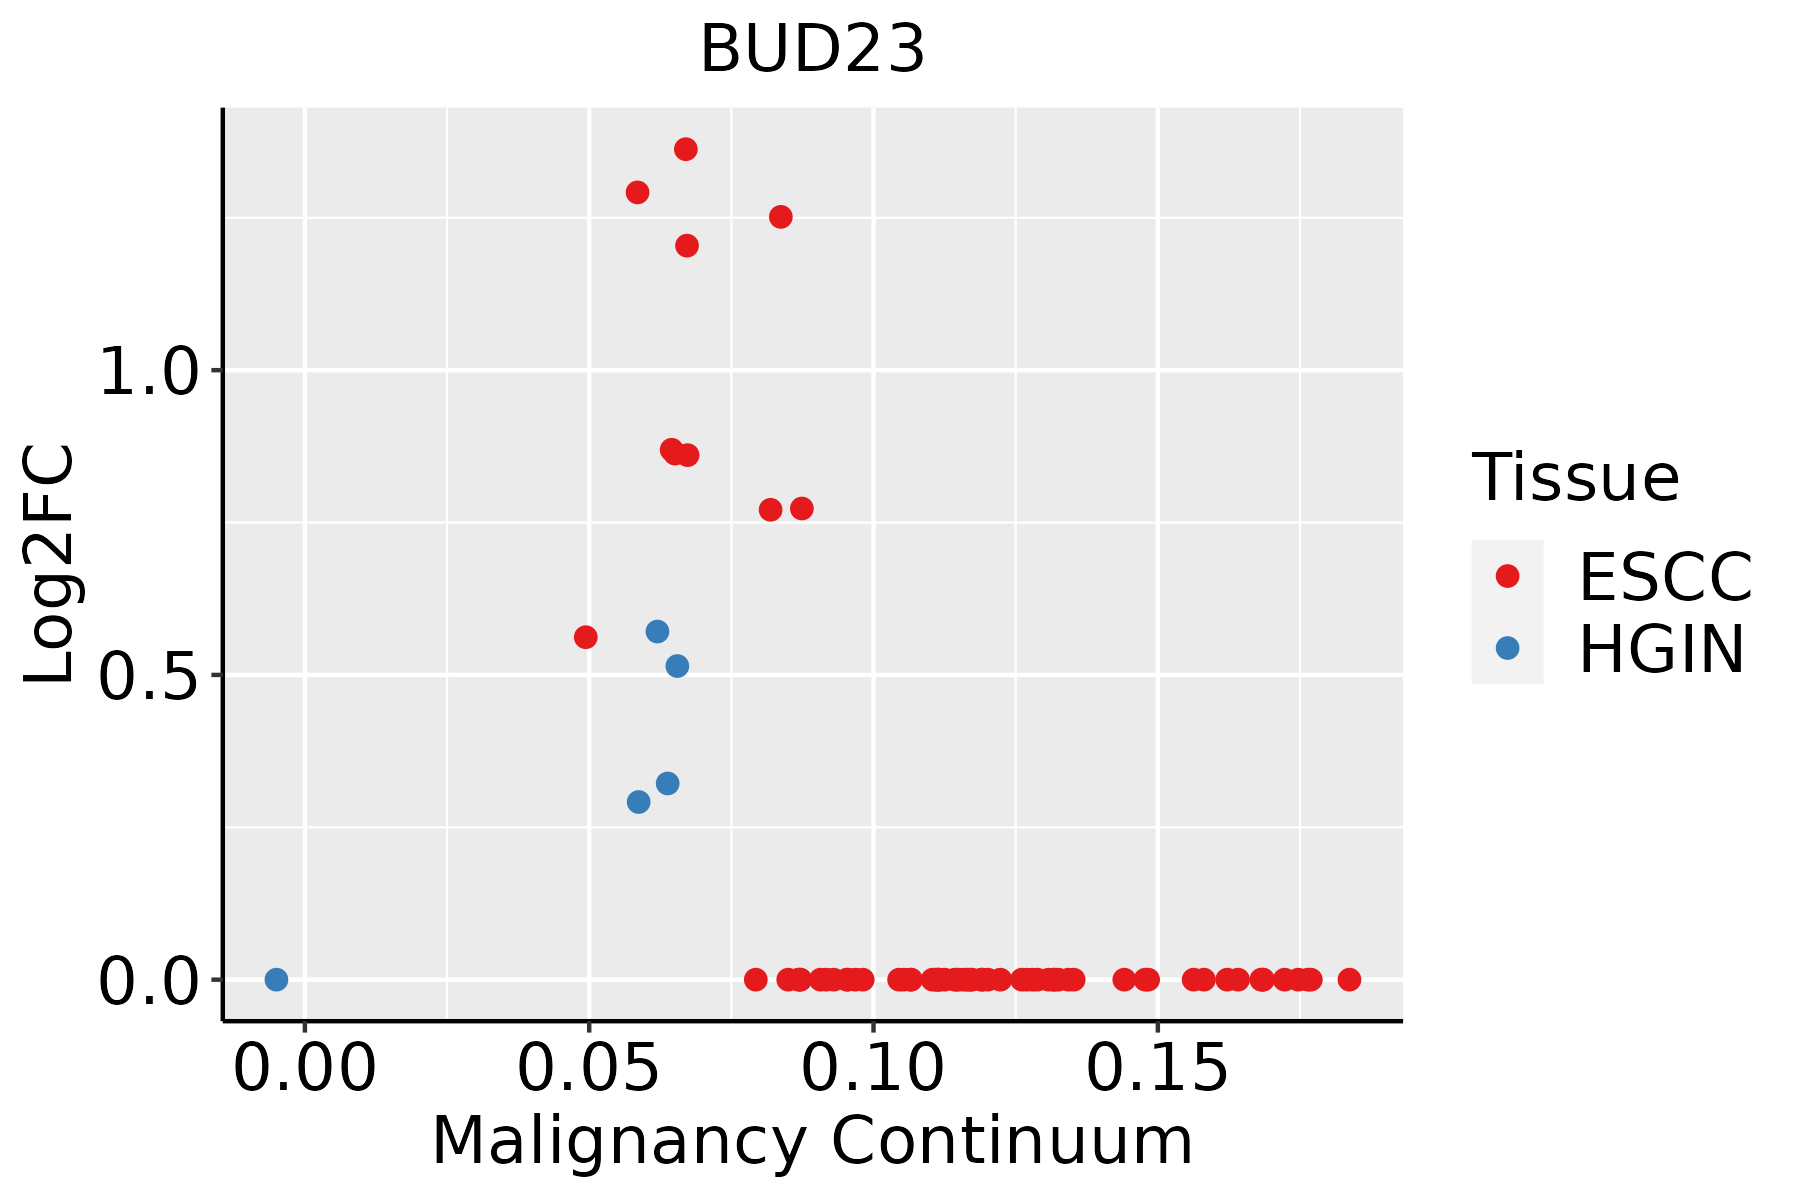 | ESCC: Esophageal squamous cell carcinoma |
| HGIN: High-grade intraepithelial neoplasias | ||
| LGIN: Low-grade intraepithelial neoplasias | ||
| GC | 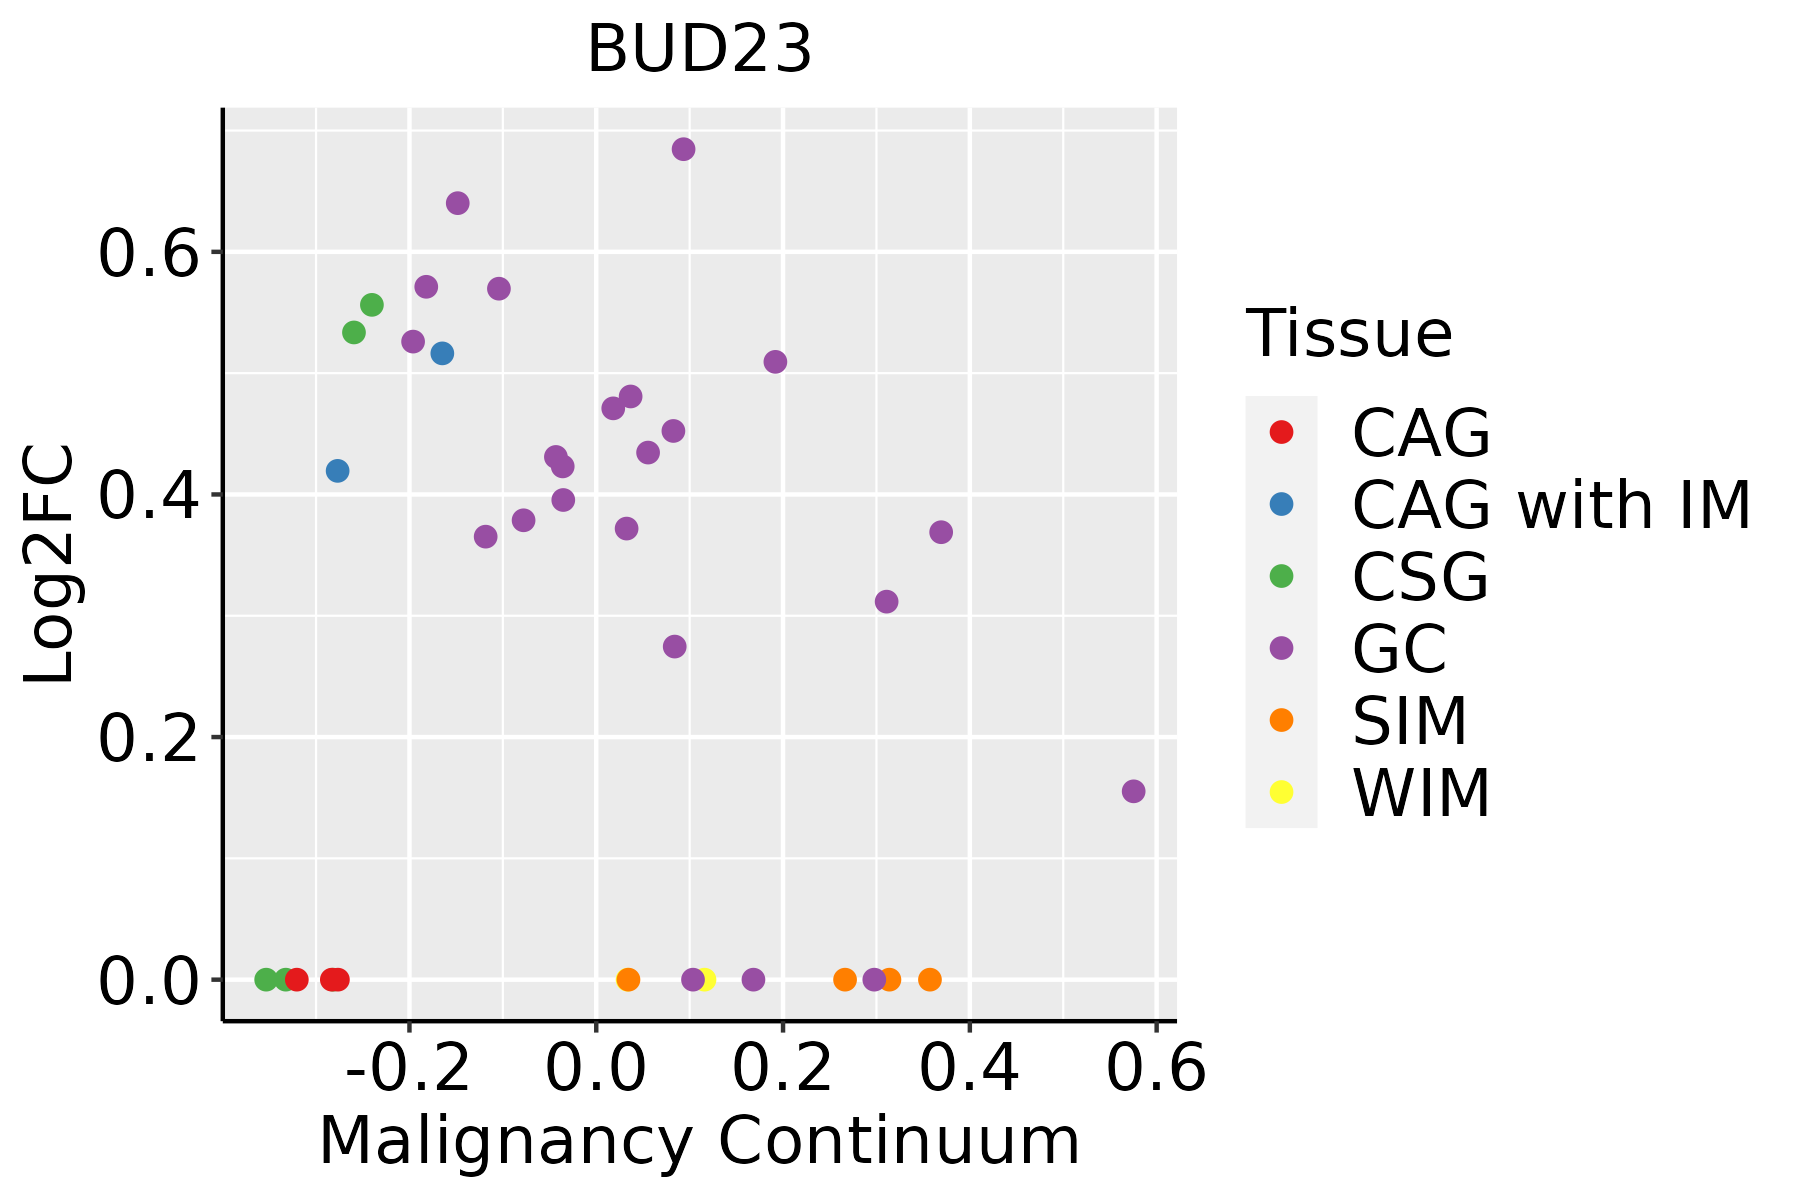 | CAG: Chronic atrophic gastritis |
| CAG with IM: Chronic atrophic gastritis with intestinal metaplasia | ||
| CSG: Chronic superficial gastritis | ||
| GC: Gastric cancer | ||
| SIM: Severe intestinal metaplasia | ||
| WIM: Wild intestinal metaplasia | ||
| Liver |  | HCC: Hepatocellular carcinoma |
| NAFLD: Non-alcoholic fatty liver disease | ||
| Lung |  | AAH: Atypical adenomatous hyperplasia |
| AIS: Adenocarcinoma in situ | ||
| IAC: Invasive lung adenocarcinoma | ||
| MIA: Minimally invasive adenocarcinoma | ||
| Thyroid |  | ATC: Anaplastic thyroid cancer |
| HT: Hashimoto's thyroiditis | ||
| PTC: Papillary thyroid cancer |
| ∗log2FC in expression of this searched gene in stem-like cells from each diseased tissue sample relative to stem-like cells in normal samples in each tissue plotted against the malignancy continuum. Samples are colored based on if they are from different disease stage. |
Top |
Malignant transformation related pathway analysis |
| Find out the enriched GO biological processes and KEGG pathways involved in transition from healthy to precancer to cancer |
| Tissue | Disease Stage | Enriched GO biological Processes |
| Colorectum | AD |  |
| Colorectum | SER |  |
| Colorectum | MSS |  |
| Colorectum | MSI-H |  |
| Colorectum | FAP |  |
| ∗Top 15 enriched GO BP terms are showed in the bar plot of each disease state in each tissue. Each row represents a significant GO biological process which is colored according to the -log10(p.adjust). |
| Page: 1 2 3 4 5 6 7 8 9 |
| GO ID | Tissue | Disease Stage | Description | Gene Ratio | Bg Ratio | pvalue | p.adjust | Count |
| GO:002261316 | Endometrium | AEH | ribonucleoprotein complex biogenesis | 107/2100 | 463/18723 | 1.43e-13 | 4.08e-11 | 107 |
| GO:004225416 | Endometrium | AEH | ribosome biogenesis | 67/2100 | 299/18723 | 1.95e-08 | 1.18e-06 | 67 |
| GO:00063648 | Endometrium | AEH | rRNA processing | 47/2100 | 225/18723 | 1.78e-05 | 3.65e-04 | 47 |
| GO:00160728 | Endometrium | AEH | rRNA metabolic process | 48/2100 | 236/18723 | 3.01e-05 | 5.54e-04 | 48 |
| GO:00063258 | Endometrium | AEH | chromatin organization | 64/2100 | 409/18723 | 3.69e-03 | 2.52e-02 | 64 |
| GO:00344707 | Endometrium | AEH | ncRNA processing | 62/2100 | 395/18723 | 3.93e-03 | 2.65e-02 | 62 |
| GO:002261317 | Endometrium | EEC | ribonucleoprotein complex biogenesis | 108/2168 | 463/18723 | 4.60e-13 | 9.86e-11 | 108 |
| GO:004225417 | Endometrium | EEC | ribosome biogenesis | 68/2168 | 299/18723 | 2.90e-08 | 1.68e-06 | 68 |
| GO:000636416 | Endometrium | EEC | rRNA processing | 48/2168 | 225/18723 | 1.88e-05 | 3.50e-04 | 48 |
| GO:001607216 | Endometrium | EEC | rRNA metabolic process | 49/2168 | 236/18723 | 3.27e-05 | 5.62e-04 | 49 |
| GO:000632513 | Endometrium | EEC | chromatin organization | 65/2168 | 409/18723 | 4.98e-03 | 3.14e-02 | 65 |
| GO:003447012 | Endometrium | EEC | ncRNA processing | 63/2168 | 395/18723 | 5.20e-03 | 3.26e-02 | 63 |
| GO:002261327 | Esophagus | HGIN | ribonucleoprotein complex biogenesis | 158/2587 | 463/18723 | 2.61e-29 | 5.23e-26 | 158 |
| GO:004225426 | Esophagus | HGIN | ribosome biogenesis | 101/2587 | 299/18723 | 8.74e-19 | 4.03e-16 | 101 |
| GO:001607219 | Esophagus | HGIN | rRNA metabolic process | 72/2587 | 236/18723 | 2.26e-11 | 2.56e-09 | 72 |
| GO:000636419 | Esophagus | HGIN | rRNA processing | 69/2587 | 225/18723 | 4.53e-11 | 5.04e-09 | 69 |
| GO:003447010 | Esophagus | HGIN | ncRNA processing | 97/2587 | 395/18723 | 5.92e-09 | 3.90e-07 | 97 |
| GO:000632516 | Esophagus | HGIN | chromatin organization | 92/2587 | 409/18723 | 1.05e-06 | 4.16e-05 | 92 |
| GO:00346606 | Esophagus | HGIN | ncRNA metabolic process | 104/2587 | 485/18723 | 2.26e-06 | 8.23e-05 | 104 |
| GO:0022613111 | Esophagus | ESCC | ribonucleoprotein complex biogenesis | 365/8552 | 463/18723 | 1.74e-49 | 1.11e-45 | 365 |
| Page: 1 2 3 4 5 |
| Pathway ID | Tissue | Disease Stage | Description | Gene Ratio | Bg Ratio | pvalue | p.adjust | qvalue | Count |
| Page: 1 |
Top |
Cell-cell communication analysis |
| Identification of potential cell-cell interactions between two cell types and their ligand-receptor pairs for different disease states |
| Ligand | Receptor | LRpair | Pathway | Tissue | Disease Stage |
| Page: 1 |
Top |
Single-cell gene regulatory network inference analysis |
| Find out the significant the regulons (TFs) and the target genes of each regulon across cell types for different disease states |
| TF | Cell Type | Tissue | Disease Stage | Target Gene | RSS | Regulon Activity |
| ∗The dot plots of a searched regulon are shown for all cell subpopulations in each disease state of each tissue based on the regulon specific score inferred using pySCENIC and by calculating the average expression. |
| Page: 1 |
Top |
Somatic mutation of malignant transformation related genes |
| Annotation of somatic variants for genes involved in malignant transformation |
| Hugo Symbol | Variant Class | Variant Classification | dbSNP RS | HGVSc | HGVSp | HGVSp Short | SWISSPROT | BIOTYPE | SIFT | PolyPhen | Tumor Sample Barcode | Tissue | Histology | Sex | Age | Stage | Therapy Types | Drugs | Outcome |
| Page: 1 |
Top |
Related drugs of malignant transformation related genes |
| Identification of chemicals and drugs interact with genes involved in malignant transfromation |
| (DGIdb 4.0) |
| Entrez ID | Symbol | Category | Interaction Types | Drug Claim Name | Drug Name | PMIDs |
| Page: 1 |

Copyright 2023-Present -The University of Texas Health Science Center at Houston |