
|
|||||
|
 | |
| |
| |
| |
| |
| |
|
Gene: BTRC |
Gene summary for BTRC |
| Gene information | Species | Human | Gene symbol | BTRC | Gene ID | 8945 |
| Gene name | beta-transducin repeat containing E3 ubiquitin protein ligase | |
| Gene Alias | BETA-TRCP | |
| Cytomap | 10q24.32 | |
| Gene Type | protein-coding | GO ID | GO:0000209 | UniProtAcc | B2R8L3 |
Top |
Malignant transformation analysis |
| Identification of the aberrant gene expression in precancerous and cancerous lesions by comparing the gene expression of stem-like cells in diseased tissues with normal stem cells |
| Entrez ID | Symbol | Replicates | Species | Organ | Tissue | Adj P-value | Log2FC | Malignancy |
| 8945 | BTRC | CCI_1 | Human | Cervix | CC | 1.48e-04 | 6.83e-01 | 0.528 |
| 8945 | BTRC | CCI_2 | Human | Cervix | CC | 3.58e-09 | 8.71e-01 | 0.5249 |
| 8945 | BTRC | HTA11_3410_2000001011 | Human | Colorectum | AD | 7.10e-05 | -3.95e-01 | 0.0155 |
| 8945 | BTRC | HTA11_696_2000001011 | Human | Colorectum | AD | 3.22e-03 | -2.50e-01 | -0.1464 |
| 8945 | BTRC | HTA11_866_2000001011 | Human | Colorectum | AD | 1.14e-05 | -2.78e-01 | -0.1001 |
| 8945 | BTRC | HTA11_866_3004761011 | Human | Colorectum | AD | 2.53e-02 | -3.22e-01 | 0.096 |
| 8945 | BTRC | HTA11_7696_3000711011 | Human | Colorectum | AD | 1.58e-06 | -2.78e-01 | 0.0674 |
| 8945 | BTRC | HTA11_99999970781_79442 | Human | Colorectum | MSS | 1.49e-03 | -3.00e-01 | 0.294 |
| 8945 | BTRC | HTA11_99999971662_82457 | Human | Colorectum | MSS | 3.70e-02 | -1.81e-01 | 0.3859 |
| 8945 | BTRC | HTA11_99999974143_84620 | Human | Colorectum | MSS | 8.33e-10 | -3.53e-01 | 0.3005 |
| 8945 | BTRC | A015-C-203 | Human | Colorectum | FAP | 2.07e-25 | -4.04e-01 | -0.1294 |
| 8945 | BTRC | A015-C-204 | Human | Colorectum | FAP | 2.09e-05 | -3.64e-01 | -0.0228 |
| 8945 | BTRC | A002-C-201 | Human | Colorectum | FAP | 6.99e-08 | -3.28e-01 | 0.0324 |
| 8945 | BTRC | A001-C-119 | Human | Colorectum | FAP | 3.97e-03 | -3.40e-01 | -0.1557 |
| 8945 | BTRC | A001-C-108 | Human | Colorectum | FAP | 1.03e-11 | -2.20e-01 | -0.0272 |
| 8945 | BTRC | A002-C-205 | Human | Colorectum | FAP | 3.45e-14 | -3.78e-01 | -0.1236 |
| 8945 | BTRC | A001-C-104 | Human | Colorectum | FAP | 1.37e-06 | -2.65e-01 | 0.0184 |
| 8945 | BTRC | A015-C-005 | Human | Colorectum | FAP | 4.33e-03 | -2.90e-01 | -0.0336 |
| 8945 | BTRC | A015-C-006 | Human | Colorectum | FAP | 4.33e-10 | -3.91e-01 | -0.0994 |
| 8945 | BTRC | A015-C-106 | Human | Colorectum | FAP | 1.38e-12 | -3.32e-01 | -0.0511 |
| Page: 1 2 3 4 |
| Tissue | Expression Dynamics | Abbreviation |
| Cervix | 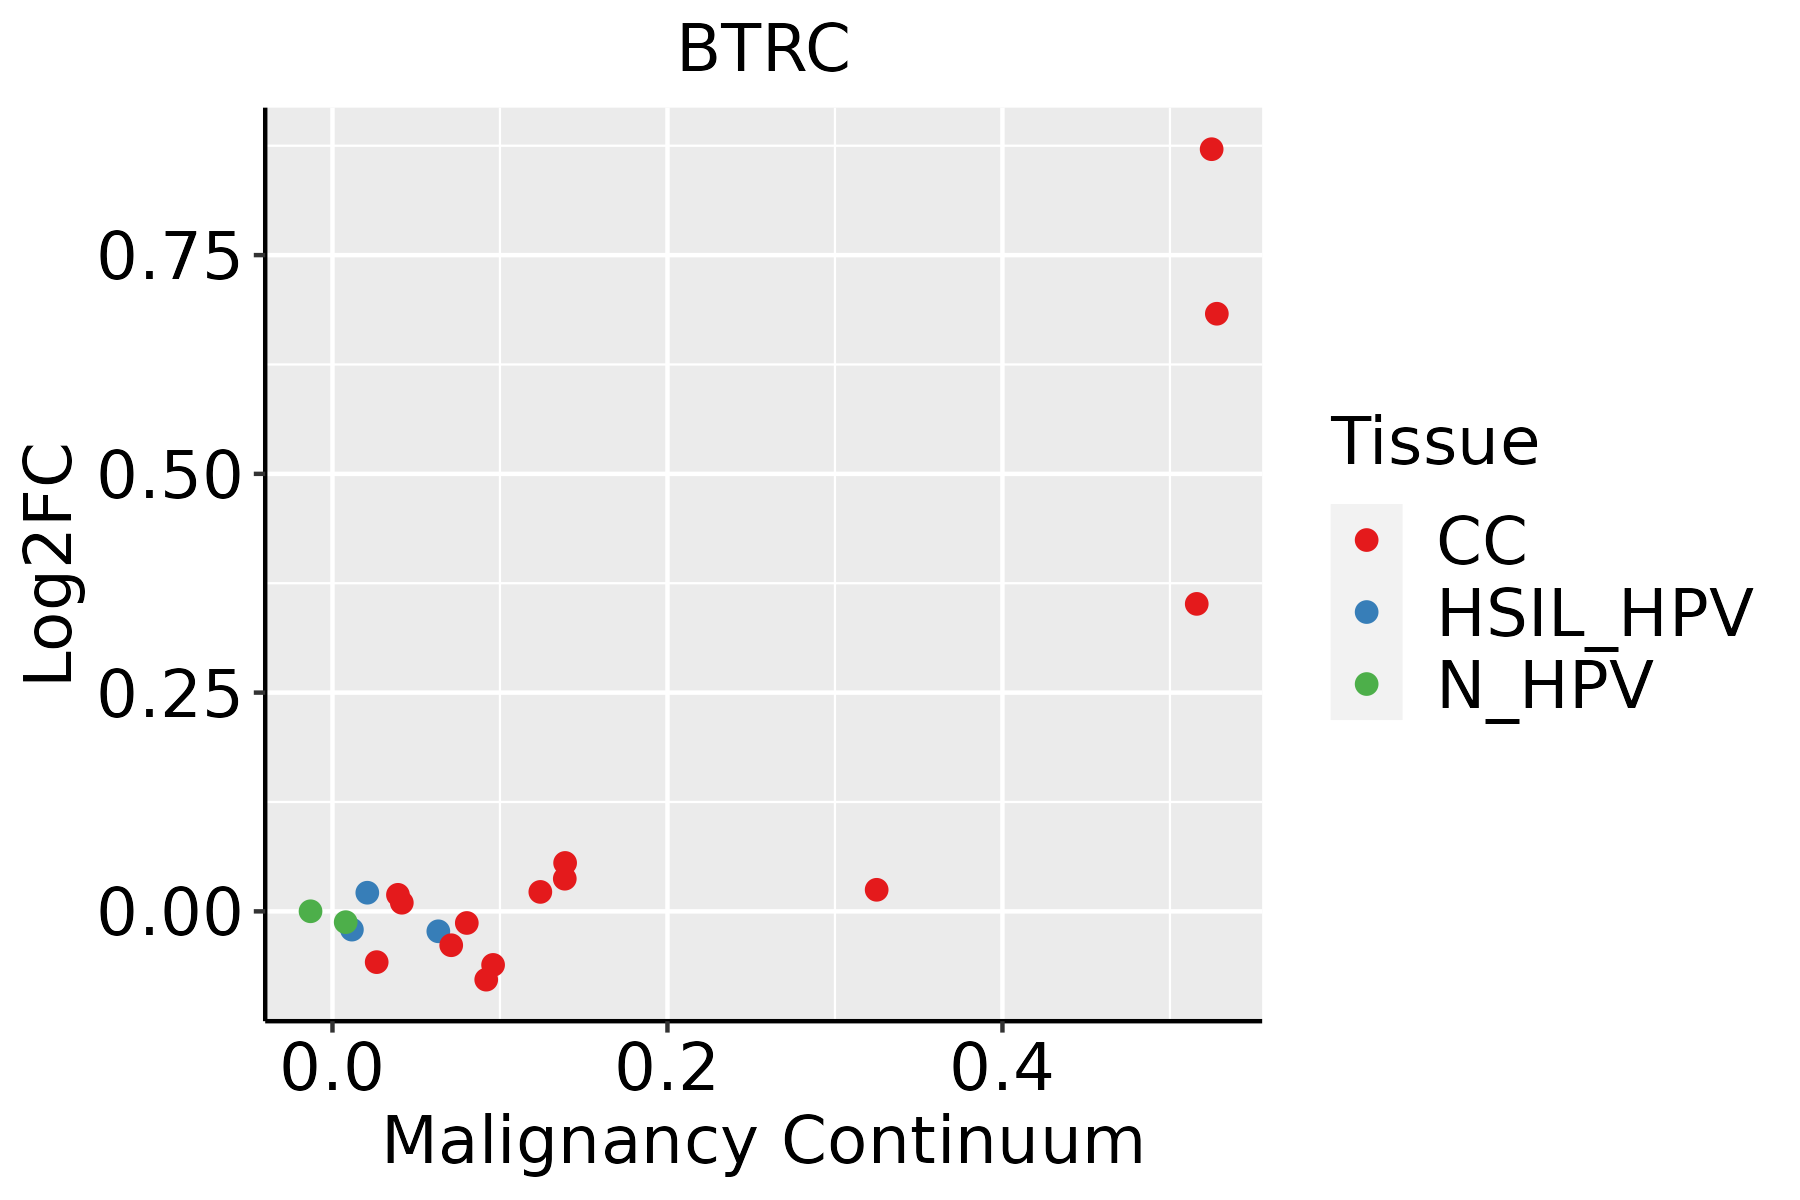 | CC: Cervix cancer |
| HSIL_HPV: HPV-infected high-grade squamous intraepithelial lesions | ||
| N_HPV: HPV-infected normal cervix | ||
| Colorectum (GSE201348) |  | FAP: Familial adenomatous polyposis |
| CRC: Colorectal cancer | ||
| Colorectum (HTA11) | 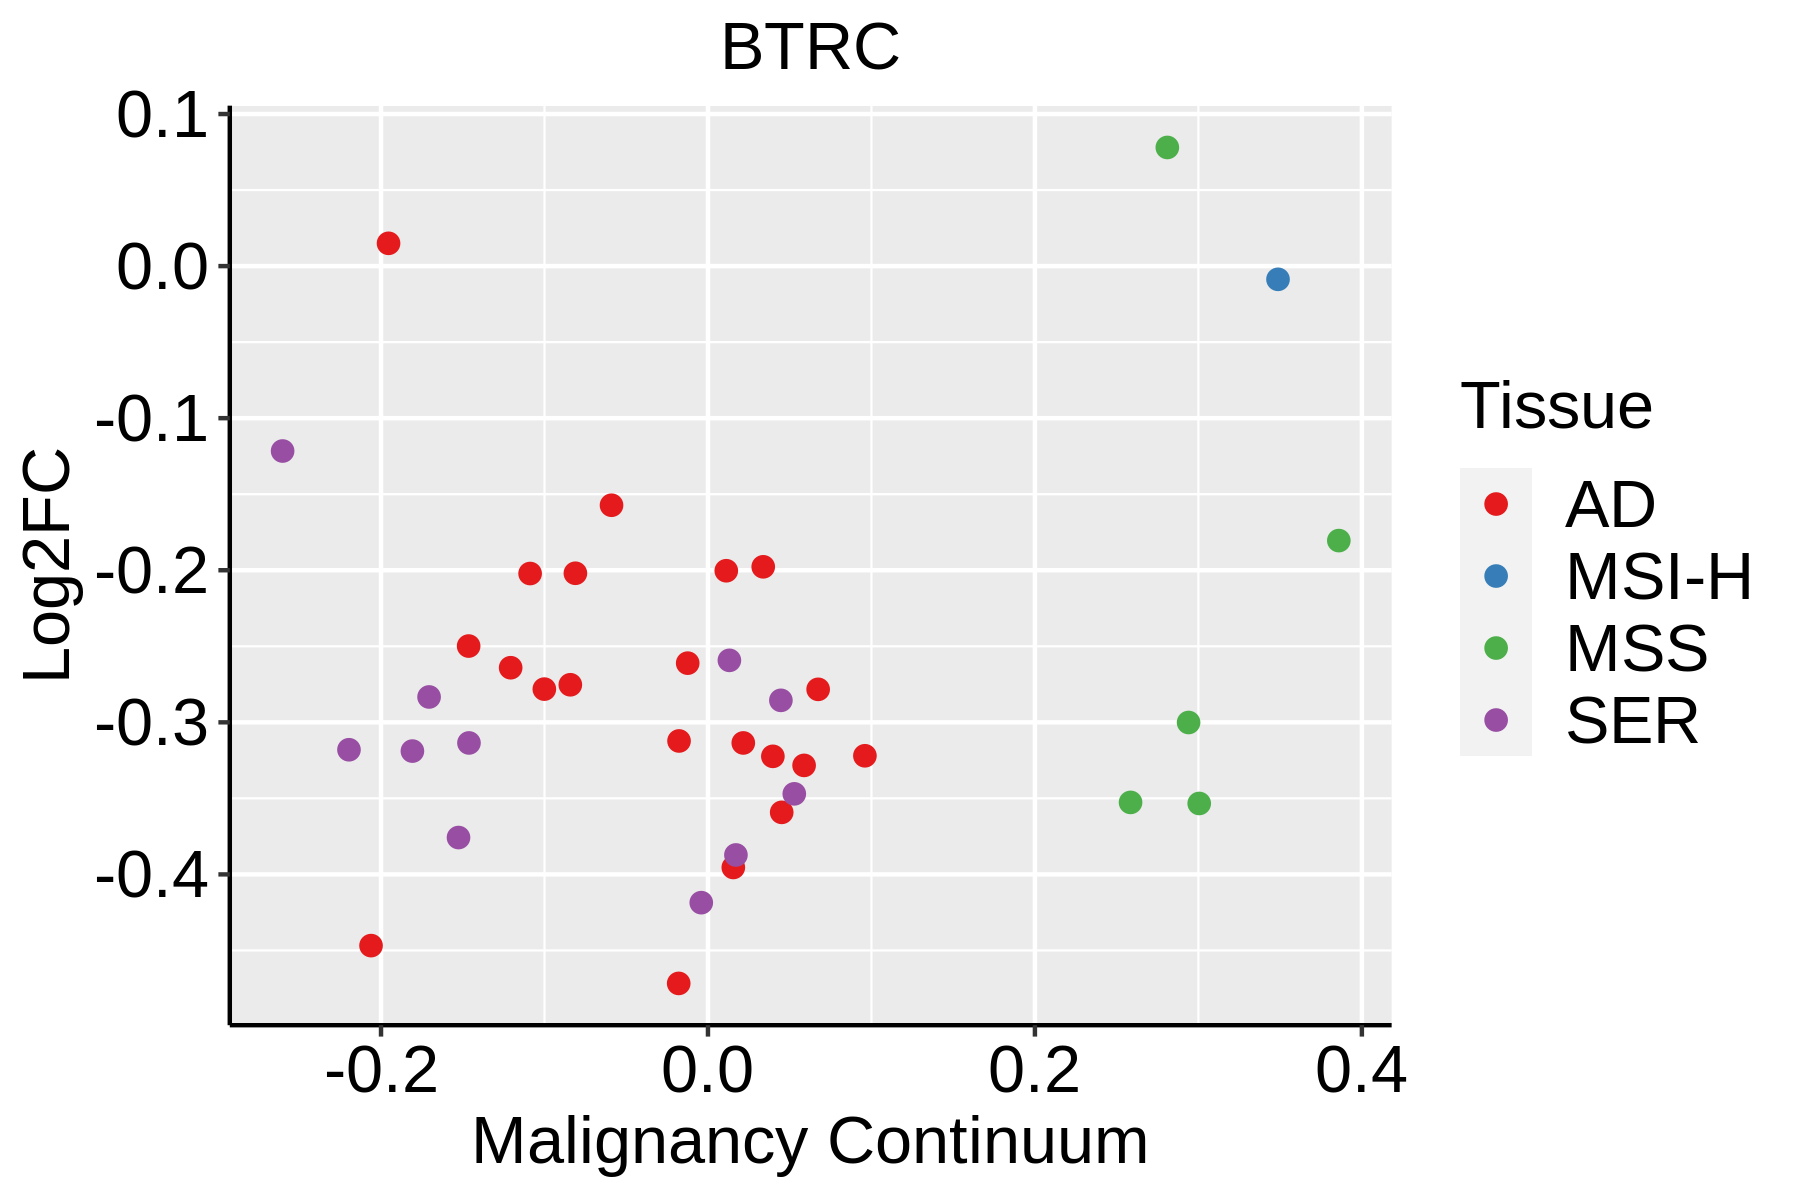 | AD: Adenomas |
| SER: Sessile serrated lesions | ||
| MSI-H: Microsatellite-high colorectal cancer | ||
| MSS: Microsatellite stable colorectal cancer | ||
| Endometrium | 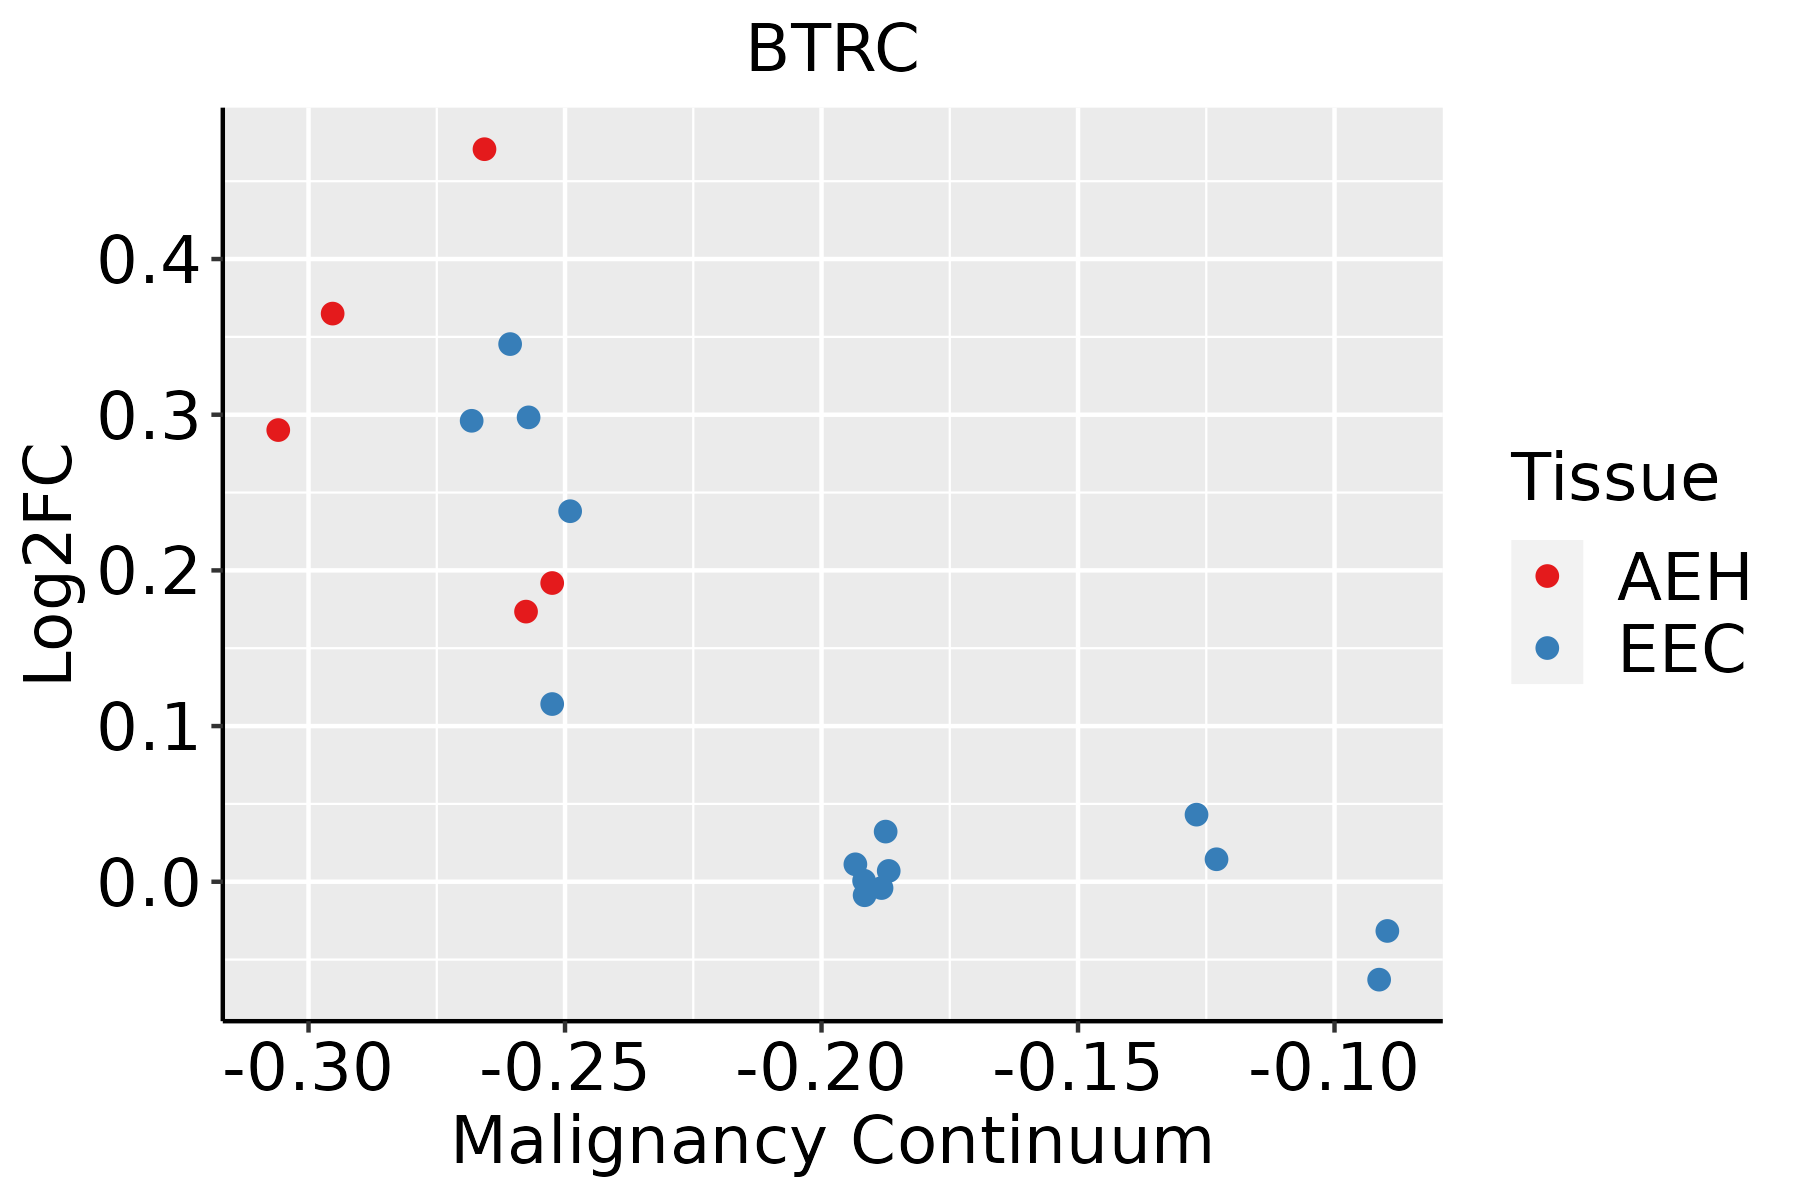 | AEH: Atypical endometrial hyperplasia |
| EEC: Endometrioid Cancer | ||
| Lung | 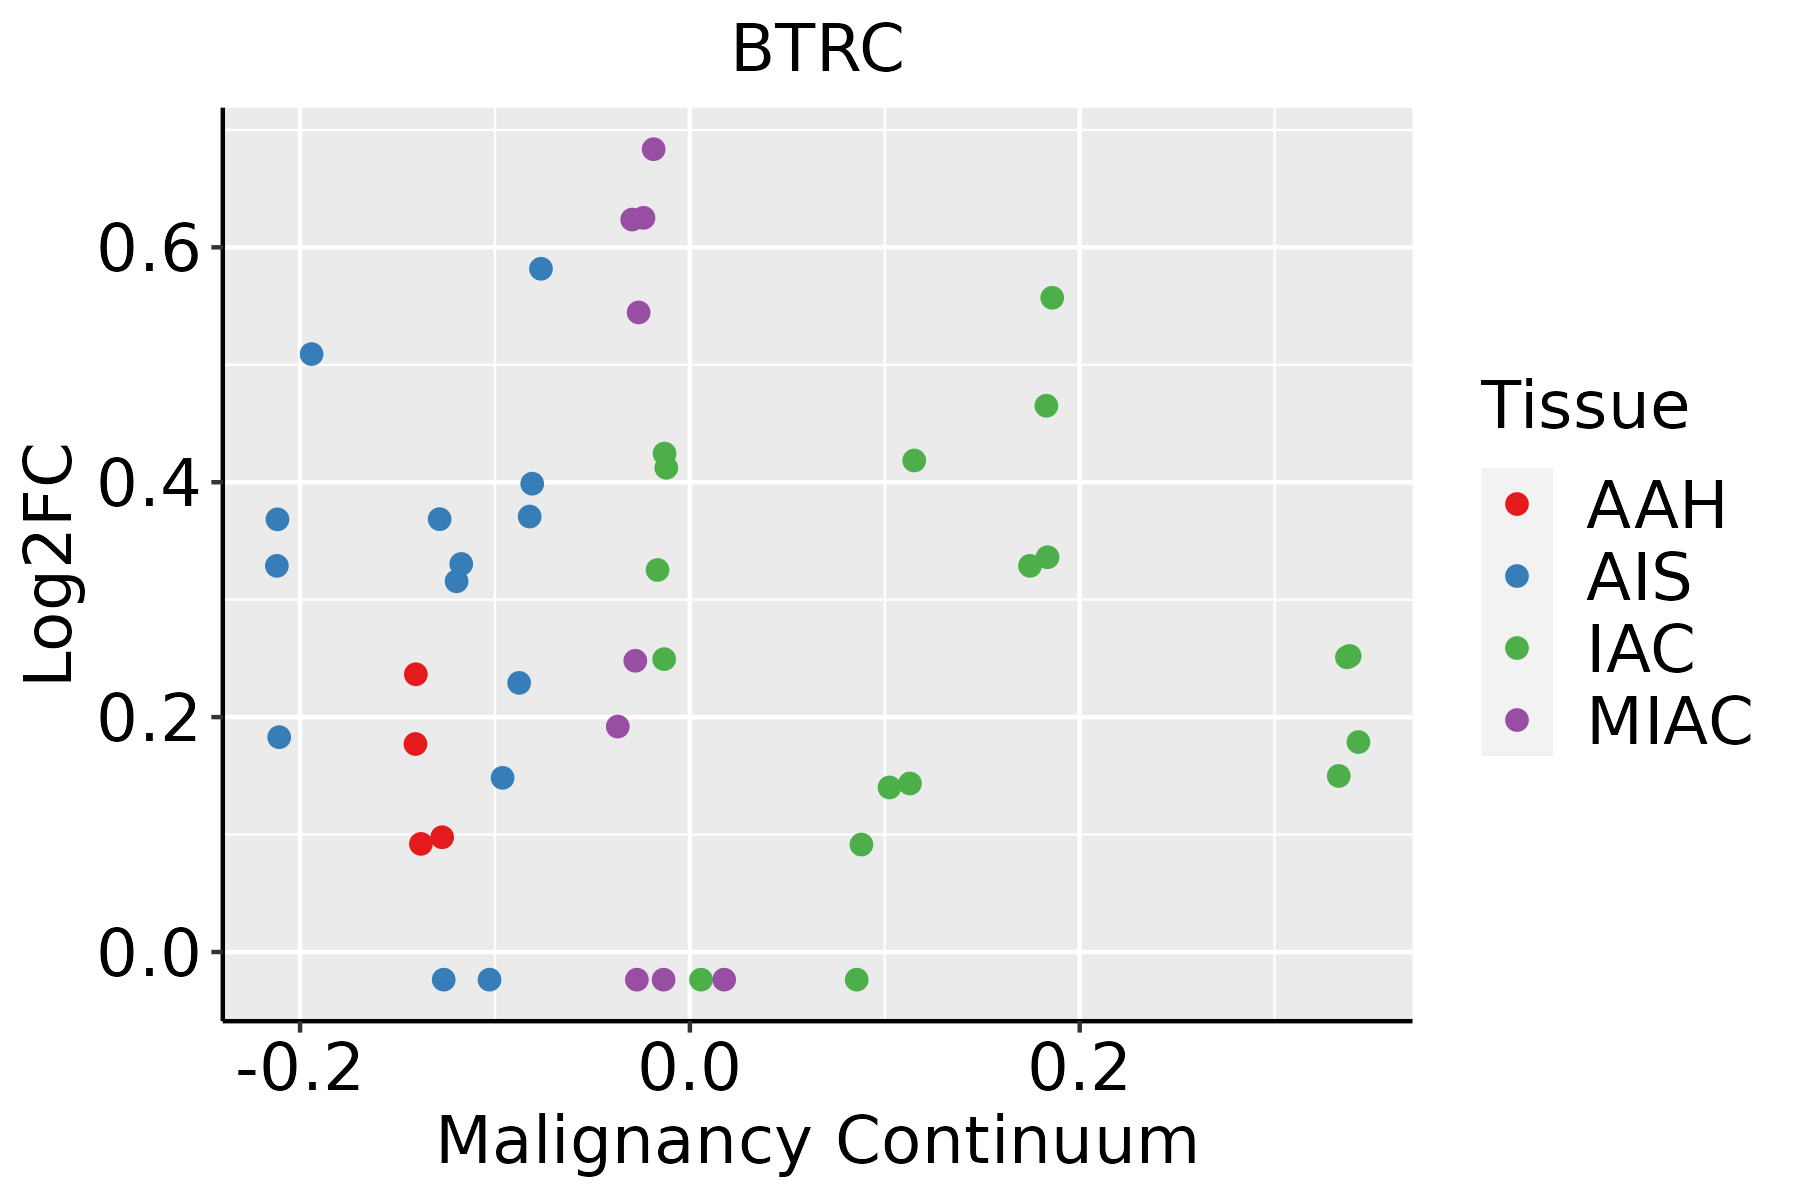 | AAH: Atypical adenomatous hyperplasia |
| AIS: Adenocarcinoma in situ | ||
| IAC: Invasive lung adenocarcinoma | ||
| MIA: Minimally invasive adenocarcinoma |
| ∗log2FC in expression of this searched gene in stem-like cells from each diseased tissue sample relative to stem-like cells in normal samples in each tissue plotted against the malignancy continuum. Samples are colored based on if they are from different disease stage. |
Top |
Malignant transformation related pathway analysis |
| Find out the enriched GO biological processes and KEGG pathways involved in transition from healthy to precancer to cancer |
| Tissue | Disease Stage | Enriched GO biological Processes |
| Colorectum | AD |  |
| Colorectum | SER |  |
| Colorectum | MSS |  |
| Colorectum | MSI-H |  |
| Colorectum | FAP |  |
| ∗Top 15 enriched GO BP terms are showed in the bar plot of each disease state in each tissue. Each row represents a significant GO biological process which is colored according to the -log10(p.adjust). |
| Page: 1 2 3 4 5 6 7 8 9 |
| GO ID | Tissue | Disease Stage | Description | Gene Ratio | Bg Ratio | pvalue | p.adjust | Count |
| GO:004217610 | Cervix | CC | regulation of protein catabolic process | 104/2311 | 391/18723 | 9.39e-15 | 9.36e-12 | 104 |
| GO:004586210 | Cervix | CC | positive regulation of proteolysis | 95/2311 | 372/18723 | 1.84e-12 | 6.86e-10 | 95 |
| GO:190336210 | Cervix | CC | regulation of cellular protein catabolic process | 72/2311 | 255/18723 | 5.98e-12 | 2.10e-09 | 72 |
| GO:001049810 | Cervix | CC | proteasomal protein catabolic process | 111/2311 | 490/18723 | 8.98e-11 | 1.58e-08 | 111 |
| GO:190332010 | Cervix | CC | regulation of protein modification by small protein conjugation or removal | 66/2311 | 242/18723 | 2.31e-10 | 3.46e-08 | 66 |
| GO:003139610 | Cervix | CC | regulation of protein ubiquitination | 59/2311 | 210/18723 | 5.90e-10 | 7.51e-08 | 59 |
| GO:190305010 | Cervix | CC | regulation of proteolysis involved in cellular protein catabolic process | 60/2311 | 221/18723 | 1.82e-09 | 1.98e-07 | 60 |
| GO:00506737 | Cervix | CC | epithelial cell proliferation | 98/2311 | 437/18723 | 2.01e-09 | 2.15e-07 | 98 |
| GO:00160557 | Cervix | CC | Wnt signaling pathway | 98/2311 | 444/18723 | 4.82e-09 | 4.65e-07 | 98 |
| GO:01987387 | Cervix | CC | cell-cell signaling by wnt | 98/2311 | 446/18723 | 6.16e-09 | 5.58e-07 | 98 |
| GO:004316110 | Cervix | CC | proteasome-mediated ubiquitin-dependent protein catabolic process | 91/2311 | 412/18723 | 1.65e-08 | 1.25e-06 | 91 |
| GO:00301117 | Cervix | CC | regulation of Wnt signaling pathway | 76/2311 | 328/18723 | 3.05e-08 | 2.08e-06 | 76 |
| GO:00002097 | Cervix | CC | protein polyubiquitination | 58/2311 | 236/18723 | 1.57e-07 | 7.41e-06 | 58 |
| GO:006113610 | Cervix | CC | regulation of proteasomal protein catabolic process | 48/2311 | 187/18723 | 4.63e-07 | 1.77e-05 | 48 |
| GO:00608287 | Cervix | CC | regulation of canonical Wnt signaling pathway | 58/2311 | 253/18723 | 1.83e-06 | 5.89e-05 | 58 |
| GO:00600707 | Cervix | CC | canonical Wnt signaling pathway | 66/2311 | 303/18723 | 2.47e-06 | 7.35e-05 | 66 |
| GO:00485118 | Cervix | CC | rhythmic process | 65/2311 | 298/18723 | 2.79e-06 | 8.04e-05 | 65 |
| GO:19046669 | Cervix | CC | regulation of ubiquitin protein ligase activity | 12/2311 | 23/18723 | 4.41e-06 | 1.12e-04 | 12 |
| GO:00510904 | Cervix | CC | regulation of DNA-binding transcription factor activity | 87/2311 | 440/18723 | 4.85e-06 | 1.22e-04 | 87 |
| GO:00709366 | Cervix | CC | protein K48-linked ubiquitination | 22/2311 | 65/18723 | 5.56e-06 | 1.38e-04 | 22 |
| Page: 1 2 3 4 5 6 7 8 9 10 11 12 13 14 15 16 17 18 |
| Pathway ID | Tissue | Disease Stage | Description | Gene Ratio | Bg Ratio | pvalue | p.adjust | qvalue | Count |
| hsa0412014 | Cervix | CC | Ubiquitin mediated proteolysis | 49/1267 | 142/8465 | 4.26e-09 | 7.68e-08 | 4.54e-08 | 49 |
| hsa0513120 | Cervix | CC | Shigellosis | 69/1267 | 247/8465 | 7.64e-08 | 1.03e-06 | 6.10e-07 | 69 |
| hsa0421810 | Cervix | CC | Cellular senescence | 49/1267 | 156/8465 | 1.30e-07 | 1.63e-06 | 9.61e-07 | 49 |
| hsa0517016 | Cervix | CC | Human immunodeficiency virus 1 infection | 55/1267 | 212/8465 | 1.80e-05 | 1.42e-04 | 8.40e-05 | 55 |
| hsa043109 | Cervix | CC | Wnt signaling pathway | 43/1267 | 171/8465 | 3.03e-04 | 1.64e-03 | 9.68e-04 | 43 |
| hsa043908 | Cervix | CC | Hippo signaling pathway | 40/1267 | 157/8465 | 3.64e-04 | 1.82e-03 | 1.07e-03 | 40 |
| hsa0412015 | Cervix | CC | Ubiquitin mediated proteolysis | 49/1267 | 142/8465 | 4.26e-09 | 7.68e-08 | 4.54e-08 | 49 |
| hsa05131110 | Cervix | CC | Shigellosis | 69/1267 | 247/8465 | 7.64e-08 | 1.03e-06 | 6.10e-07 | 69 |
| hsa0421815 | Cervix | CC | Cellular senescence | 49/1267 | 156/8465 | 1.30e-07 | 1.63e-06 | 9.61e-07 | 49 |
| hsa0517017 | Cervix | CC | Human immunodeficiency virus 1 infection | 55/1267 | 212/8465 | 1.80e-05 | 1.42e-04 | 8.40e-05 | 55 |
| hsa0431012 | Cervix | CC | Wnt signaling pathway | 43/1267 | 171/8465 | 3.03e-04 | 1.64e-03 | 9.68e-04 | 43 |
| hsa0439013 | Cervix | CC | Hippo signaling pathway | 40/1267 | 157/8465 | 3.64e-04 | 1.82e-03 | 1.07e-03 | 40 |
| hsa05131 | Colorectum | AD | Shigellosis | 109/2092 | 247/8465 | 1.09e-11 | 2.44e-10 | 1.55e-10 | 109 |
| hsa04120 | Colorectum | AD | Ubiquitin mediated proteolysis | 58/2092 | 142/8465 | 1.46e-05 | 1.53e-04 | 9.76e-05 | 58 |
| hsa05170 | Colorectum | AD | Human immunodeficiency virus 1 infection | 72/2092 | 212/8465 | 1.40e-03 | 8.46e-03 | 5.39e-03 | 72 |
| hsa04218 | Colorectum | AD | Cellular senescence | 53/2092 | 156/8465 | 5.55e-03 | 2.48e-02 | 1.58e-02 | 53 |
| hsa04310 | Colorectum | AD | Wnt signaling pathway | 56/2092 | 171/8465 | 1.03e-02 | 3.93e-02 | 2.51e-02 | 56 |
| hsa051311 | Colorectum | AD | Shigellosis | 109/2092 | 247/8465 | 1.09e-11 | 2.44e-10 | 1.55e-10 | 109 |
| hsa041201 | Colorectum | AD | Ubiquitin mediated proteolysis | 58/2092 | 142/8465 | 1.46e-05 | 1.53e-04 | 9.76e-05 | 58 |
| hsa051701 | Colorectum | AD | Human immunodeficiency virus 1 infection | 72/2092 | 212/8465 | 1.40e-03 | 8.46e-03 | 5.39e-03 | 72 |
| Page: 1 2 3 4 5 6 |
Top |
Cell-cell communication analysis |
| Identification of potential cell-cell interactions between two cell types and their ligand-receptor pairs for different disease states |
| Ligand | Receptor | LRpair | Pathway | Tissue | Disease Stage |
| Page: 1 |
Top |
Single-cell gene regulatory network inference analysis |
| Find out the significant the regulons (TFs) and the target genes of each regulon across cell types for different disease states |
| TF | Cell Type | Tissue | Disease Stage | Target Gene | RSS | Regulon Activity |
| ∗The dot plots of a searched regulon are shown for all cell subpopulations in each disease state of each tissue based on the regulon specific score inferred using pySCENIC and by calculating the average expression. |
| Page: 1 |
Top |
Somatic mutation of malignant transformation related genes |
| Annotation of somatic variants for genes involved in malignant transformation |
| Hugo Symbol | Variant Class | Variant Classification | dbSNP RS | HGVSc | HGVSp | HGVSp Short | SWISSPROT | BIOTYPE | SIFT | PolyPhen | Tumor Sample Barcode | Tissue | Histology | Sex | Age | Stage | Therapy Types | Drugs | Outcome |
| BTRC | SNV | Missense_Mutation | novel | c.226N>G | p.Leu76Val | p.L76V | Q9Y297 | protein_coding | tolerated_low_confidence(0.19) | possibly_damaging(0.745) | TCGA-AN-A0XW-01 | Breast | breast invasive carcinoma | Female | <65 | III/IV | Unknown | Unknown | SD |
| BTRC | SNV | Missense_Mutation | novel | c.1141C>T | p.His381Tyr | p.H381Y | Q9Y297 | protein_coding | deleterious(0.05) | probably_damaging(0.998) | TCGA-BH-A0B6-01 | Breast | breast invasive carcinoma | Female | <65 | I/II | Unknown | Unknown | SD |
| BTRC | SNV | Missense_Mutation | c.934N>A | p.Asp312Asn | p.D312N | Q9Y297 | protein_coding | deleterious(0) | probably_damaging(1) | TCGA-C8-A275-01 | Breast | breast invasive carcinoma | Female | <65 | I/II | Unknown | Unknown | SD | |
| BTRC | SNV | Missense_Mutation | c.580N>C | p.Glu194Gln | p.E194Q | Q9Y297 | protein_coding | tolerated(0.08) | probably_damaging(0.999) | TCGA-D8-A27G-01 | Breast | breast invasive carcinoma | Female | >=65 | I/II | Unknown | Unknown | SD | |
| BTRC | SNV | Missense_Mutation | novel | c.1379N>C | p.Arg460Thr | p.R460T | Q9Y297 | protein_coding | deleterious(0) | probably_damaging(0.96) | TCGA-GM-A3XL-01 | Breast | breast invasive carcinoma | Female | <65 | I/II | Chemotherapy | fluorouracil | CR |
| BTRC | SNV | Missense_Mutation | c.113N>A | p.Arg38Gln | p.R38Q | Q9Y297 | protein_coding | deleterious_low_confidence(0.02) | benign(0) | TCGA-LL-A5YL-01 | Breast | breast invasive carcinoma | Female | <65 | I/II | Chemotherapy | adriamycin | SD | |
| BTRC | insertion | Frame_Shift_Ins | rs774921343 | c.1773_1774insC | p.Arg594ProfsTer27 | p.R594Pfs*27 | Q9Y297 | protein_coding | TCGA-AN-A04C-01 | Breast | breast invasive carcinoma | Female | <65 | I/II | Unknown | Unknown | SD | ||
| BTRC | deletion | Frame_Shift_Del | novel | c.1781_1790delGTTCCCCTTC | p.Arg594LeufsTer11 | p.R594Lfs*11 | Q9Y297 | protein_coding | TCGA-E9-A1NC-01 | Breast | breast invasive carcinoma | Female | <65 | I/II | Chemotherapy | doxorubicin | CR | ||
| BTRC | SNV | Missense_Mutation | c.83C>G | p.Ser28Cys | p.S28C | Q9Y297 | protein_coding | deleterious_low_confidence(0) | probably_damaging(0.923) | TCGA-DG-A2KK-01 | Cervix | cervical & endocervical cancer | Female | <65 | III/IV | Chemotherapy | cisplatin | SD | |
| BTRC | SNV | Missense_Mutation | novel | c.350N>T | p.Ser117Ile | p.S117I | Q9Y297 | protein_coding | tolerated_low_confidence(0.13) | benign(0.096) | TCGA-EA-A4BA-01 | Cervix | cervical & endocervical cancer | Female | <65 | I/II | Chemotherapy | carboplatin | CR |
| Page: 1 2 3 4 5 6 7 8 9 |
Top |
Related drugs of malignant transformation related genes |
| Identification of chemicals and drugs interact with genes involved in malignant transfromation |
| (DGIdb 4.0) |
| Entrez ID | Symbol | Category | Interaction Types | Drug Claim Name | Drug Name | PMIDs |
| Page: 1 |

Copyright 2023-Present -The University of Texas Health Science Center at Houston |