
|
|||||
|
 | |
| |
| |
| |
| |
| |
|
Gene: BTN3A3 |
Gene summary for BTN3A3 |
| Gene information | Species | Human | Gene symbol | BTN3A3 | Gene ID | 10384 |
| Gene name | butyrophilin subfamily 3 member A3 | |
| Gene Alias | BTF3 | |
| Cytomap | 6p22.2 | |
| Gene Type | protein-coding | GO ID | GO:0001816 | UniProtAcc | O00478 |
Top |
Malignant transformation analysis |
| Identification of the aberrant gene expression in precancerous and cancerous lesions by comparing the gene expression of stem-like cells in diseased tissues with normal stem cells |
| Entrez ID | Symbol | Replicates | Species | Organ | Tissue | Adj P-value | Log2FC | Malignancy |
| 10384 | BTN3A3 | LZE24T | Human | Esophagus | ESCC | 1.79e-13 | 4.32e-01 | 0.0596 |
| 10384 | BTN3A3 | LZE6T | Human | Esophagus | ESCC | 2.79e-03 | 1.70e-01 | 0.0845 |
| 10384 | BTN3A3 | P2T-E | Human | Esophagus | ESCC | 4.19e-25 | 4.34e-01 | 0.1177 |
| 10384 | BTN3A3 | P4T-E | Human | Esophagus | ESCC | 9.33e-06 | 1.98e-01 | 0.1323 |
| 10384 | BTN3A3 | P8T-E | Human | Esophagus | ESCC | 3.97e-04 | 1.19e-01 | 0.0889 |
| 10384 | BTN3A3 | P9T-E | Human | Esophagus | ESCC | 3.50e-10 | 2.28e-01 | 0.1131 |
| 10384 | BTN3A3 | P11T-E | Human | Esophagus | ESCC | 9.99e-11 | 3.84e-01 | 0.1426 |
| 10384 | BTN3A3 | P16T-E | Human | Esophagus | ESCC | 1.66e-02 | 7.28e-02 | 0.1153 |
| 10384 | BTN3A3 | P17T-E | Human | Esophagus | ESCC | 8.84e-03 | 1.56e-01 | 0.1278 |
| 10384 | BTN3A3 | P19T-E | Human | Esophagus | ESCC | 7.88e-03 | 2.96e-01 | 0.1662 |
| 10384 | BTN3A3 | P20T-E | Human | Esophagus | ESCC | 7.96e-03 | 1.41e-01 | 0.1124 |
| 10384 | BTN3A3 | P21T-E | Human | Esophagus | ESCC | 1.31e-18 | 3.23e-01 | 0.1617 |
| 10384 | BTN3A3 | P22T-E | Human | Esophagus | ESCC | 1.96e-05 | 1.26e-01 | 0.1236 |
| 10384 | BTN3A3 | P23T-E | Human | Esophagus | ESCC | 1.67e-04 | 1.74e-01 | 0.108 |
| 10384 | BTN3A3 | P24T-E | Human | Esophagus | ESCC | 3.28e-14 | 2.33e-01 | 0.1287 |
| 10384 | BTN3A3 | P26T-E | Human | Esophagus | ESCC | 1.88e-04 | 7.40e-02 | 0.1276 |
| 10384 | BTN3A3 | P27T-E | Human | Esophagus | ESCC | 8.00e-08 | 1.91e-01 | 0.1055 |
| 10384 | BTN3A3 | P31T-E | Human | Esophagus | ESCC | 3.28e-14 | 2.33e-01 | 0.1251 |
| 10384 | BTN3A3 | P36T-E | Human | Esophagus | ESCC | 2.35e-08 | 3.28e-01 | 0.1187 |
| 10384 | BTN3A3 | P37T-E | Human | Esophagus | ESCC | 9.12e-13 | 1.85e-01 | 0.1371 |
| Page: 1 2 3 |
| Tissue | Expression Dynamics | Abbreviation |
| Esophagus | 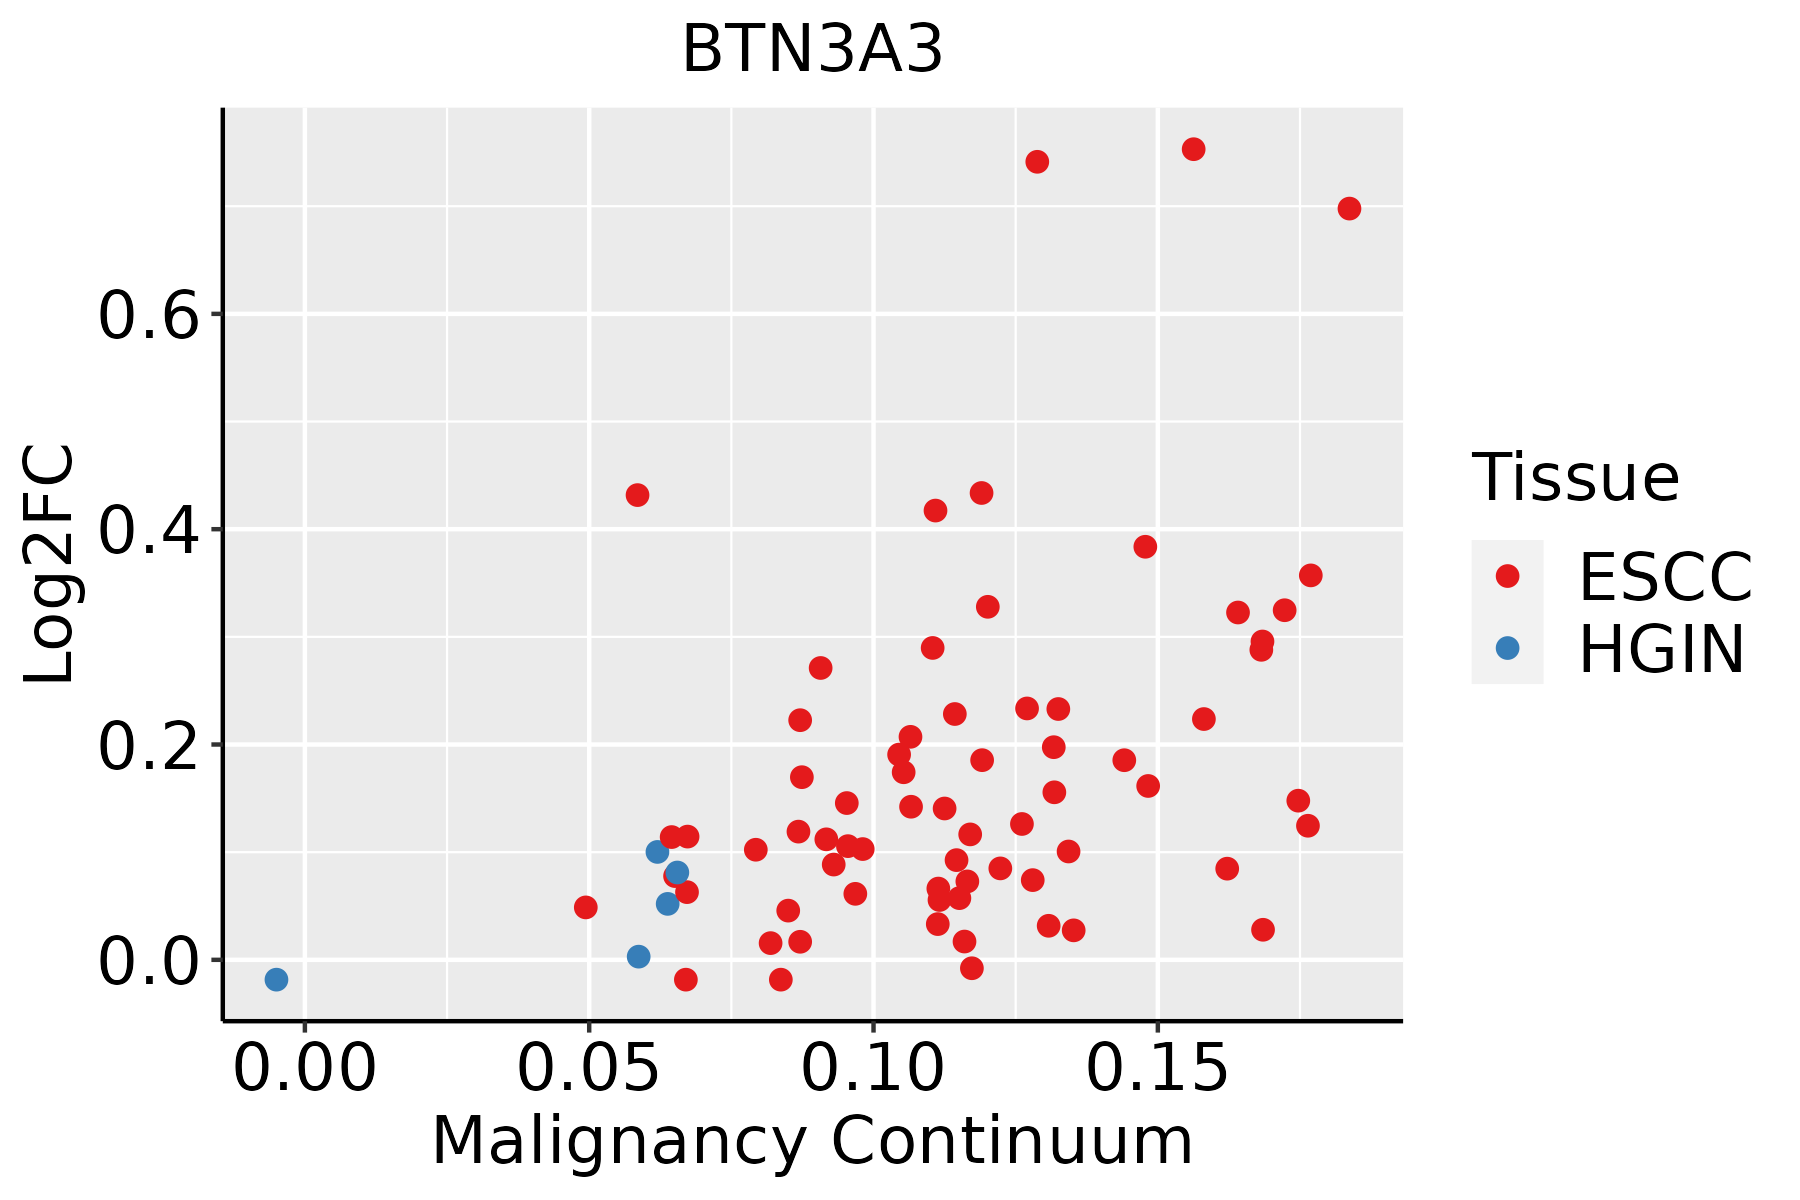 | ESCC: Esophageal squamous cell carcinoma |
| HGIN: High-grade intraepithelial neoplasias | ||
| LGIN: Low-grade intraepithelial neoplasias | ||
| Oral Cavity | 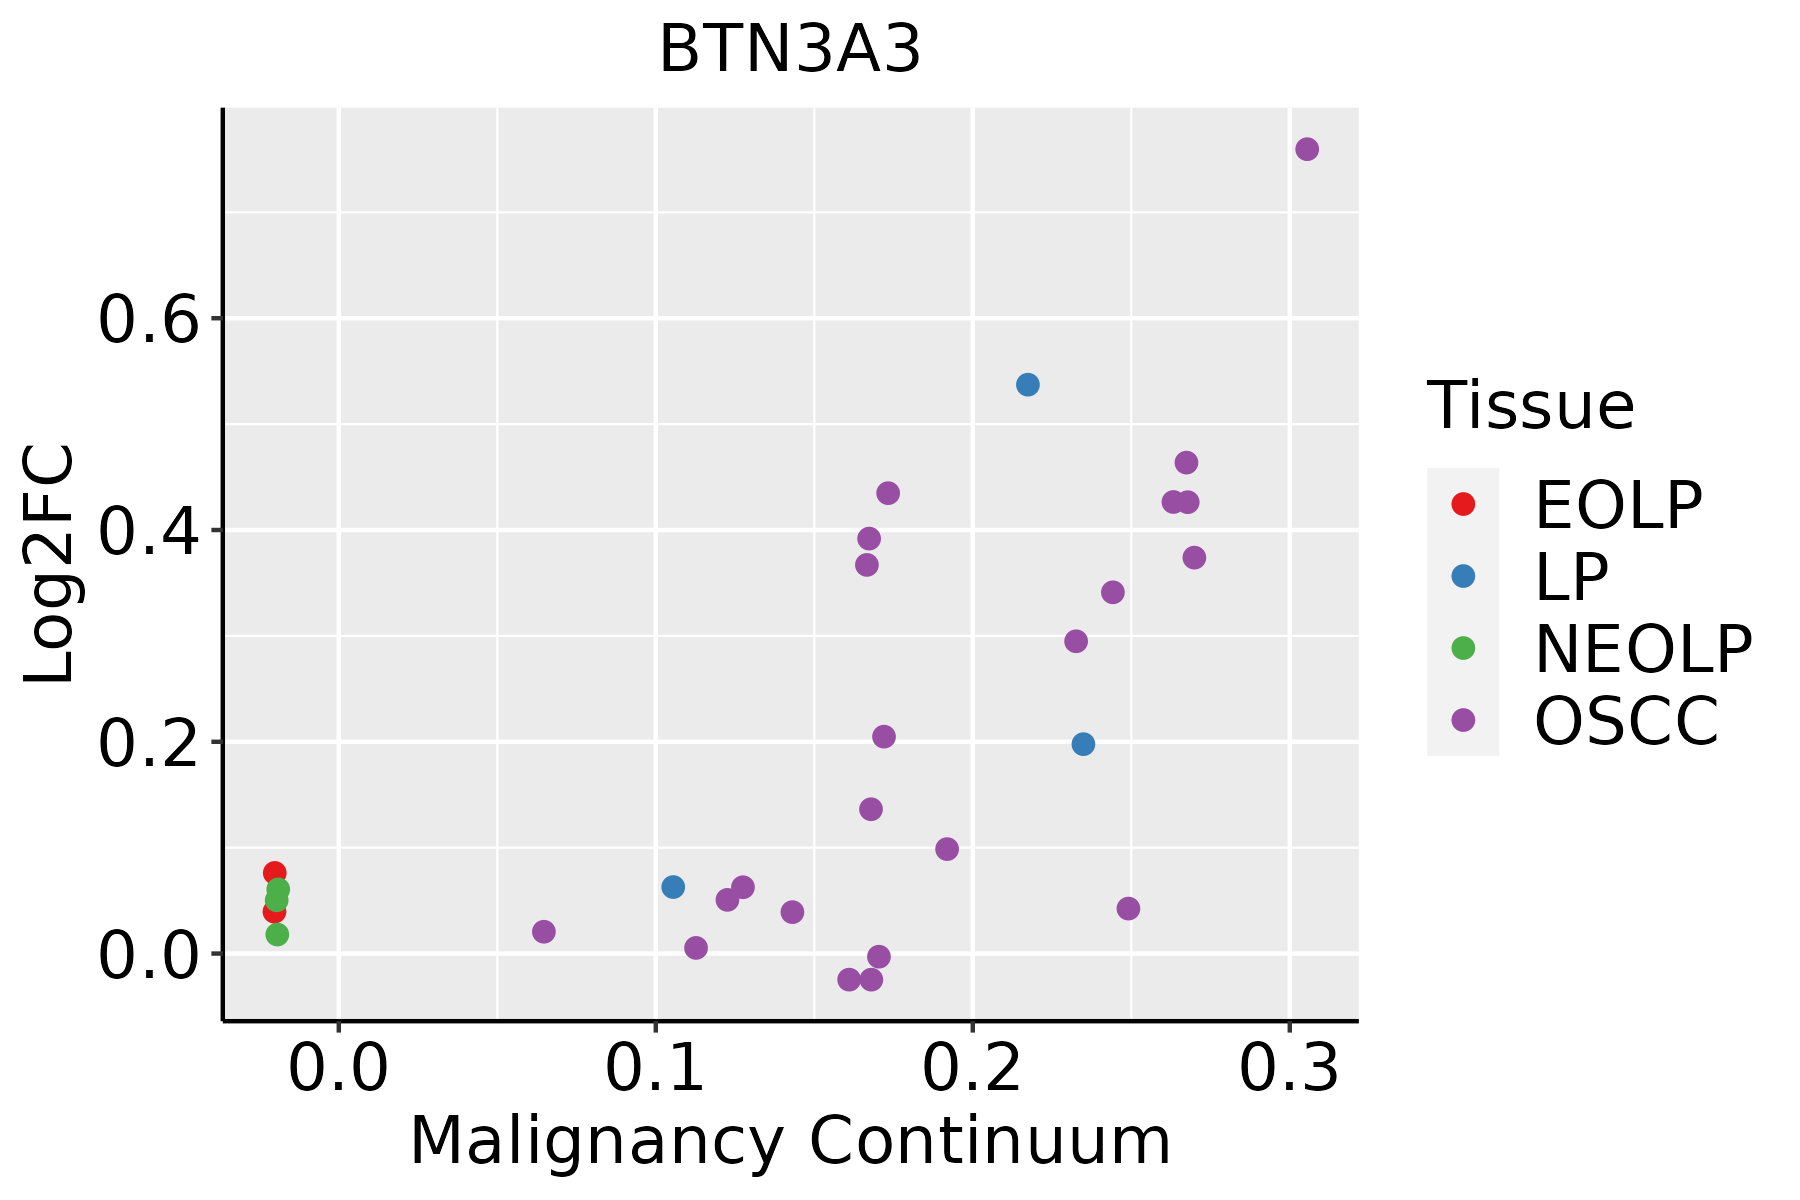 | EOLP: Erosive Oral lichen planus |
| LP: leukoplakia | ||
| NEOLP: Non-erosive oral lichen planus | ||
| OSCC: Oral squamous cell carcinoma |
| ∗log2FC in expression of this searched gene in stem-like cells from each diseased tissue sample relative to stem-like cells in normal samples in each tissue plotted against the malignancy continuum. Samples are colored based on if they are from different disease stage. |
Top |
Malignant transformation related pathway analysis |
| Find out the enriched GO biological processes and KEGG pathways involved in transition from healthy to precancer to cancer |
| Tissue | Disease Stage | Enriched GO biological Processes |
| Colorectum | AD |  |
| Colorectum | SER |  |
| Colorectum | MSS |  |
| Colorectum | MSI-H |  |
| Colorectum | FAP |  |
| ∗Top 15 enriched GO BP terms are showed in the bar plot of each disease state in each tissue. Each row represents a significant GO biological process which is colored according to the -log10(p.adjust). |
| Page: 1 2 3 4 5 6 7 8 9 |
| GO ID | Tissue | Disease Stage | Description | Gene Ratio | Bg Ratio | pvalue | p.adjust | Count |
| GO:00508528 | Esophagus | ESCC | T cell receptor signaling pathway | 73/8552 | 123/18723 | 1.54e-03 | 7.24e-03 | 73 |
| GO:00508527 | Oral cavity | OSCC | T cell receptor signaling pathway | 68/7305 | 123/18723 | 1.80e-04 | 1.22e-03 | 68 |
| GO:00027646 | Oral cavity | OSCC | immune response-regulating signaling pathway | 212/7305 | 468/18723 | 2.93e-03 | 1.27e-02 | 212 |
| Page: 1 |
| Pathway ID | Tissue | Disease Stage | Description | Gene Ratio | Bg Ratio | pvalue | p.adjust | qvalue | Count |
| Page: 1 |
Top |
Cell-cell communication analysis |
| Identification of potential cell-cell interactions between two cell types and their ligand-receptor pairs for different disease states |
| Ligand | Receptor | LRpair | Pathway | Tissue | Disease Stage |
| Page: 1 |
Top |
Single-cell gene regulatory network inference analysis |
| Find out the significant the regulons (TFs) and the target genes of each regulon across cell types for different disease states |
| TF | Cell Type | Tissue | Disease Stage | Target Gene | RSS | Regulon Activity |
| ∗The dot plots of a searched regulon are shown for all cell subpopulations in each disease state of each tissue based on the regulon specific score inferred using pySCENIC and by calculating the average expression. |
| Page: 1 |
Top |
Somatic mutation of malignant transformation related genes |
| Annotation of somatic variants for genes involved in malignant transformation |
| Hugo Symbol | Variant Class | Variant Classification | dbSNP RS | HGVSc | HGVSp | HGVSp Short | SWISSPROT | BIOTYPE | SIFT | PolyPhen | Tumor Sample Barcode | Tissue | Histology | Sex | Age | Stage | Therapy Types | Drugs | Outcome |
| BTN3A3 | SNV | Missense_Mutation | c.17N>A | p.Ser6Tyr | p.S6Y | O00478 | protein_coding | deleterious(0.01) | benign(0.243) | TCGA-AO-A0JB-01 | Breast | breast invasive carcinoma | Female | <65 | III/IV | Chemotherapy | cyclophosphamide | SD | |
| BTN3A3 | SNV | Missense_Mutation | novel | c.1405A>C | p.Thr469Pro | p.T469P | O00478 | protein_coding | deleterious(0.02) | possibly_damaging(0.558) | TCGA-BH-A0HU-01 | Breast | breast invasive carcinoma | Female | <65 | I/II | Chemotherapy | docetaxel | SD |
| BTN3A3 | SNV | Missense_Mutation | c.731N>C | p.Ser244Thr | p.S244T | O00478 | protein_coding | tolerated(0.28) | benign(0.007) | TCGA-BH-A18Q-01 | Breast | breast invasive carcinoma | Female | <65 | I/II | Unknown | Unknown | SD | |
| BTN3A3 | SNV | Missense_Mutation | novel | c.1211N>T | p.Arg404Ile | p.R404I | O00478 | protein_coding | deleterious(0.01) | probably_damaging(0.991) | TCGA-C8-A3M7-01 | Breast | breast invasive carcinoma | Female | <65 | III/IV | Unknown | Unknown | PD |
| BTN3A3 | SNV | Missense_Mutation | c.1404N>C | p.Glu468Asp | p.E468D | O00478 | protein_coding | tolerated(0.09) | probably_damaging(0.987) | TCGA-D8-A1J9-01 | Breast | breast invasive carcinoma | Female | <65 | I/II | Unknown | Unknown | SD | |
| BTN3A3 | SNV | Missense_Mutation | c.379T>C | p.Tyr127His | p.Y127H | O00478 | protein_coding | deleterious(0.02) | probably_damaging(0.999) | TCGA-D8-A1JA-01 | Breast | breast invasive carcinoma | Female | <65 | III/IV | Chemotherapy | adriamycin | PD | |
| BTN3A3 | SNV | Missense_Mutation | c.136G>A | p.Glu46Lys | p.E46K | O00478 | protein_coding | deleterious(0.03) | benign(0.166) | TCGA-D8-A1JJ-01 | Breast | breast invasive carcinoma | Female | <65 | I/II | Chemotherapy | doxorubicine | SD | |
| BTN3A3 | SNV | Missense_Mutation | novel | c.145G>T | p.Asp49Tyr | p.D49Y | O00478 | protein_coding | deleterious(0) | probably_damaging(0.979) | TCGA-LL-A441-01 | Breast | breast invasive carcinoma | Female | <65 | I/II | Chemotherapy | taxotere | CR |
| BTN3A3 | SNV | Missense_Mutation | novel | c.1696N>A | p.Pro566Thr | p.P566T | O00478 | protein_coding | deleterious(0.02) | benign(0.011) | TCGA-BI-A0VS-01 | Cervix | cervical & endocervical cancer | Female | <65 | I/II | Unknown | Unknown | SD |
| BTN3A3 | SNV | Missense_Mutation | rs140844974 | c.632N>C | p.Arg211Thr | p.R211T | O00478 | protein_coding | tolerated(0.1) | benign(0.01) | TCGA-IR-A3LL-01 | Cervix | cervical & endocervical cancer | Female | <65 | I/II | Chemotherapy | cisplatin | CR |
| Page: 1 2 3 4 5 6 7 8 |
Top |
Related drugs of malignant transformation related genes |
| Identification of chemicals and drugs interact with genes involved in malignant transfromation |
| (DGIdb 4.0) |
| Entrez ID | Symbol | Category | Interaction Types | Drug Claim Name | Drug Name | PMIDs |
| Page: 1 |

Copyright 2023-Present -The University of Texas Health Science Center at Houston |