Schematic overview of the cellular and molecular mechanisms involved in the cancer progression, including the proposed cellular and molecular mechanisms in cancer cells trajectory. AT1: alveolar type 1 cells; AT2: alveolar type 2 cells; AAH: atypical adenomatous hyperplasia; AIS: adenocarcinoma in situ; MIA: minimally invasive adenocarcinoma; IA: invasive adenocarcinoma; EMT: epithelial-mesenchymal transition

Home

Download

Statistics

Help

Contact

Center for Computational Systems Medicine
leaf

Gene summary

leaf

Malignant transformation analysis

leaf

Malignant transformation related pathway analysis

leaf

Cell-cell communication analysis

leaf

Single-cell gene regulatory network inference analysis

leaf

Somatic mutation of malignant transformation related genes

leaf

Related drugs of malignant transformation related genes

Gene: BTN3A2

Gene summary for BTN3A2

check button Gene summary.

Gene informationSpeciesHuman
Gene symbol

BTN3A2

Gene ID

11118

Gene namebutyrophilin subfamily 3 member A2
Gene AliasBT3.2
Cytomap6p22.2
Gene Typeprotein-coding
GO ID

GO:0001816

UniProtAcc

P78410


Top

Malignant transformation analysis

check button Identification of the aberrant gene expression in precancerous and cancerous lesions by comparing the gene expression of stem-like cells in diseased tissues with normal stem cells
check button Malignant transformation involving gene list.
Entrez IDSymbolReplicatesSpeciesOrganTissueAdj P-valueLog2FCMalignancy
11118BTN3A2HTA11_3410_2000001011HumanColorectumAD8.54e-082.71e-010.0155
11118BTN3A2HTA11_1938_2000001011HumanColorectumAD1.82e-115.26e-01-0.0811
11118BTN3A2HTA11_78_2000001011HumanColorectumAD2.51e-033.05e-01-0.1088
11118BTN3A2HTA11_347_2000001011HumanColorectumAD5.48e-052.26e-01-0.1954
11118BTN3A2HTA11_3361_2000001011HumanColorectumAD1.97e-021.82e-01-0.1207
11118BTN3A2HTA11_696_2000001011HumanColorectumAD2.46e-042.99e-01-0.1464
11118BTN3A2HTA11_1391_2000001011HumanColorectumAD3.65e-114.52e-01-0.059
11118BTN3A2HTA11_546_2000001011HumanColorectumAD1.53e-033.09e-01-0.0842
11118BTN3A2HTA11_866_3004761011HumanColorectumAD1.21e-083.28e-010.096
11118BTN3A2HTA11_10711_2000001011HumanColorectumAD1.84e-022.22e-010.0338
11118BTN3A2HTA11_7696_3000711011HumanColorectumAD6.24e-032.51e-010.0674
11118BTN3A2HTA11_99999970781_79442HumanColorectumMSS5.33e-052.71e-010.294
11118BTN3A2HTA11_99999965104_69814HumanColorectumMSS1.61e-022.93e-010.281
11118BTN3A2LZE4THumanEsophagusESCC2.07e-041.46e-010.0811
11118BTN3A2LZE7THumanEsophagusESCC2.02e-042.34e-010.0667
11118BTN3A2LZE8THumanEsophagusESCC9.10e-102.70e-010.067
11118BTN3A2LZE20THumanEsophagusESCC1.27e-063.52e-010.0662
11118BTN3A2LZE24THumanEsophagusESCC7.59e-461.15e+000.0596
11118BTN3A2LZE21THumanEsophagusESCC5.86e-032.10e-010.0655
11118BTN3A2LZE6THumanEsophagusESCC1.18e-104.75e-010.0845
Page: 1 2 3 4 5 6 

check button Transcriptomic changes along malignancy continuum.
TissueExpression DynamicsAbbreviation
Colorectum (GSE201348)The image shows the transcriptomic changes along malignancy continuum.log2FC in expression of this searched gene in stem-like cells from each diseased tissue sample relative to stem-like cells in normal samples in each tissue plotted against the malignancy continuum. Samples are colored based on if they are from different disease stage.FAP: Familial adenomatous polyposis
CRC: Colorectal cancer
Colorectum (HTA11)The image shows the transcriptomic changes along malignancy continuum.log2FC in expression of this searched gene in stem-like cells from each diseased tissue sample relative to stem-like cells in normal samples in each tissue plotted against the malignancy continuum. Samples are colored based on if they are from different disease stage.AD: Adenomas
SER: Sessile serrated lesions
MSI-H: Microsatellite-high colorectal cancer
MSS: Microsatellite stable colorectal cancer
EsophagusThe image shows the transcriptomic changes along malignancy continuum.log2FC in expression of this searched gene in stem-like cells from each diseased tissue sample relative to stem-like cells in normal samples in each tissue plotted against the malignancy continuum. Samples are colored based on if they are from different disease stage.ESCC: Esophageal squamous cell carcinoma
HGIN: High-grade intraepithelial neoplasias
LGIN: Low-grade intraepithelial neoplasias
LiverThe image shows the transcriptomic changes along malignancy continuum.log2FC in expression of this searched gene in stem-like cells from each diseased tissue sample relative to stem-like cells in normal samples in each tissue plotted against the malignancy continuum. Samples are colored based on if they are from different disease stage.
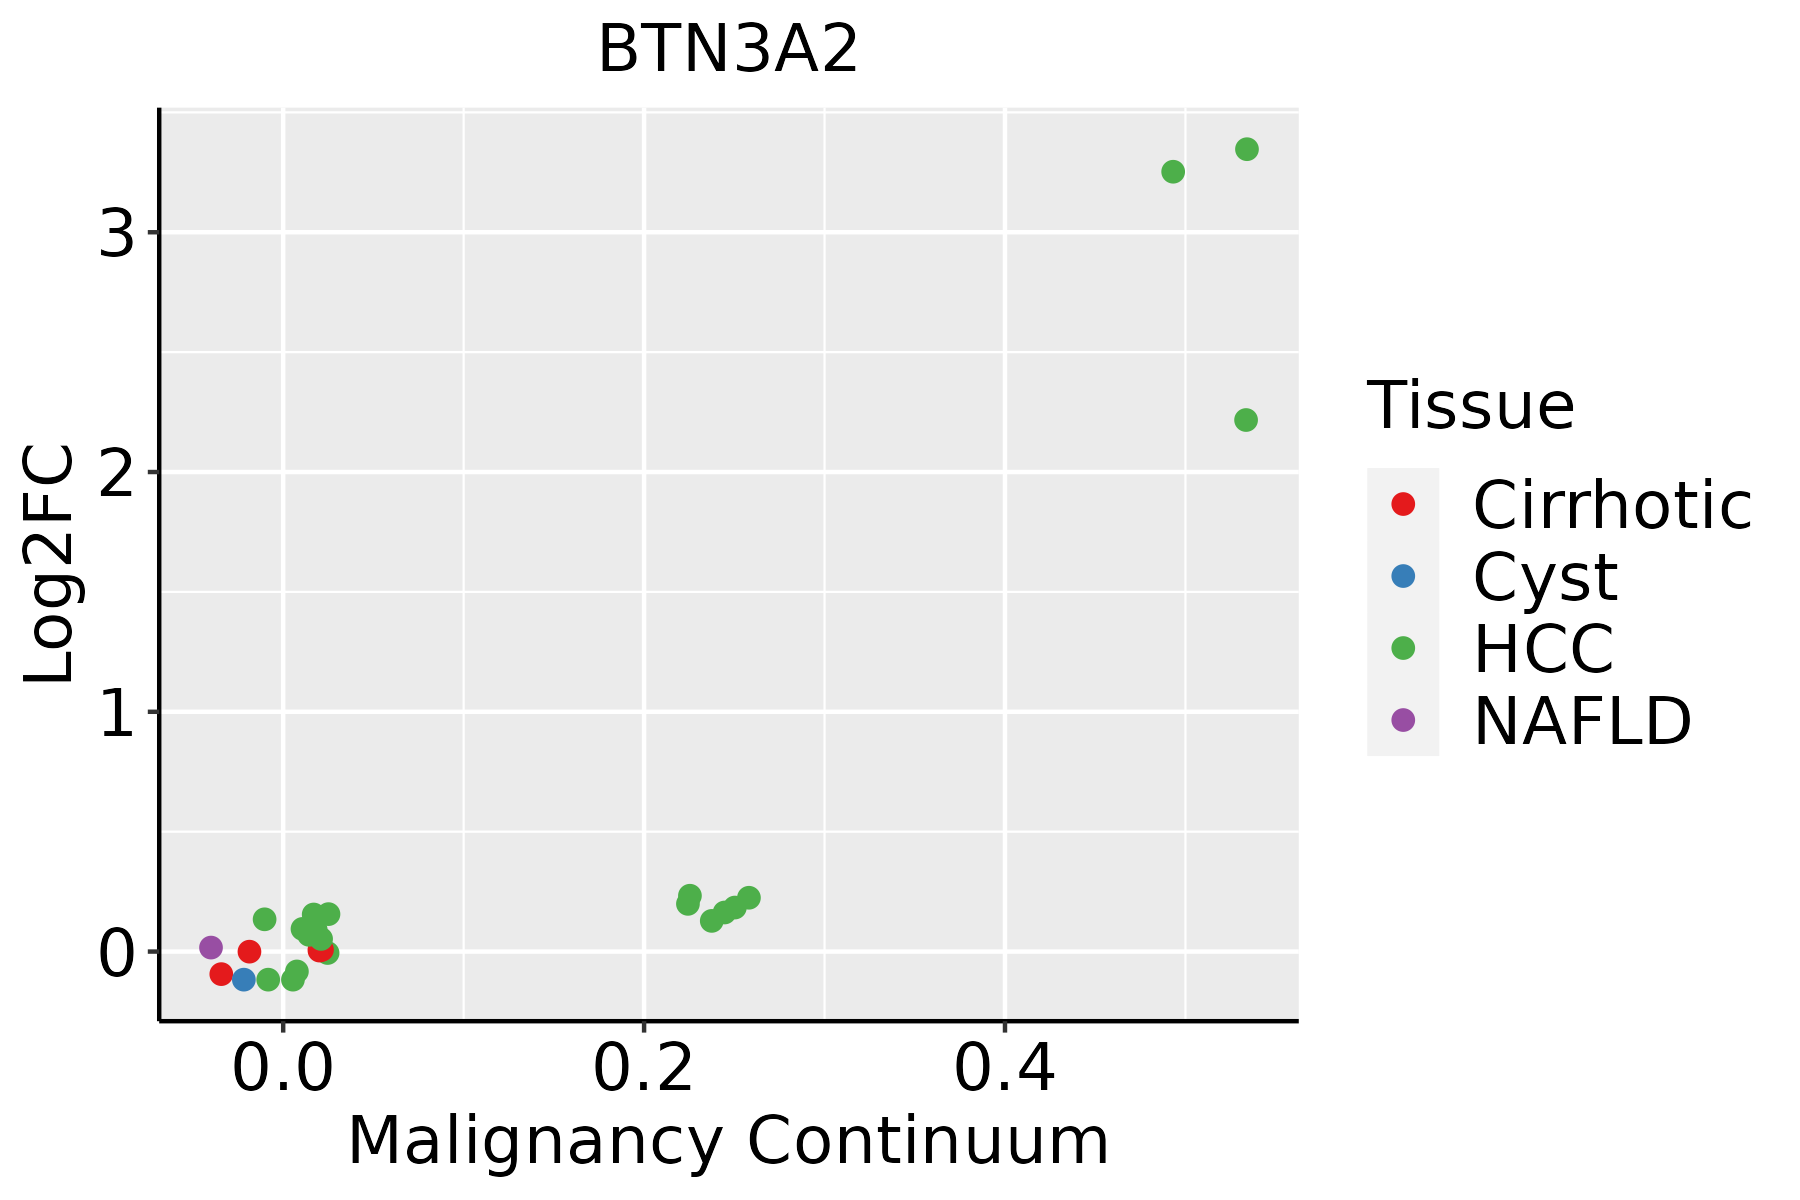
HCC: Hepatocellular carcinoma
NAFLD: Non-alcoholic fatty liver disease
Oral CavityThe image shows the transcriptomic changes along malignancy continuum.log2FC in expression of this searched gene in stem-like cells from each diseased tissue sample relative to stem-like cells in normal samples in each tissue plotted against the malignancy continuum. Samples are colored based on if they are from different disease stage.
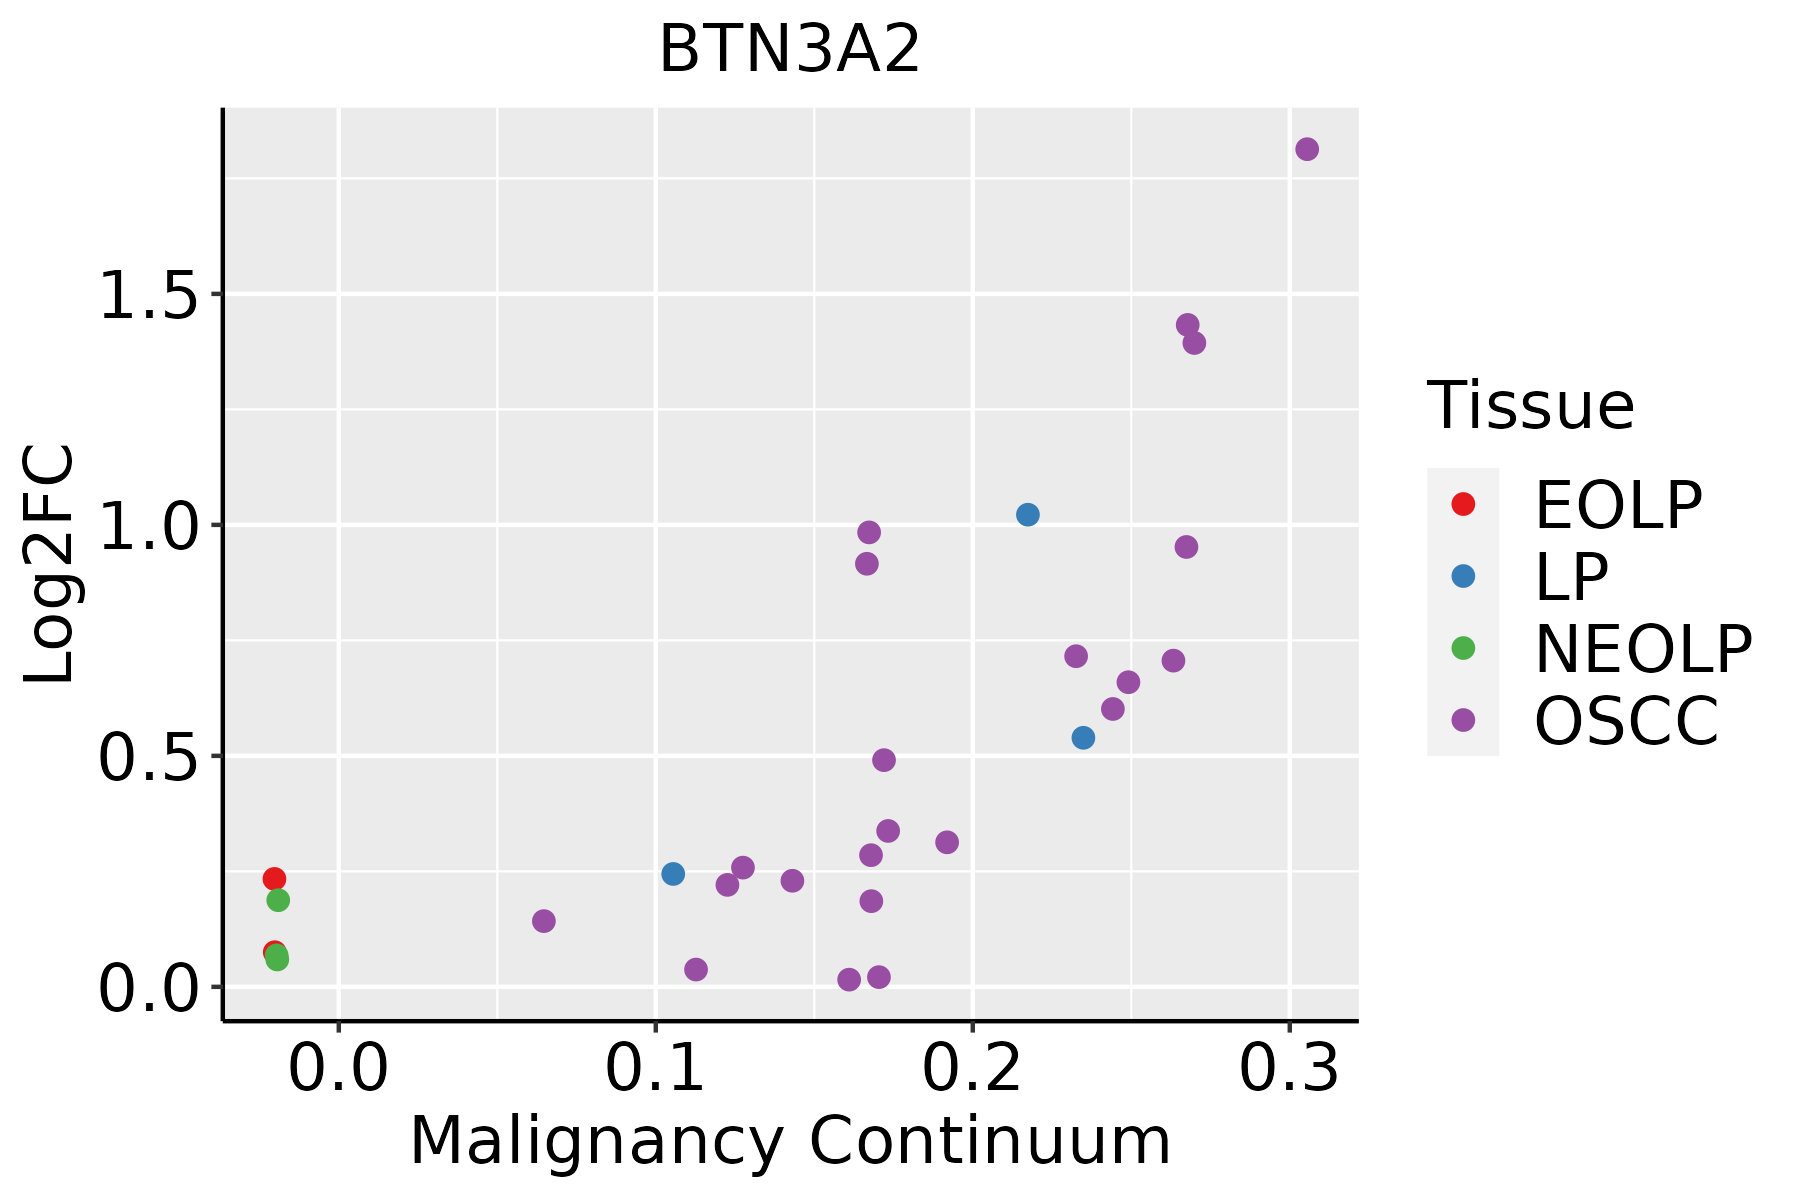
EOLP: Erosive Oral lichen planus
LP: leukoplakia
NEOLP: Non-erosive oral lichen planus
OSCC: Oral squamous cell carcinoma
SkinThe image shows the transcriptomic changes along malignancy continuum.log2FC in expression of this searched gene in stem-like cells from each diseased tissue sample relative to stem-like cells in normal samples in each tissue plotted against the malignancy continuum. Samples are colored based on if they are from different disease stage.
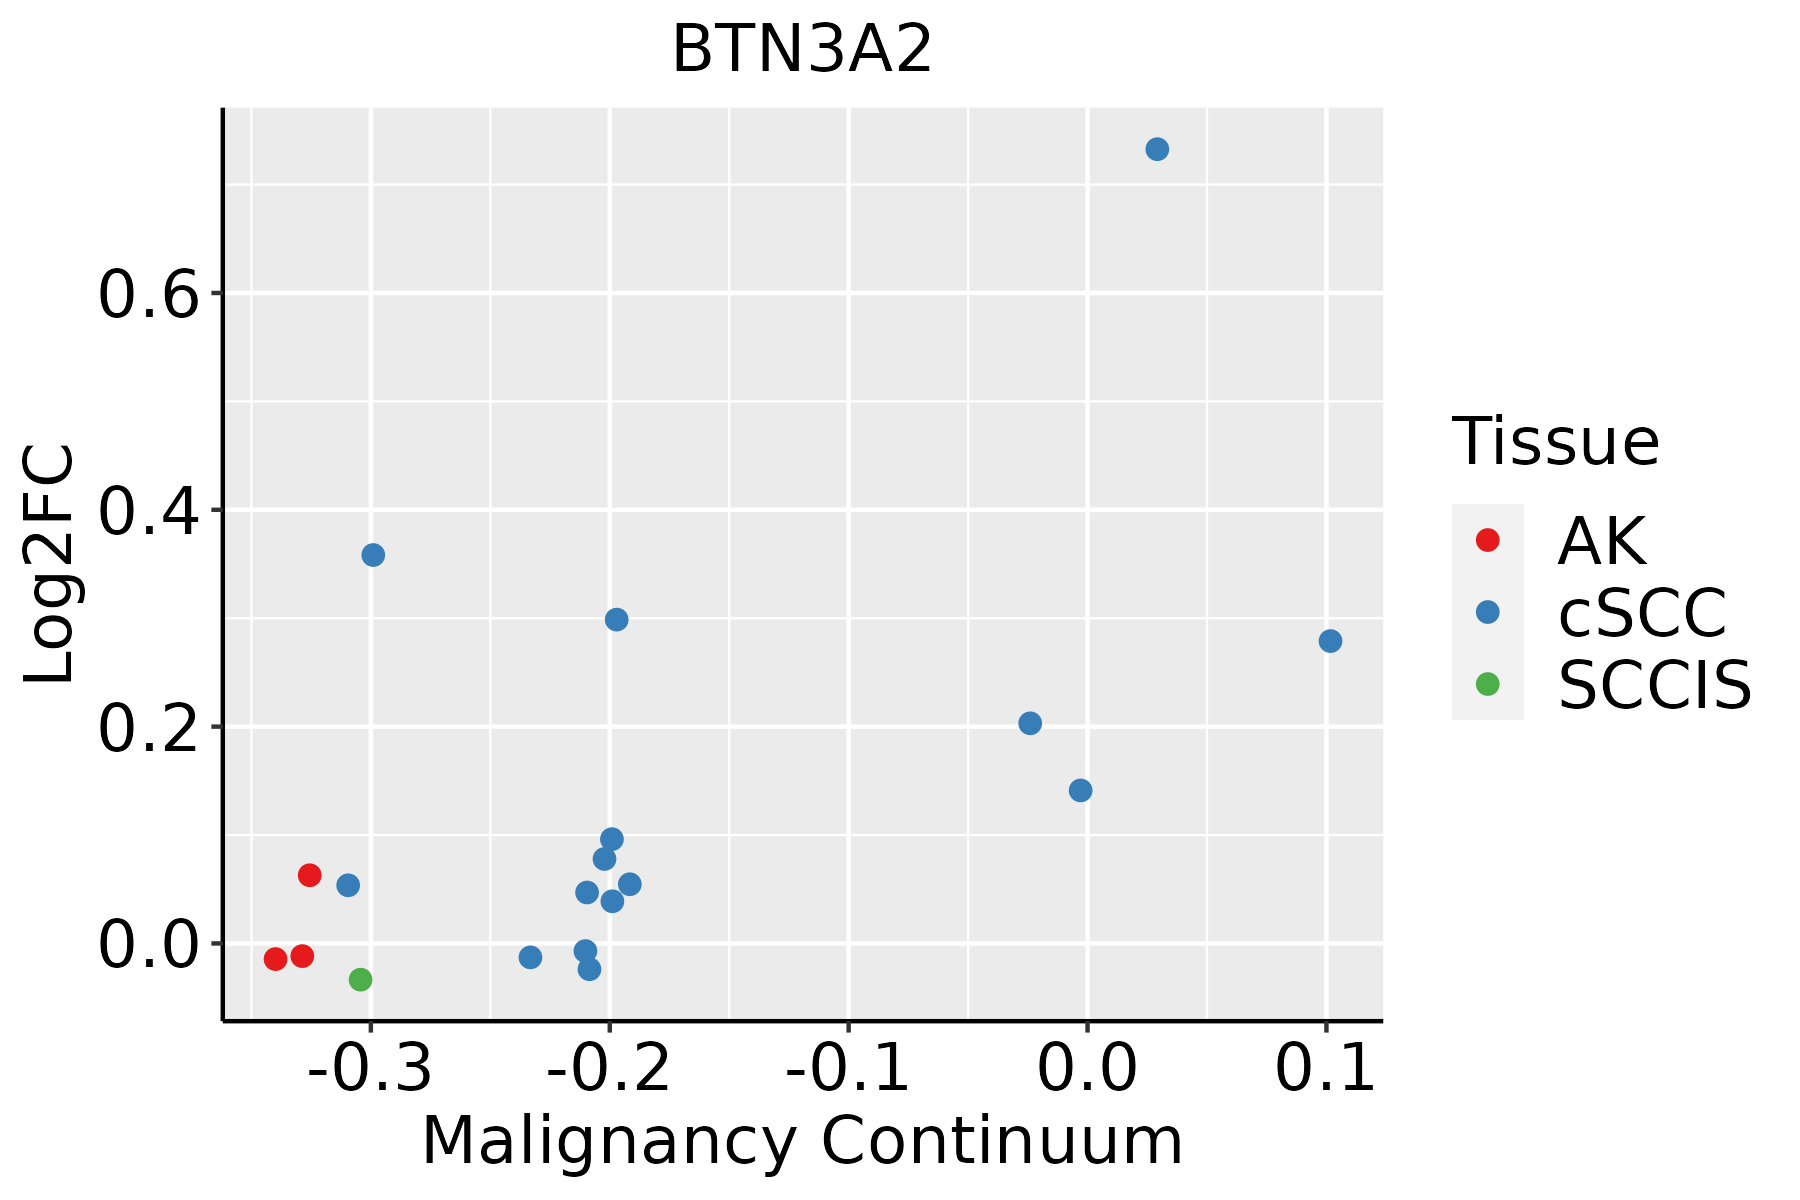
AK: Actinic keratosis
cSCC: Cutaneous squamous cell carcinoma
SCCIS:squamous cell carcinoma in situ
ThyroidThe image shows the transcriptomic changes along malignancy continuum.log2FC in expression of this searched gene in stem-like cells from each diseased tissue sample relative to stem-like cells in normal samples in each tissue plotted against the malignancy continuum. Samples are colored based on if they are from different disease stage.
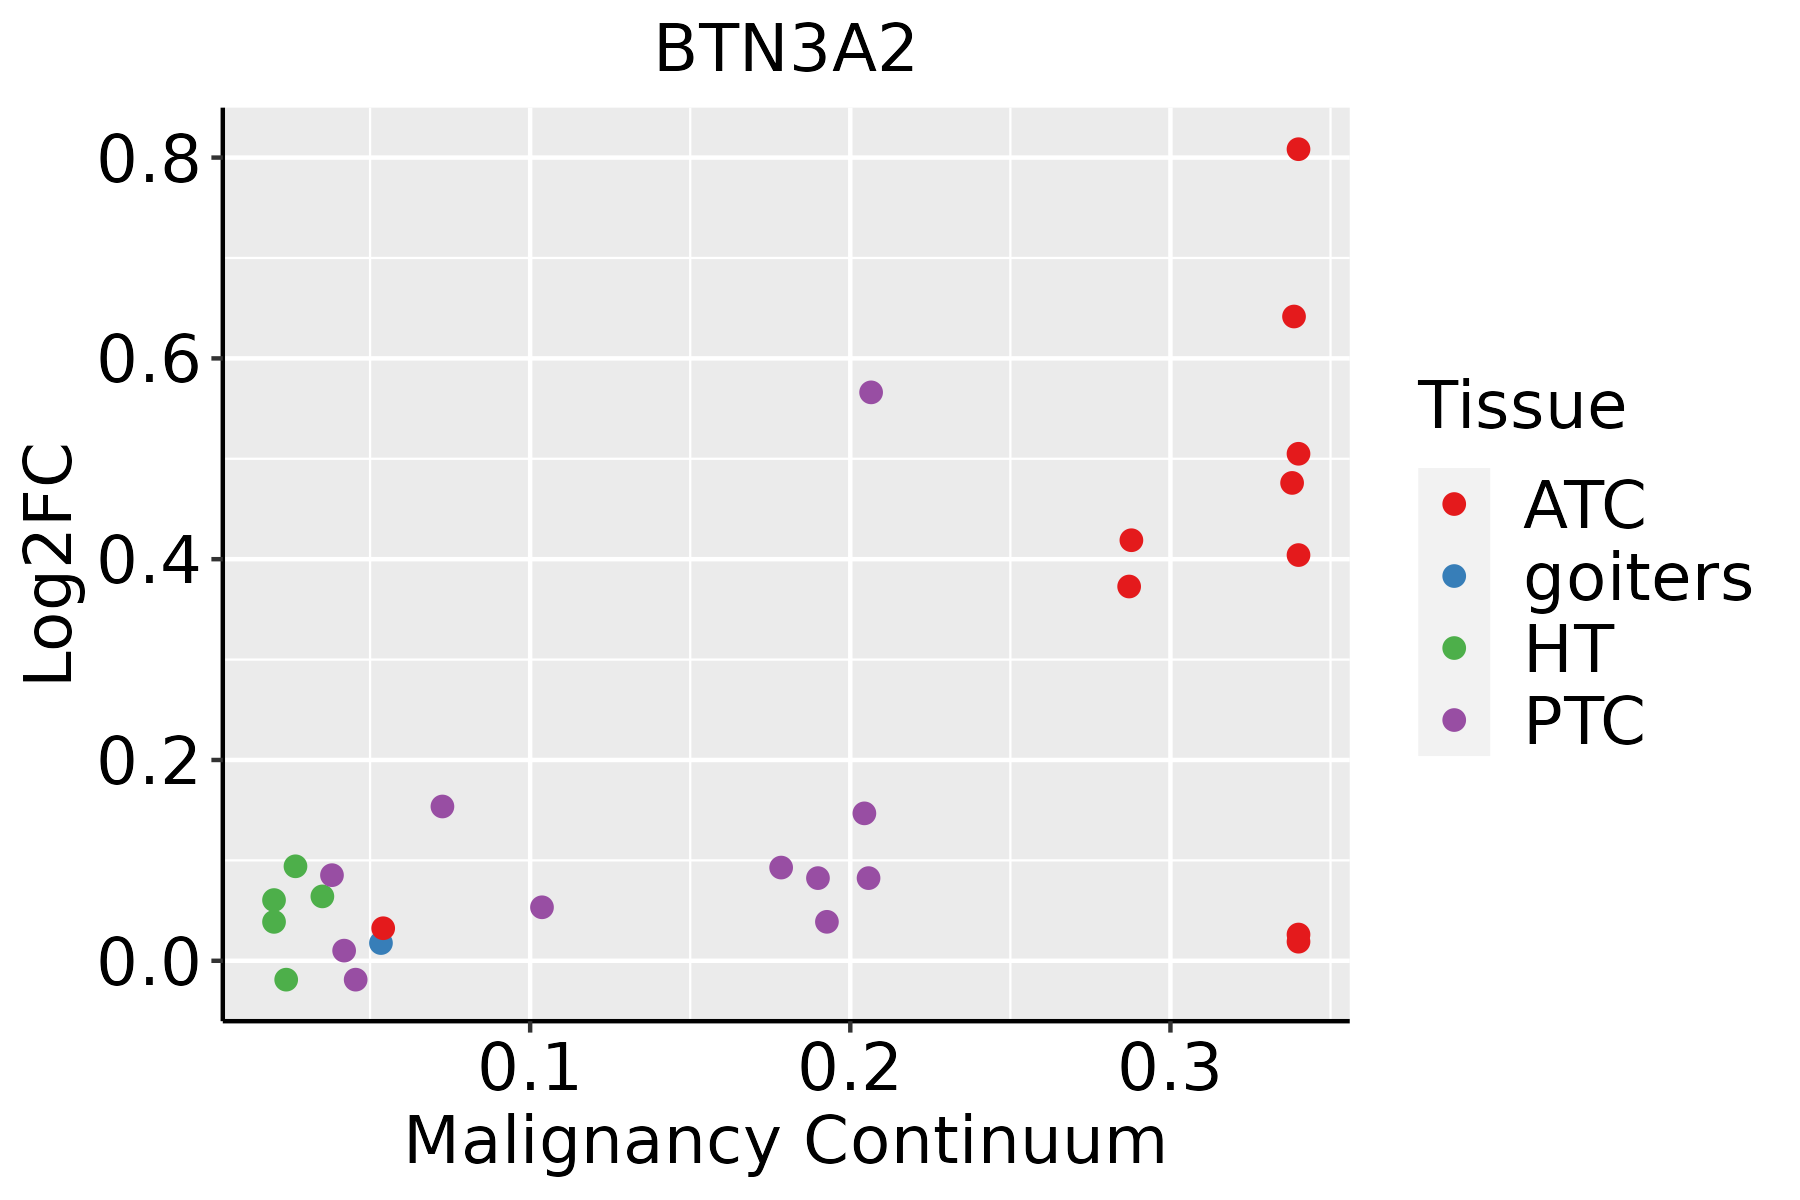
ATC: Anaplastic thyroid cancer
HT: Hashimoto's thyroiditis
PTC: Papillary thyroid cancer
∗log2FC in expression of this searched gene in stem-like cells from each diseased tissue sample relative to stem-like cells in normal samples in each tissue plotted against the malignancy continuum. Samples are colored based on if they are from different disease stage.

Top

Malignant transformation related pathway analysis

check buttonFind out the enriched GO biological processes and KEGG pathways involved in transition from healthy to precancer to cancer
check button Figure of enriched GO biological processes.
TissueDisease StageEnriched GO biological Processes
ColorectumADGO analysis - Figure of enriched GO biological processes: Top 15 enriched GO BP terms are showed in the bar plot of each disease state in each tissue. Each row represents a significant GO biological process which is colored according to the -log10(p.adjust).
ColorectumSERGO analysis - Figure of enriched GO biological processes: Top 15 enriched GO BP terms are showed in the bar plot of each disease state in each tissue. Each row represents a significant GO biological process which is colored according to the -log10(p.adjust).
ColorectumMSSGO analysis - Figure of enriched GO biological processes: Top 15 enriched GO BP terms are showed in the bar plot of each disease state in each tissue. Each row represents a significant GO biological process which is colored according to the -log10(p.adjust).
ColorectumMSI-HGO analysis - Figure of enriched GO biological processes: Top 15 enriched GO BP terms are showed in the bar plot of each disease state in each tissue. Each row represents a significant GO biological process which is colored according to the -log10(p.adjust).
ColorectumFAPGO analysis - Figure of enriched GO biological processes: Top 15 enriched GO BP terms are showed in the bar plot of each disease state in each tissue. Each row represents a significant GO biological process which is colored according to the -log10(p.adjust).
∗Top 15 enriched GO BP terms are showed in the bar plot of each disease state in each tissue. Each row represents a significant GO biological process which is colored according to the -log10(p.adjust).
Page: 1 2 3 4 5 6 7 8 9 

check button Enriched GO biological processes.
GO IDTissueDisease StageDescriptionGene RatioBg Ratiopvaluep.adjustCount
GO:00508528EsophagusESCCT cell receptor signaling pathway73/8552123/187231.54e-037.24e-0373
GO:000181916EsophagusESCCpositive regulation of cytokine production244/8552467/187232.29e-031.01e-02244
GO:00508527Oral cavityOSCCT cell receptor signaling pathway68/7305123/187231.80e-041.22e-0368
GO:000181910Oral cavityOSCCpositive regulation of cytokine production213/7305467/187231.93e-038.96e-03213
GO:00027646Oral cavityOSCCimmune response-regulating signaling pathway212/7305468/187232.93e-031.27e-02212
GO:000276413Oral cavityEOLPimmune response-regulating signaling pathway108/2218468/187234.04e-127.34e-10108
GO:00027683Oral cavityEOLPimmune response-regulating cell surface receptor signaling pathway66/2218315/187232.44e-065.45e-0566
GO:005085214Oral cavityEOLPT cell receptor signaling pathway33/2218123/187234.19e-068.76e-0533
GO:000181915Oral cavityEOLPpositive regulation of cytokine production87/2218467/187231.08e-051.92e-0487
GO:00024292Oral cavityEOLPimmune response-activating cell surface receptor signaling pathway60/2218291/187231.16e-052.00e-0460
GO:00027572Oral cavityEOLPimmune response-activating signal transduction60/2218291/187231.16e-052.00e-0460
GO:00022534Oral cavityEOLPactivation of immune response72/2218375/187232.18e-053.35e-0472
GO:00508514Oral cavityEOLPantigen receptor-mediated signaling pathway48/2218240/187231.79e-041.84e-0348
GO:00024433Oral cavityEOLPleukocyte mediated immunity73/2218440/187231.78e-031.16e-0273
GO:00024604Oral cavityEOLPadaptive immune response based on somatic recombination of immune receptors built from immunoglobulin superfamily domains58/2218356/187237.27e-033.52e-0258
GO:00024566Oral cavityEOLPT cell mediated immunity22/2218109/187238.31e-033.91e-0222
GO:005085221SkincSCCT cell receptor signaling pathway44/4864123/187231.02e-024.47e-0244
GO:005085210ThyroidPTCT cell receptor signaling pathway52/5968123/187239.58e-033.93e-0252
GO:000181924ThyroidATCpositive regulation of cytokine production189/6293467/187231.00e-035.31e-03189
Page: 1 

check button Enriched KEGG pathways.
Pathway IDTissueDisease StageDescriptionGene RatioBg Ratiopvaluep.adjustqvalueCount
Page: 1 

Top

Cell-cell communication analysis

check buttonIdentification of potential cell-cell interactions between two cell types and their ligand-receptor pairs for different disease states
LigandReceptorLRpairPathwayTissueDisease Stage
Page: 1 

Top

Single-cell gene regulatory network inference analysis

check buttonFind out the significant the regulons (TFs) and the target genes of each regulon across cell types for different disease states
TFCell TypeTissueDisease StageTarget GeneRSSRegulon Activity
∗The dot plots of a searched regulon are shown for all cell subpopulations in each disease state of each tissue based on the regulon specific score inferred using pySCENIC and by calculating the average expression.
Page: 1 

Top

Somatic mutation of malignant transformation related genes

check buttonAnnotation of somatic variants for genes involved in malignant transformation
Hugo SymbolVariant ClassVariant ClassificationdbSNP RSHGVScHGVSpHGVSp ShortSWISSPROTBIOTYPESIFTPolyPhenTumor Sample BarcodeTissueHistologySexAgeStageTherapy TypesDrugsOutcome
BTN3A2SNVMissense_Mutationrs774256825c.457N>Ap.Glu153Lysp.E153KP78410protein_codingdeleterious(0.02)benign(0.207)TCGA-A8-A09Q-01Breastbreast invasive carcinomaFemale>=65III/IVHormone TherapyanastrozoleSD
BTN3A2SNVMissense_Mutationc.183N>Cp.Glu61Aspp.E61DP78410protein_codingdeleterious(0)probably_damaging(0.996)TCGA-B6-A0IJ-01Breastbreast invasive carcinomaFemale<65I/IIUnknownUnknownSD
BTN3A2SNVMissense_Mutationnovelc.475G>Ap.Asp159Asnp.D159NP78410protein_codingtolerated(0.28)benign(0.001)TCGA-BH-A0DK-01Breastbreast invasive carcinomaFemale<65I/IIHormone TherapytamoxiphenSD
BTN3A2SNVMissense_Mutationnovelc.206N>Cp.Ser69Thrp.S69TP78410protein_codingdeleterious(0)possibly_damaging(0.608)TCGA-BH-A0H9-01Breastbreast invasive carcinomaFemale>=65I/IIHormone TherapyarimidexSD
BTN3A2SNVMissense_Mutationc.815N>Cp.Arg272Thrp.R272TP78410protein_codingdeleterious(0.03)benign(0.156)TCGA-C8-A27B-01Breastbreast invasive carcinomaFemale<65I/IIChemotherapy5-fluorouracilCR
BTN3A2SNVMissense_Mutationnovelc.527A>Cp.Gln176Prop.Q176PP78410protein_codingdeleterious(0.01)possibly_damaging(0.469)TCGA-E2-A1LB-01Breastbreast invasive carcinomaFemale<65I/IIChemotherapycytoxanSD
BTN3A2SNVMissense_Mutationrs766201604c.551G>Ap.Gly184Glup.G184EP78410protein_codingdeleterious(0.01)probably_damaging(0.976)TCGA-C5-A2LZ-01Cervixcervical & endocervical cancerFemale>=65III/IVUnknownUnknownPD
BTN3A2SNVMissense_Mutationrs376441641c.985G>Ap.Asp329Asnp.D329NP78410protein_codingtolerated_low_confidence(0.24)benign(0)TCGA-MY-A5BF-01Cervixcervical & endocervical cancerFemale>=65I/IIChemotherapycisplatinCR
BTN3A2SNVMissense_Mutationnovelc.781N>Gp.Leu261Valp.L261VP78410protein_codingtolerated(0.08)benign(0.006)TCGA-AA-3520-01Colorectumcolon adenocarcinomaFemale>=65I/IIUnknownUnknownSD
BTN3A2SNVMissense_Mutationrs376441641c.985G>Ap.Asp329Asnp.D329NP78410protein_codingtolerated_low_confidence(0.24)benign(0)TCGA-AA-A01R-01Colorectumcolon adenocarcinomaMale<65III/IVChemotherapy5-fluorouracilPD
Page: 1 2 3 4 5 6 

Top

Related drugs of malignant transformation related genes

check buttonIdentification of chemicals and drugs interact with genes involved in malignant transfromation
(DGIdb 4.0)
Entrez IDSymbolCategoryInteraction TypesDrug Claim NameDrug NamePMIDs
Page: 1