
|
|||||
|
 | |
| |
| |
| |
| |
| |
|
Gene: BTN3A1 |
Gene summary for BTN3A1 |
| Gene information | Species | Human | Gene symbol | BTN3A1 | Gene ID | 11119 |
| Gene name | butyrophilin subfamily 3 member A1 | |
| Gene Alias | BT3.1 | |
| Cytomap | 6p22.2 | |
| Gene Type | protein-coding | GO ID | GO:0001775 | UniProtAcc | O00481 |
Top |
Malignant transformation analysis |
| Identification of the aberrant gene expression in precancerous and cancerous lesions by comparing the gene expression of stem-like cells in diseased tissues with normal stem cells |
| Entrez ID | Symbol | Replicates | Species | Organ | Tissue | Adj P-value | Log2FC | Malignancy |
| 11119 | BTN3A1 | LZE4T | Human | Esophagus | ESCC | 3.80e-04 | 1.25e-01 | 0.0811 |
| 11119 | BTN3A1 | LZE20T | Human | Esophagus | ESCC | 1.28e-03 | 1.27e-01 | 0.0662 |
| 11119 | BTN3A1 | LZE24T | Human | Esophagus | ESCC | 2.02e-16 | 5.29e-01 | 0.0596 |
| 11119 | BTN3A1 | P2T-E | Human | Esophagus | ESCC | 7.17e-25 | 4.03e-01 | 0.1177 |
| 11119 | BTN3A1 | P4T-E | Human | Esophagus | ESCC | 2.18e-05 | 1.12e-01 | 0.1323 |
| 11119 | BTN3A1 | P5T-E | Human | Esophagus | ESCC | 1.03e-02 | 2.54e-02 | 0.1327 |
| 11119 | BTN3A1 | P8T-E | Human | Esophagus | ESCC | 1.40e-17 | 2.07e-01 | 0.0889 |
| 11119 | BTN3A1 | P9T-E | Human | Esophagus | ESCC | 1.07e-12 | 1.64e-01 | 0.1131 |
| 11119 | BTN3A1 | P11T-E | Human | Esophagus | ESCC | 7.72e-11 | 3.77e-01 | 0.1426 |
| 11119 | BTN3A1 | P12T-E | Human | Esophagus | ESCC | 1.01e-06 | 4.59e-02 | 0.1122 |
| 11119 | BTN3A1 | P15T-E | Human | Esophagus | ESCC | 1.31e-03 | 7.94e-02 | 0.1149 |
| 11119 | BTN3A1 | P16T-E | Human | Esophagus | ESCC | 1.66e-07 | 9.78e-02 | 0.1153 |
| 11119 | BTN3A1 | P17T-E | Human | Esophagus | ESCC | 7.16e-05 | 1.53e-01 | 0.1278 |
| 11119 | BTN3A1 | P21T-E | Human | Esophagus | ESCC | 2.01e-15 | 2.09e-01 | 0.1617 |
| 11119 | BTN3A1 | P22T-E | Human | Esophagus | ESCC | 5.68e-07 | 1.24e-01 | 0.1236 |
| 11119 | BTN3A1 | P23T-E | Human | Esophagus | ESCC | 5.55e-07 | 1.91e-01 | 0.108 |
| 11119 | BTN3A1 | P24T-E | Human | Esophagus | ESCC | 6.77e-10 | 2.65e-01 | 0.1287 |
| 11119 | BTN3A1 | P26T-E | Human | Esophagus | ESCC | 1.16e-11 | 1.20e-01 | 0.1276 |
| 11119 | BTN3A1 | P27T-E | Human | Esophagus | ESCC | 9.56e-16 | 1.52e-01 | 0.1055 |
| 11119 | BTN3A1 | P28T-E | Human | Esophagus | ESCC | 6.52e-03 | 6.25e-02 | 0.1149 |
| Page: 1 2 3 4 |
| Tissue | Expression Dynamics | Abbreviation |
| Esophagus | 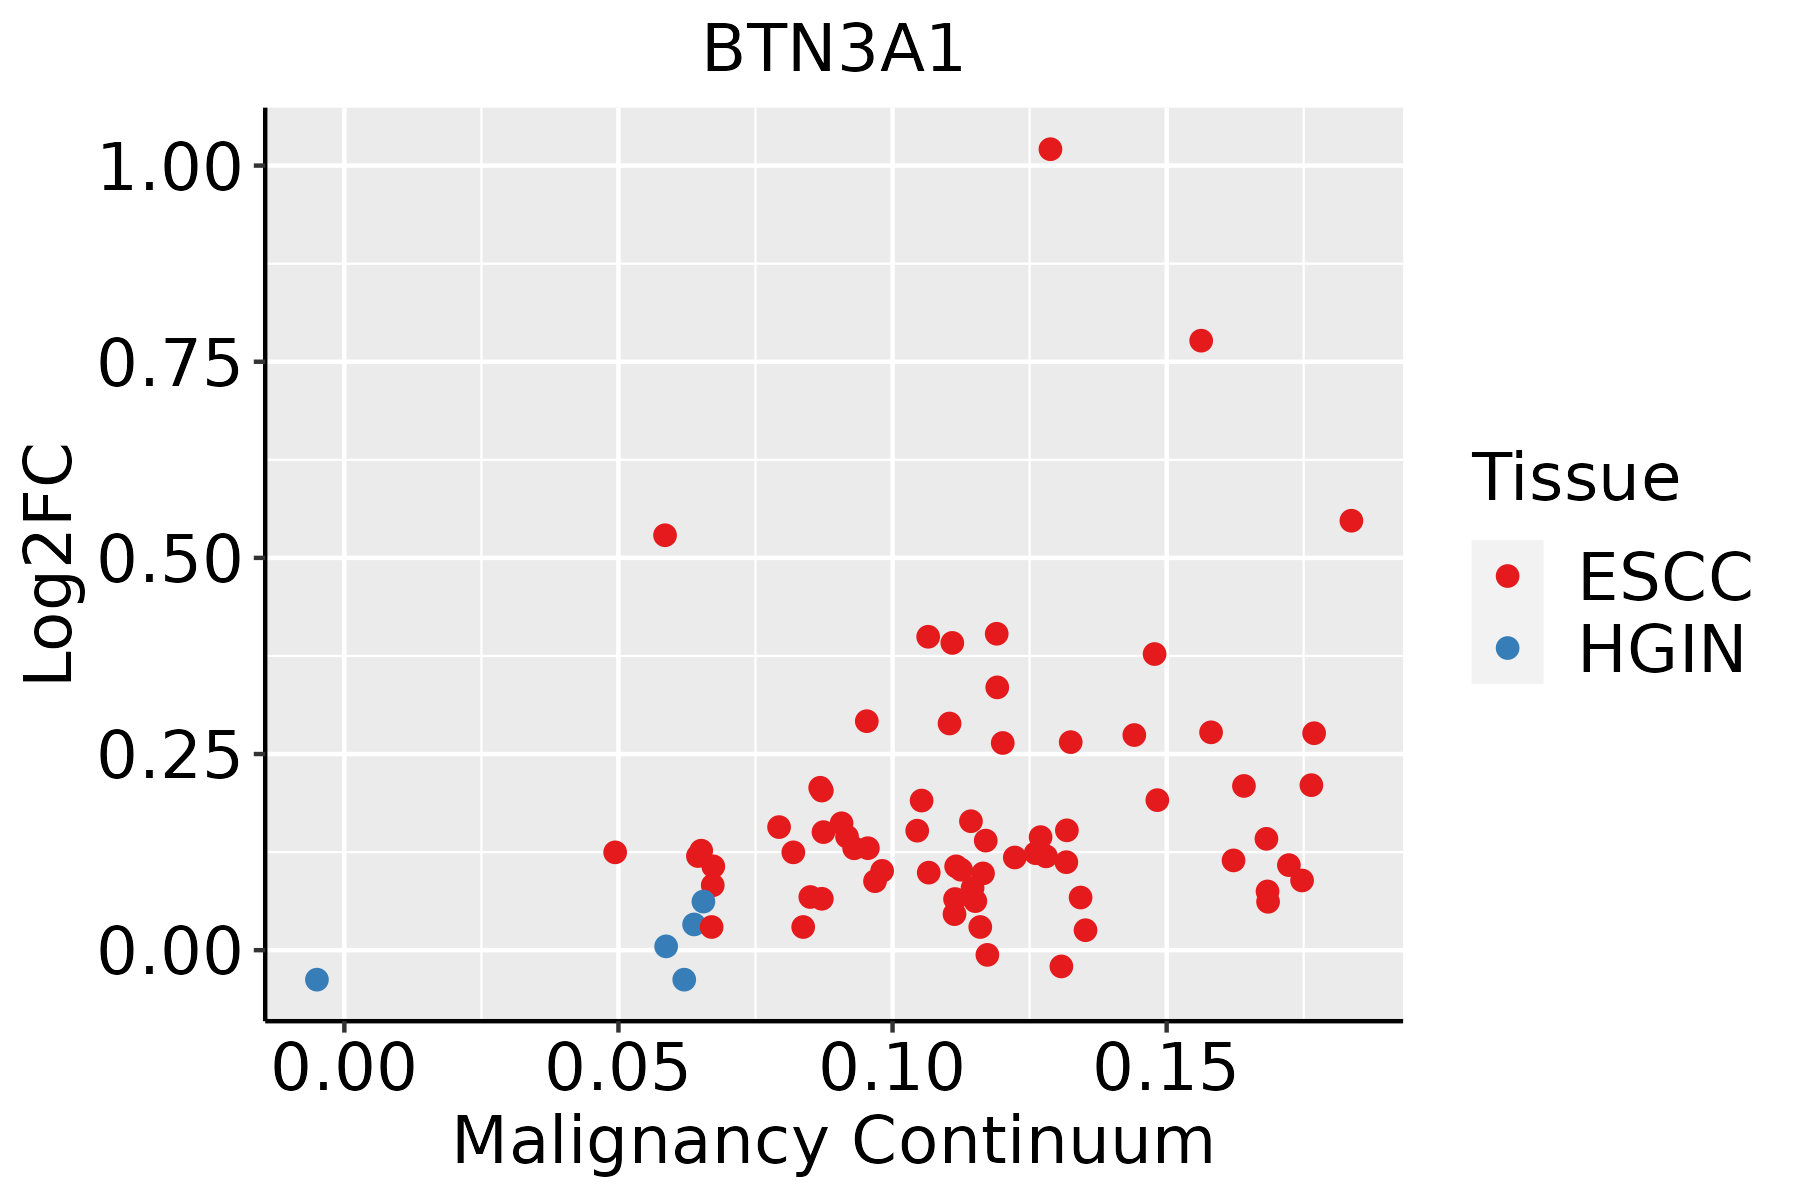 | ESCC: Esophageal squamous cell carcinoma |
| HGIN: High-grade intraepithelial neoplasias | ||
| LGIN: Low-grade intraepithelial neoplasias | ||
| Oral Cavity | 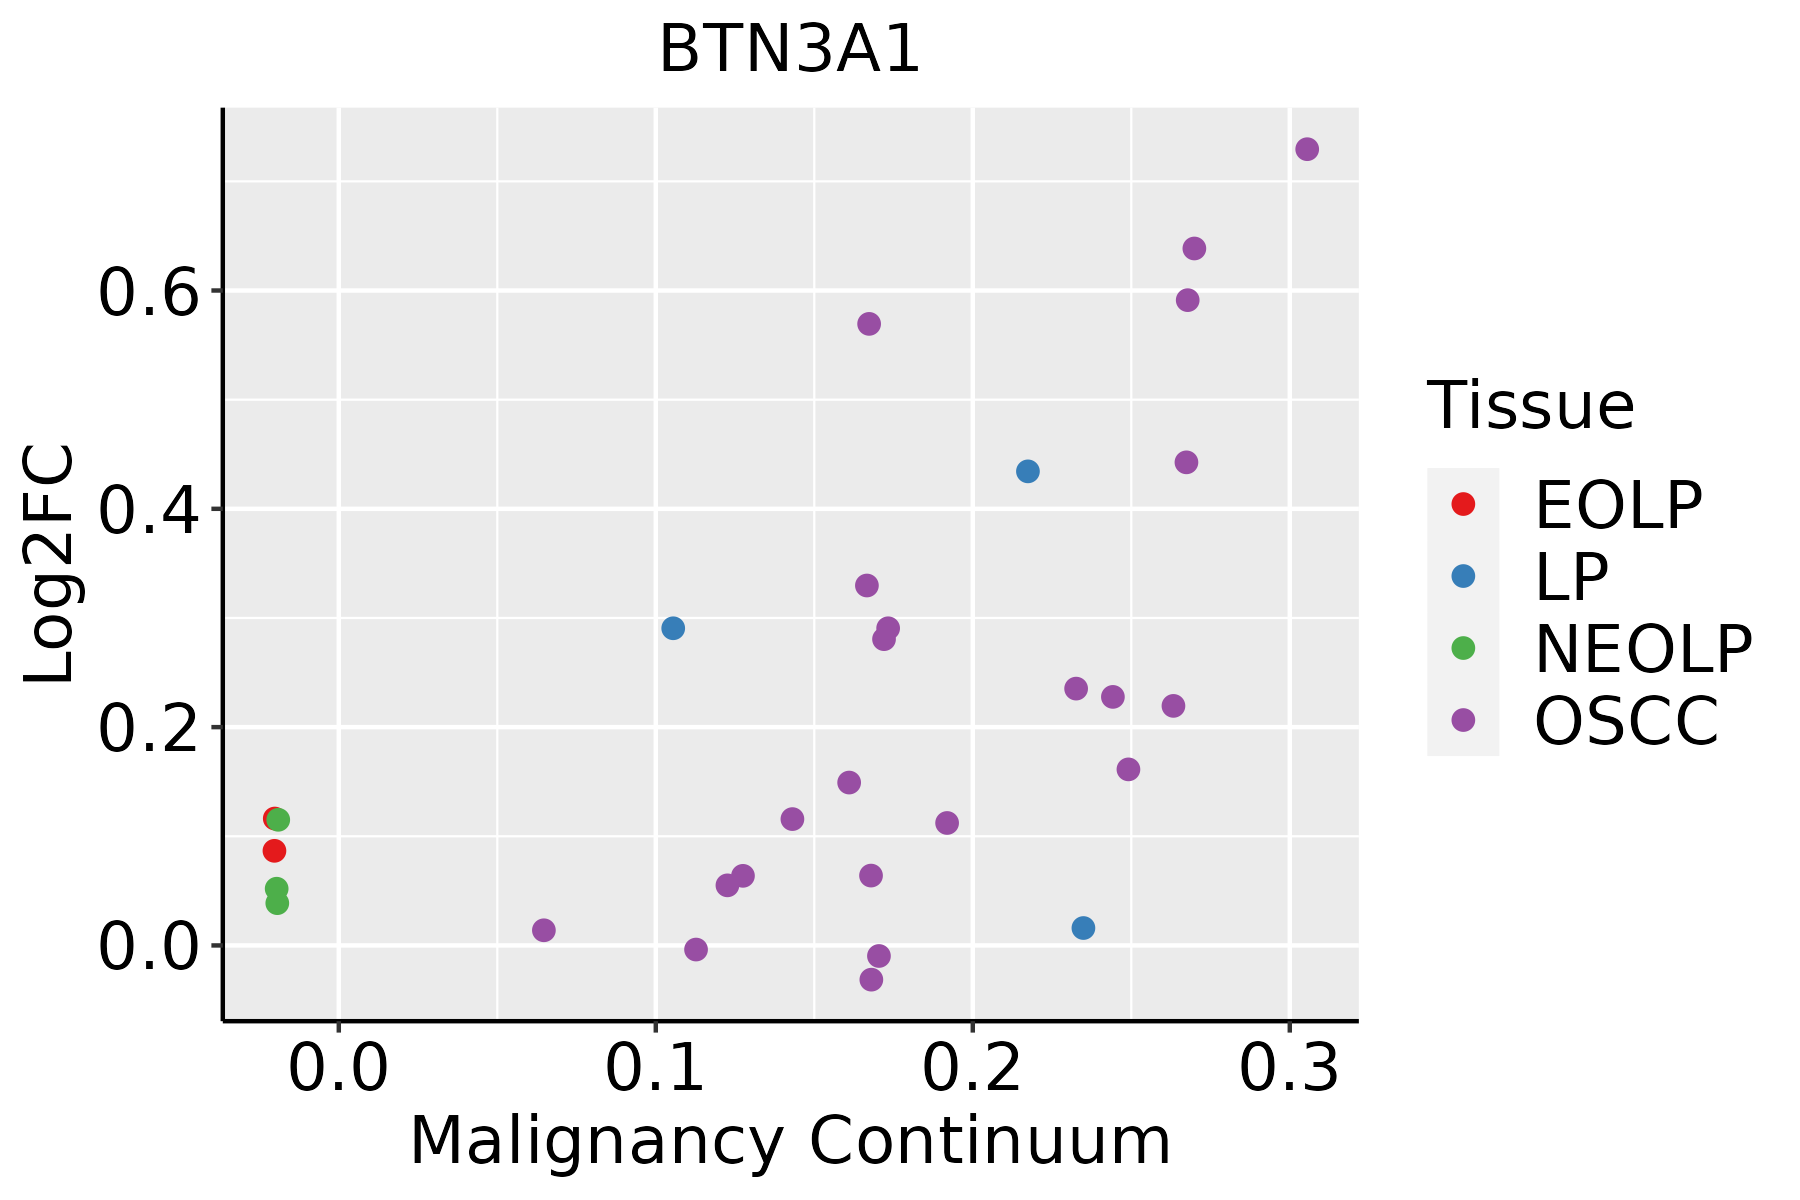 | EOLP: Erosive Oral lichen planus |
| LP: leukoplakia | ||
| NEOLP: Non-erosive oral lichen planus | ||
| OSCC: Oral squamous cell carcinoma | ||
| Prostate | 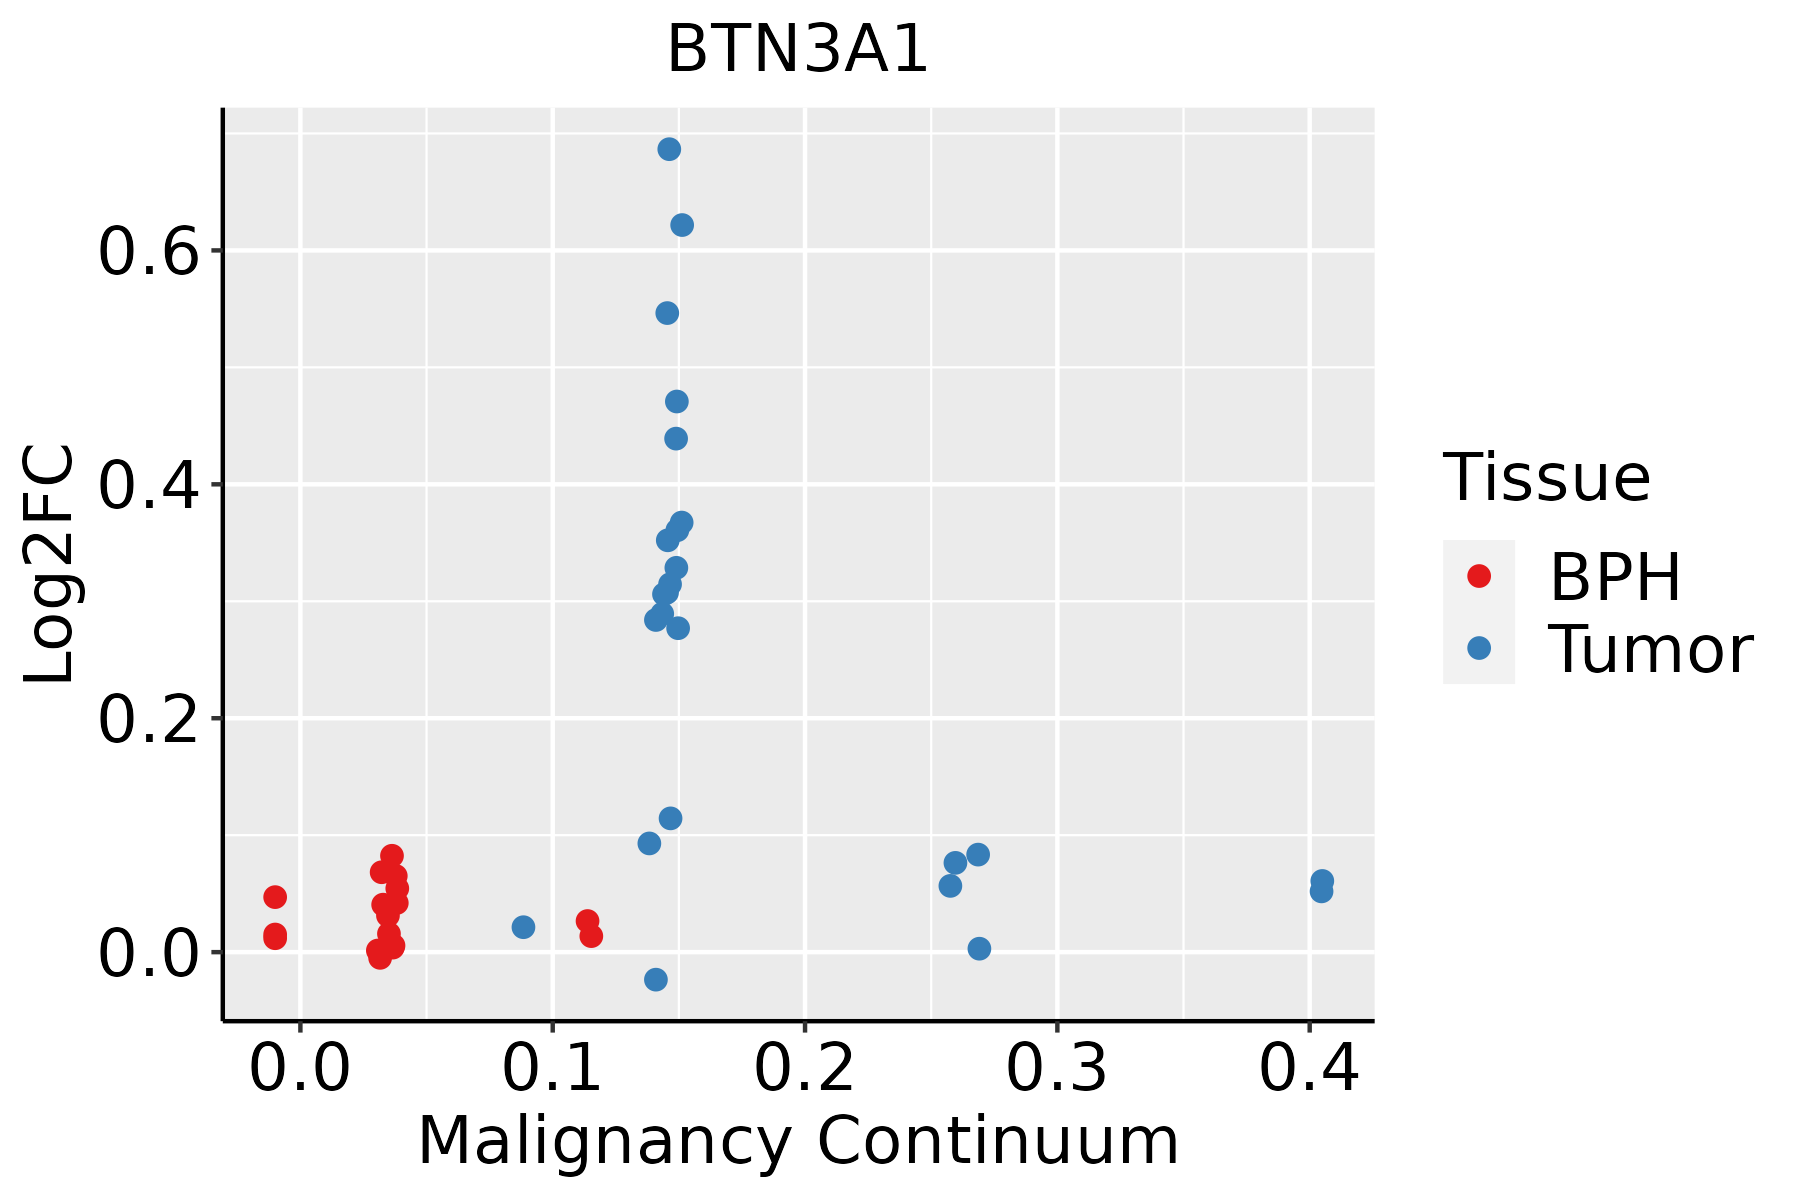 | BPH: Benign Prostatic Hyperplasia |
| ∗log2FC in expression of this searched gene in stem-like cells from each diseased tissue sample relative to stem-like cells in normal samples in each tissue plotted against the malignancy continuum. Samples are colored based on if they are from different disease stage. |
Top |
Malignant transformation related pathway analysis |
| Find out the enriched GO biological processes and KEGG pathways involved in transition from healthy to precancer to cancer |
| Tissue | Disease Stage | Enriched GO biological Processes |
| Colorectum | AD |  |
| Colorectum | SER |  |
| Colorectum | MSS |  |
| Colorectum | MSI-H |  |
| Colorectum | FAP |  |
| ∗Top 15 enriched GO BP terms are showed in the bar plot of each disease state in each tissue. Each row represents a significant GO biological process which is colored according to the -log10(p.adjust). |
| Page: 1 2 3 4 5 6 7 8 9 |
| GO ID | Tissue | Disease Stage | Description | Gene Ratio | Bg Ratio | pvalue | p.adjust | Count |
| GO:004211018 | Esophagus | ESCC | T cell activation | 256/8552 | 487/18723 | 1.18e-03 | 5.87e-03 | 256 |
| GO:00508528 | Esophagus | ESCC | T cell receptor signaling pathway | 73/8552 | 123/18723 | 1.54e-03 | 7.24e-03 | 73 |
| GO:000181916 | Esophagus | ESCC | positive regulation of cytokine production | 244/8552 | 467/18723 | 2.29e-03 | 1.01e-02 | 244 |
| GO:004211016 | Oral cavity | OSCC | T cell activation | 245/7305 | 487/18723 | 2.00e-07 | 3.22e-06 | 245 |
| GO:00508527 | Oral cavity | OSCC | T cell receptor signaling pathway | 68/7305 | 123/18723 | 1.80e-04 | 1.22e-03 | 68 |
| GO:004209816 | Oral cavity | OSCC | T cell proliferation | 100/7305 | 199/18723 | 7.93e-04 | 4.27e-03 | 100 |
| GO:000181910 | Oral cavity | OSCC | positive regulation of cytokine production | 213/7305 | 467/18723 | 1.93e-03 | 8.96e-03 | 213 |
| GO:00027646 | Oral cavity | OSCC | immune response-regulating signaling pathway | 212/7305 | 468/18723 | 2.93e-03 | 1.27e-02 | 212 |
| GO:00706618 | Oral cavity | OSCC | leukocyte proliferation | 145/7305 | 318/18723 | 9.31e-03 | 3.33e-02 | 145 |
| GO:00466517 | Oral cavity | OSCC | lymphocyte proliferation | 131/7305 | 288/18723 | 1.41e-02 | 4.67e-02 | 131 |
| GO:004211017 | Oral cavity | LP | T cell activation | 146/4623 | 487/18723 | 4.13e-03 | 2.66e-02 | 146 |
| GO:000276413 | Oral cavity | EOLP | immune response-regulating signaling pathway | 108/2218 | 468/18723 | 4.04e-12 | 7.34e-10 | 108 |
| GO:004211023 | Oral cavity | EOLP | T cell activation | 111/2218 | 487/18723 | 4.67e-12 | 8.17e-10 | 111 |
| GO:00027683 | Oral cavity | EOLP | immune response-regulating cell surface receptor signaling pathway | 66/2218 | 315/18723 | 2.44e-06 | 5.45e-05 | 66 |
| GO:005085214 | Oral cavity | EOLP | T cell receptor signaling pathway | 33/2218 | 123/18723 | 4.19e-06 | 8.76e-05 | 33 |
| GO:007066112 | Oral cavity | EOLP | leukocyte proliferation | 65/2218 | 318/18723 | 6.86e-06 | 1.33e-04 | 65 |
| GO:000181915 | Oral cavity | EOLP | positive regulation of cytokine production | 87/2218 | 467/18723 | 1.08e-05 | 1.92e-04 | 87 |
| GO:00024292 | Oral cavity | EOLP | immune response-activating cell surface receptor signaling pathway | 60/2218 | 291/18723 | 1.16e-05 | 2.00e-04 | 60 |
| GO:00027572 | Oral cavity | EOLP | immune response-activating signal transduction | 60/2218 | 291/18723 | 1.16e-05 | 2.00e-04 | 60 |
| GO:00022534 | Oral cavity | EOLP | activation of immune response | 72/2218 | 375/18723 | 2.18e-05 | 3.35e-04 | 72 |
| Page: 1 2 |
| Pathway ID | Tissue | Disease Stage | Description | Gene Ratio | Bg Ratio | pvalue | p.adjust | qvalue | Count |
| Page: 1 |
Top |
Cell-cell communication analysis |
| Identification of potential cell-cell interactions between two cell types and their ligand-receptor pairs for different disease states |
| Ligand | Receptor | LRpair | Pathway | Tissue | Disease Stage |
| Page: 1 |
Top |
Single-cell gene regulatory network inference analysis |
| Find out the significant the regulons (TFs) and the target genes of each regulon across cell types for different disease states |
| TF | Cell Type | Tissue | Disease Stage | Target Gene | RSS | Regulon Activity |
| ∗The dot plots of a searched regulon are shown for all cell subpopulations in each disease state of each tissue based on the regulon specific score inferred using pySCENIC and by calculating the average expression. |
| Page: 1 |
Top |
Somatic mutation of malignant transformation related genes |
| Annotation of somatic variants for genes involved in malignant transformation |
| Hugo Symbol | Variant Class | Variant Classification | dbSNP RS | HGVSc | HGVSp | HGVSp Short | SWISSPROT | BIOTYPE | SIFT | PolyPhen | Tumor Sample Barcode | Tissue | Histology | Sex | Age | Stage | Therapy Types | Drugs | Outcome |
| BTN3A1 | SNV | Missense_Mutation | c.944N>T | p.Arg315Ile | p.R315I | O00481 | protein_coding | deleterious(0.02) | benign(0.003) | TCGA-A2-A25A-01 | Breast | breast invasive carcinoma | Female | <65 | I/II | Unspecific | Cytoxan | SD | |
| BTN3A1 | SNV | Missense_Mutation | novel | c.100N>T | p.Leu34Phe | p.L34F | O00481 | protein_coding | tolerated(0.06) | possibly_damaging(0.812) | TCGA-AN-A0AK-01 | Breast | breast invasive carcinoma | Female | >=65 | I/II | Unknown | Unknown | SD |
| BTN3A1 | SNV | Missense_Mutation | c.139G>C | p.Asp47His | p.D47H | O00481 | protein_coding | deleterious(0.01) | probably_damaging(0.979) | TCGA-BH-A0AW-01 | Breast | breast invasive carcinoma | Female | <65 | I/II | Chemotherapy | carboplatin | SD | |
| BTN3A1 | SNV | Missense_Mutation | c.206N>C | p.Ser69Thr | p.S69T | O00481 | protein_coding | deleterious(0) | possibly_damaging(0.527) | TCGA-BH-A0H9-01 | Breast | breast invasive carcinoma | Female | >=65 | I/II | Hormone Therapy | arimidex | SD | |
| BTN3A1 | SNV | Missense_Mutation | c.802N>G | p.Tyr268Asp | p.Y268D | O00481 | protein_coding | tolerated(0.07) | benign(0.272) | TCGA-E2-A15S-01 | Breast | breast invasive carcinoma | Female | <65 | I/II | Chemotherapy | doxorubicin | SD | |
| BTN3A1 | insertion | Frame_Shift_Ins | novel | c.381_382insAATAATTA | p.Phe128AsnfsTer17 | p.F128Nfs*17 | O00481 | protein_coding | TCGA-B6-A0IB-01 | Breast | breast invasive carcinoma | Female | <65 | III/IV | Unknown | Unknown | PD | ||
| BTN3A1 | deletion | Frame_Shift_Del | rs35139329 | c.833delA | p.Lys278ArgfsTer13 | p.K278Rfs*13 | O00481 | protein_coding | TCGA-BH-A0HA-01 | Breast | breast invasive carcinoma | Female | <65 | I/II | Unknown | Unknown | SD | ||
| BTN3A1 | deletion | Frame_Shift_Del | novel | c.1375delN | p.Val460TrpfsTer42 | p.V460Wfs*42 | O00481 | protein_coding | TCGA-PL-A8LY-01 | Breast | breast invasive carcinoma | Female | <65 | I/II | Unknown | Unknown | SD | ||
| BTN3A1 | SNV | Missense_Mutation | rs754276670 | c.682G>A | p.Gly228Ser | p.G228S | O00481 | protein_coding | tolerated(0.33) | benign(0.02) | TCGA-EA-A410-01 | Cervix | cervical & endocervical cancer | Female | <65 | I/II | Unknown | Unknown | SD |
| BTN3A1 | SNV | Missense_Mutation | c.974G>C | p.Arg325Thr | p.R325T | O00481 | protein_coding | deleterious(0.02) | benign(0.026) | TCGA-Q1-A73O-01 | Cervix | cervical & endocervical cancer | Female | <65 | I/II | Chemotherapy | cisplatin | CR |
| Page: 1 2 3 4 5 6 |
Top |
Related drugs of malignant transformation related genes |
| Identification of chemicals and drugs interact with genes involved in malignant transfromation |
| (DGIdb 4.0) |
| Entrez ID | Symbol | Category | Interaction Types | Drug Claim Name | Drug Name | PMIDs |
| 11119 | BTN3A1 | EXTERNAL SIDE OF PLASMA MEMBRANE, DRUGGABLE GENOME, B30_2 SPRY DOMAIN | 340590246 |
| Page: 1 |

Copyright 2023-Present -The University of Texas Health Science Center at Houston |