
|
|||||
|
 | |
| |
| |
| |
| |
| |
|
Gene: BTN2A2 |
Gene summary for BTN2A2 |
| Gene information | Species | Human | Gene symbol | BTN2A2 | Gene ID | 10385 |
| Gene name | butyrophilin subfamily 2 member A2 | |
| Gene Alias | BT2.2 | |
| Cytomap | 6p22.2 | |
| Gene Type | protein-coding | GO ID | GO:0001775 | UniProtAcc | A0A024R038 |
Top |
Malignant transformation analysis |
| Identification of the aberrant gene expression in precancerous and cancerous lesions by comparing the gene expression of stem-like cells in diseased tissues with normal stem cells |
| Entrez ID | Symbol | Replicates | Species | Organ | Tissue | Adj P-value | Log2FC | Malignancy |
| 10385 | BTN2A2 | LZE4T | Human | Esophagus | ESCC | 2.18e-06 | 2.24e-01 | 0.0811 |
| 10385 | BTN2A2 | LZE24T | Human | Esophagus | ESCC | 3.17e-06 | 1.69e-01 | 0.0596 |
| 10385 | BTN2A2 | LZE6T | Human | Esophagus | ESCC | 2.96e-03 | 1.63e-01 | 0.0845 |
| 10385 | BTN2A2 | P2T-E | Human | Esophagus | ESCC | 3.75e-37 | 6.92e-01 | 0.1177 |
| 10385 | BTN2A2 | P4T-E | Human | Esophagus | ESCC | 6.14e-11 | 2.52e-01 | 0.1323 |
| 10385 | BTN2A2 | P8T-E | Human | Esophagus | ESCC | 2.44e-04 | 9.75e-02 | 0.0889 |
| 10385 | BTN2A2 | P10T-E | Human | Esophagus | ESCC | 2.93e-08 | 1.28e-01 | 0.116 |
| 10385 | BTN2A2 | P11T-E | Human | Esophagus | ESCC | 6.74e-09 | 3.13e-01 | 0.1426 |
| 10385 | BTN2A2 | P12T-E | Human | Esophagus | ESCC | 5.09e-09 | 1.88e-01 | 0.1122 |
| 10385 | BTN2A2 | P15T-E | Human | Esophagus | ESCC | 1.31e-02 | 9.05e-02 | 0.1149 |
| 10385 | BTN2A2 | P16T-E | Human | Esophagus | ESCC | 1.95e-15 | 2.64e-01 | 0.1153 |
| 10385 | BTN2A2 | P21T-E | Human | Esophagus | ESCC | 1.81e-18 | 3.02e-01 | 0.1617 |
| 10385 | BTN2A2 | P22T-E | Human | Esophagus | ESCC | 2.06e-02 | 7.21e-02 | 0.1236 |
| 10385 | BTN2A2 | P23T-E | Human | Esophagus | ESCC | 1.14e-03 | 1.18e-01 | 0.108 |
| 10385 | BTN2A2 | P24T-E | Human | Esophagus | ESCC | 1.36e-09 | 1.38e-01 | 0.1287 |
| 10385 | BTN2A2 | P26T-E | Human | Esophagus | ESCC | 4.16e-11 | 1.13e-01 | 0.1276 |
| 10385 | BTN2A2 | P27T-E | Human | Esophagus | ESCC | 7.46e-15 | 2.06e-01 | 0.1055 |
| 10385 | BTN2A2 | P28T-E | Human | Esophagus | ESCC | 2.18e-05 | 1.08e-01 | 0.1149 |
| 10385 | BTN2A2 | P30T-E | Human | Esophagus | ESCC | 1.56e-07 | 2.72e-01 | 0.137 |
| 10385 | BTN2A2 | P31T-E | Human | Esophagus | ESCC | 7.00e-09 | 1.58e-01 | 0.1251 |
| Page: 1 2 3 |
| Tissue | Expression Dynamics | Abbreviation |
| Esophagus | 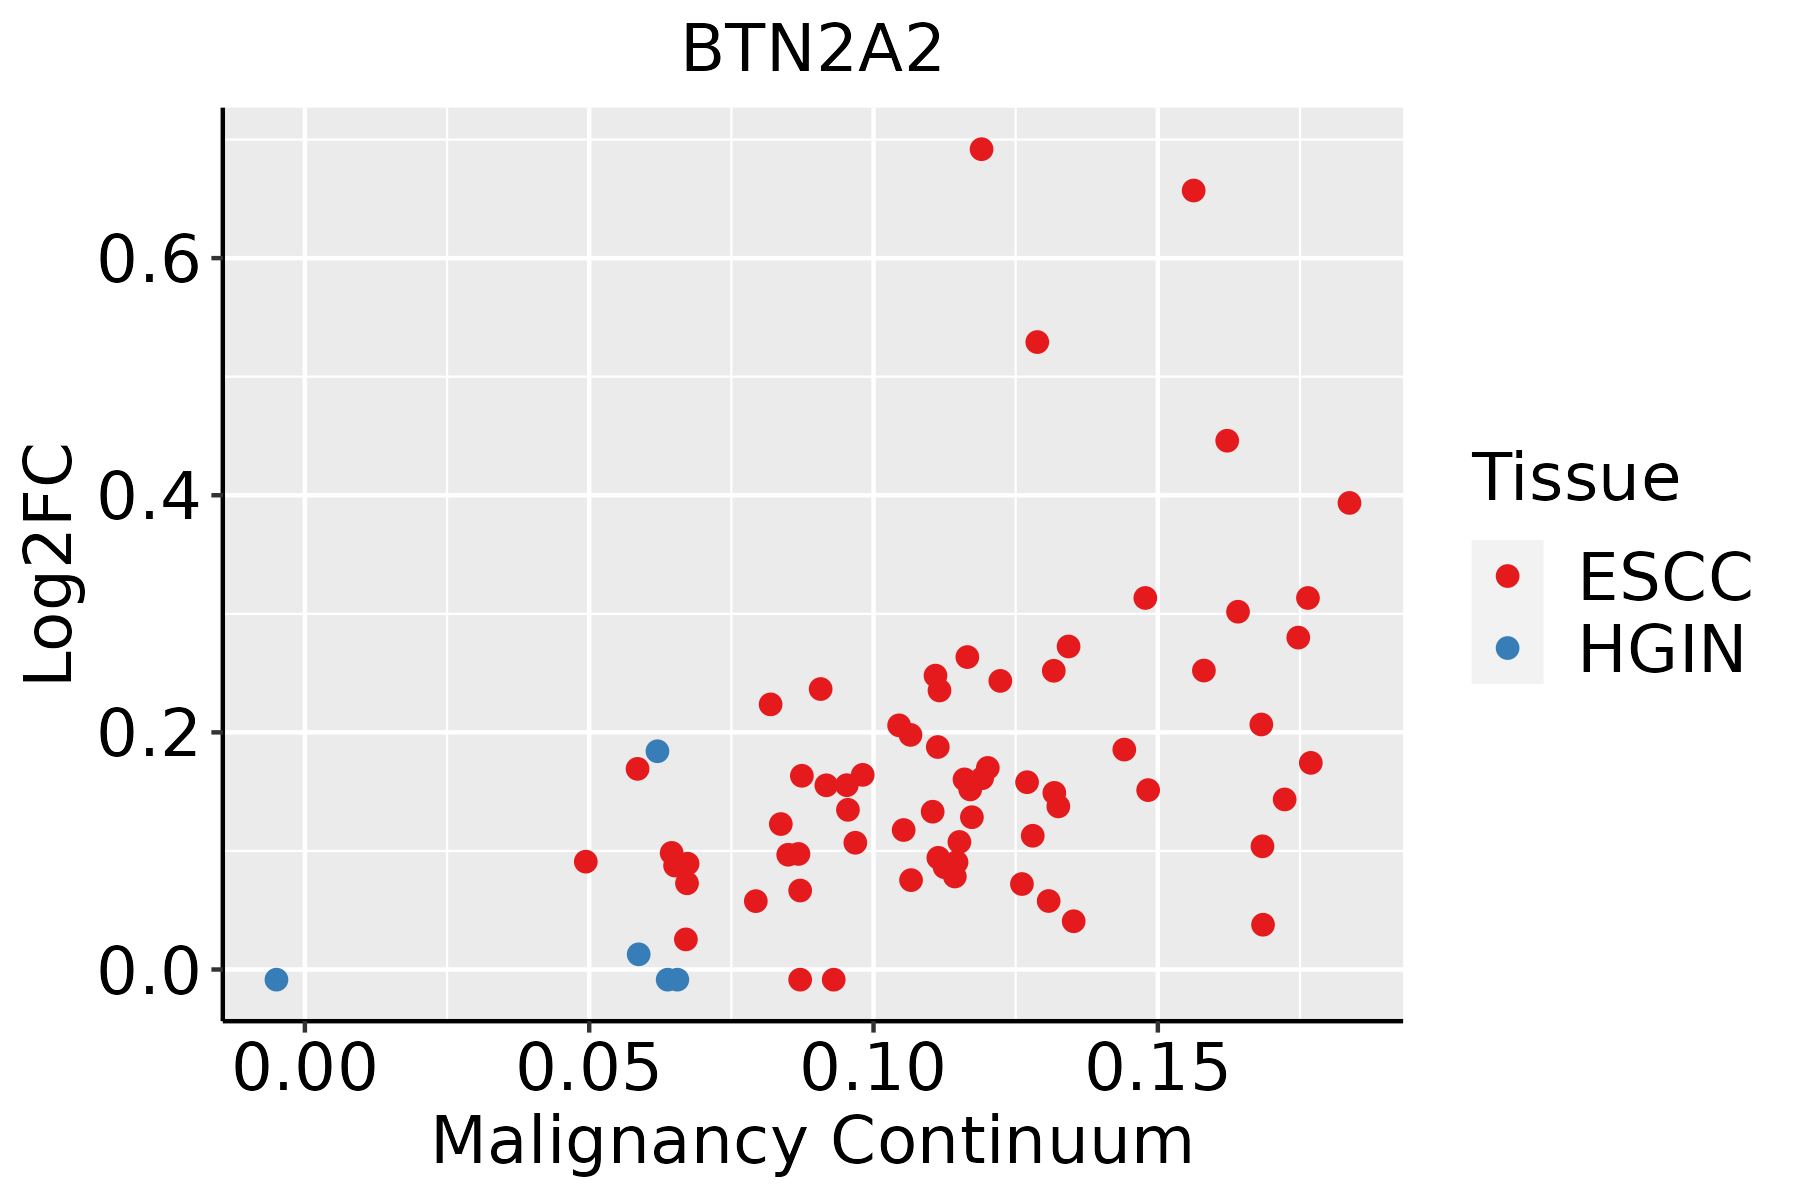 | ESCC: Esophageal squamous cell carcinoma |
| HGIN: High-grade intraepithelial neoplasias | ||
| LGIN: Low-grade intraepithelial neoplasias | ||
| Oral Cavity |  | EOLP: Erosive Oral lichen planus |
| LP: leukoplakia | ||
| NEOLP: Non-erosive oral lichen planus | ||
| OSCC: Oral squamous cell carcinoma |
| ∗log2FC in expression of this searched gene in stem-like cells from each diseased tissue sample relative to stem-like cells in normal samples in each tissue plotted against the malignancy continuum. Samples are colored based on if they are from different disease stage. |
Top |
Malignant transformation related pathway analysis |
| Find out the enriched GO biological processes and KEGG pathways involved in transition from healthy to precancer to cancer |
| Tissue | Disease Stage | Enriched GO biological Processes |
| Colorectum | AD |  |
| Colorectum | SER |  |
| Colorectum | MSS |  |
| Colorectum | MSI-H |  |
| Colorectum | FAP |  |
| ∗Top 15 enriched GO BP terms are showed in the bar plot of each disease state in each tissue. Each row represents a significant GO biological process which is colored according to the -log10(p.adjust). |
| Page: 1 2 3 4 5 6 7 8 9 |
| GO ID | Tissue | Disease Stage | Description | Gene Ratio | Bg Ratio | pvalue | p.adjust | Count |
| GO:002240720 | Esophagus | ESCC | regulation of cell-cell adhesion | 239/8552 | 448/18723 | 5.88e-04 | 3.19e-03 | 239 |
| GO:000268316 | Esophagus | ESCC | negative regulation of immune system process | 231/8552 | 434/18723 | 8.48e-04 | 4.36e-03 | 231 |
| GO:004211018 | Esophagus | ESCC | T cell activation | 256/8552 | 487/18723 | 1.18e-03 | 5.87e-03 | 256 |
| GO:00508528 | Esophagus | ESCC | T cell receptor signaling pathway | 73/8552 | 123/18723 | 1.54e-03 | 7.24e-03 | 73 |
| GO:000715918 | Esophagus | ESCC | leukocyte cell-cell adhesion | 192/8552 | 371/18723 | 1.03e-02 | 3.51e-02 | 192 |
| GO:190303717 | Esophagus | ESCC | regulation of leukocyte cell-cell adhesion | 174/8552 | 336/18723 | 1.36e-02 | 4.43e-02 | 174 |
| GO:004211016 | Oral cavity | OSCC | T cell activation | 245/7305 | 487/18723 | 2.00e-07 | 3.22e-06 | 245 |
| GO:002240718 | Oral cavity | OSCC | regulation of cell-cell adhesion | 218/7305 | 448/18723 | 1.71e-05 | 1.68e-04 | 218 |
| GO:005086315 | Oral cavity | OSCC | regulation of T cell activation | 161/7305 | 329/18723 | 1.44e-04 | 1.02e-03 | 161 |
| GO:00508527 | Oral cavity | OSCC | T cell receptor signaling pathway | 68/7305 | 123/18723 | 1.80e-04 | 1.22e-03 | 68 |
| GO:000715916 | Oral cavity | OSCC | leukocyte cell-cell adhesion | 178/7305 | 371/18723 | 2.44e-04 | 1.57e-03 | 178 |
| GO:190303715 | Oral cavity | OSCC | regulation of leukocyte cell-cell adhesion | 162/7305 | 336/18723 | 3.39e-04 | 2.08e-03 | 162 |
| GO:000268310 | Oral cavity | OSCC | negative regulation of immune system process | 204/7305 | 434/18723 | 3.72e-04 | 2.27e-03 | 204 |
| GO:004209816 | Oral cavity | OSCC | T cell proliferation | 100/7305 | 199/18723 | 7.93e-04 | 4.27e-03 | 100 |
| GO:00071629 | Oral cavity | OSCC | negative regulation of cell adhesion | 145/7305 | 303/18723 | 9.95e-04 | 5.18e-03 | 145 |
| GO:00027646 | Oral cavity | OSCC | immune response-regulating signaling pathway | 212/7305 | 468/18723 | 2.93e-03 | 1.27e-02 | 212 |
| GO:00706618 | Oral cavity | OSCC | leukocyte proliferation | 145/7305 | 318/18723 | 9.31e-03 | 3.33e-02 | 145 |
| GO:00224086 | Oral cavity | OSCC | negative regulation of cell-cell adhesion | 92/7305 | 196/18723 | 1.41e-02 | 4.64e-02 | 92 |
| GO:00466517 | Oral cavity | OSCC | lymphocyte proliferation | 131/7305 | 288/18723 | 1.41e-02 | 4.67e-02 | 131 |
| GO:000276413 | Oral cavity | EOLP | immune response-regulating signaling pathway | 108/2218 | 468/18723 | 4.04e-12 | 7.34e-10 | 108 |
| Page: 1 2 3 |
| Pathway ID | Tissue | Disease Stage | Description | Gene Ratio | Bg Ratio | pvalue | p.adjust | qvalue | Count |
| Page: 1 |
Top |
Cell-cell communication analysis |
| Identification of potential cell-cell interactions between two cell types and their ligand-receptor pairs for different disease states |
| Ligand | Receptor | LRpair | Pathway | Tissue | Disease Stage |
| Page: 1 |
Top |
Single-cell gene regulatory network inference analysis |
| Find out the significant the regulons (TFs) and the target genes of each regulon across cell types for different disease states |
| TF | Cell Type | Tissue | Disease Stage | Target Gene | RSS | Regulon Activity |
| ∗The dot plots of a searched regulon are shown for all cell subpopulations in each disease state of each tissue based on the regulon specific score inferred using pySCENIC and by calculating the average expression. |
| Page: 1 |
Top |
Somatic mutation of malignant transformation related genes |
| Annotation of somatic variants for genes involved in malignant transformation |
| Hugo Symbol | Variant Class | Variant Classification | dbSNP RS | HGVSc | HGVSp | HGVSp Short | SWISSPROT | BIOTYPE | SIFT | PolyPhen | Tumor Sample Barcode | Tissue | Histology | Sex | Age | Stage | Therapy Types | Drugs | Outcome |
| BTN2A2 | SNV | Missense_Mutation | c.190G>A | p.Glu64Lys | p.E64K | Q8WVV5 | protein_coding | deleterious(0.03) | possibly_damaging(0.759) | TCGA-AC-A23H-01 | Breast | breast invasive carcinoma | Female | >=65 | I/II | Unknown | Unknown | PD | |
| BTN2A2 | SNV | Missense_Mutation | c.296G>T | p.Arg99Ile | p.R99I | Q8WVV5 | protein_coding | deleterious(0) | probably_damaging(0.998) | TCGA-AC-A23H-01 | Breast | breast invasive carcinoma | Female | >=65 | I/II | Unknown | Unknown | PD | |
| BTN2A2 | SNV | Missense_Mutation | c.757N>A | p.Val253Met | p.V253M | Q8WVV5 | protein_coding | deleterious(0.03) | benign(0.434) | TCGA-AN-A0AK-01 | Breast | breast invasive carcinoma | Female | >=65 | I/II | Unknown | Unknown | SD | |
| BTN2A2 | SNV | Missense_Mutation | novel | c.457N>A | p.Pro153Thr | p.P153T | Q8WVV5 | protein_coding | deleterious(0.01) | probably_damaging(0.993) | TCGA-C8-A12P-01 | Breast | breast invasive carcinoma | Female | <65 | I/II | Unknown | Unknown | SD |
| BTN2A2 | insertion | Frame_Shift_Ins | novel | c.302_303insGGAGGGGGAAGTGGAGGGACGAGGGTGTGAAAGAATCCAGGGACAA | p.Phe102GlufsTer32 | p.F102Efs*32 | Q8WVV5 | protein_coding | TCGA-A2-A0CU-01 | Breast | breast invasive carcinoma | Female | >=65 | I/II | Hormone Therapy | tamoxiphen | SD | ||
| BTN2A2 | insertion | Frame_Shift_Ins | novel | c.1265_1266insTGTGTGGTTCCTG | p.Met422IlefsTer17 | p.M422Ifs*17 | Q8WVV5 | protein_coding | TCGA-AR-A0U0-01 | Breast | breast invasive carcinoma | Female | >=65 | I/II | Unknown | Unknown | SD | ||
| BTN2A2 | SNV | Missense_Mutation | rs775875965 | c.334G>A | p.Val112Met | p.V112M | Q8WVV5 | protein_coding | deleterious(0.03) | probably_damaging(0.994) | TCGA-4T-AA8H-01 | Colorectum | colon adenocarcinoma | Female | <65 | I/II | Unknown | Unknown | SD |
| BTN2A2 | SNV | Missense_Mutation | rs146154371 | c.412N>A | p.Asp138Asn | p.D138N | Q8WVV5 | protein_coding | tolerated(0.09) | benign(0.168) | TCGA-AA-3510-01 | Colorectum | colon adenocarcinoma | Male | >=65 | I/II | Unknown | Unknown | SD |
| BTN2A2 | SNV | Missense_Mutation | novel | c.997N>A | p.Pro333Thr | p.P333T | Q8WVV5 | protein_coding | deleterious(0.03) | probably_damaging(0.973) | TCGA-AA-3984-01 | Colorectum | colon adenocarcinoma | Female | <65 | I/II | Unknown | Unknown | SD |
| BTN2A2 | SNV | Missense_Mutation | novel | c.1424N>T | p.Ala475Val | p.A475V | Q8WVV5 | protein_coding | tolerated(0.09) | benign(0.015) | TCGA-AA-3984-01 | Colorectum | colon adenocarcinoma | Female | <65 | I/II | Unknown | Unknown | SD |
| Page: 1 2 3 4 5 6 7 8 |
Top |
Related drugs of malignant transformation related genes |
| Identification of chemicals and drugs interact with genes involved in malignant transfromation |
| (DGIdb 4.0) |
| Entrez ID | Symbol | Category | Interaction Types | Drug Claim Name | Drug Name | PMIDs |
| Page: 1 |

Copyright 2023-Present -The University of Texas Health Science Center at Houston |