
|
|||||
|
 | |
| |
| |
| |
| |
| |
|
Gene: BTN2A1 |
Gene summary for BTN2A1 |
| Gene information | Species | Human | Gene symbol | BTN2A1 | Gene ID | 11120 |
| Gene name | butyrophilin subfamily 2 member A1 | |
| Gene Alias | BK14H9.1 | |
| Cytomap | 6p22.2 | |
| Gene Type | protein-coding | GO ID | GO:0001816 | UniProtAcc | Q7KYR7 |
Top |
Malignant transformation analysis |
| Identification of the aberrant gene expression in precancerous and cancerous lesions by comparing the gene expression of stem-like cells in diseased tissues with normal stem cells |
| Entrez ID | Symbol | Replicates | Species | Organ | Tissue | Adj P-value | Log2FC | Malignancy |
| 11120 | BTN2A1 | LZE4T | Human | Esophagus | ESCC | 1.29e-10 | 3.21e-01 | 0.0811 |
| 11120 | BTN2A1 | LZE7T | Human | Esophagus | ESCC | 1.31e-04 | 2.25e-01 | 0.0667 |
| 11120 | BTN2A1 | LZE20T | Human | Esophagus | ESCC | 1.55e-05 | 2.30e-01 | 0.0662 |
| 11120 | BTN2A1 | LZE22T | Human | Esophagus | ESCC | 3.43e-04 | 2.67e-01 | 0.068 |
| 11120 | BTN2A1 | LZE24T | Human | Esophagus | ESCC | 1.07e-14 | 3.80e-01 | 0.0596 |
| 11120 | BTN2A1 | LZE21T | Human | Esophagus | ESCC | 1.58e-05 | 2.58e-01 | 0.0655 |
| 11120 | BTN2A1 | LZE6T | Human | Esophagus | ESCC | 9.08e-04 | 1.31e-01 | 0.0845 |
| 11120 | BTN2A1 | P1T-E | Human | Esophagus | ESCC | 4.55e-05 | 4.06e-01 | 0.0875 |
| 11120 | BTN2A1 | P2T-E | Human | Esophagus | ESCC | 2.33e-22 | 4.32e-01 | 0.1177 |
| 11120 | BTN2A1 | P4T-E | Human | Esophagus | ESCC | 2.13e-20 | 3.90e-01 | 0.1323 |
| 11120 | BTN2A1 | P5T-E | Human | Esophagus | ESCC | 1.24e-07 | 7.55e-02 | 0.1327 |
| 11120 | BTN2A1 | P8T-E | Human | Esophagus | ESCC | 1.29e-19 | 3.31e-01 | 0.0889 |
| 11120 | BTN2A1 | P9T-E | Human | Esophagus | ESCC | 6.84e-07 | 1.01e-01 | 0.1131 |
| 11120 | BTN2A1 | P10T-E | Human | Esophagus | ESCC | 1.73e-13 | 1.41e-01 | 0.116 |
| 11120 | BTN2A1 | P11T-E | Human | Esophagus | ESCC | 9.21e-12 | 4.24e-01 | 0.1426 |
| 11120 | BTN2A1 | P12T-E | Human | Esophagus | ESCC | 4.39e-16 | 2.94e-01 | 0.1122 |
| 11120 | BTN2A1 | P15T-E | Human | Esophagus | ESCC | 2.25e-09 | 2.16e-01 | 0.1149 |
| 11120 | BTN2A1 | P16T-E | Human | Esophagus | ESCC | 2.43e-22 | 3.65e-01 | 0.1153 |
| 11120 | BTN2A1 | P17T-E | Human | Esophagus | ESCC | 1.22e-08 | 2.43e-01 | 0.1278 |
| 11120 | BTN2A1 | P19T-E | Human | Esophagus | ESCC | 1.37e-02 | 3.93e-01 | 0.1662 |
| Page: 1 2 3 4 |
| Tissue | Expression Dynamics | Abbreviation |
| Esophagus | 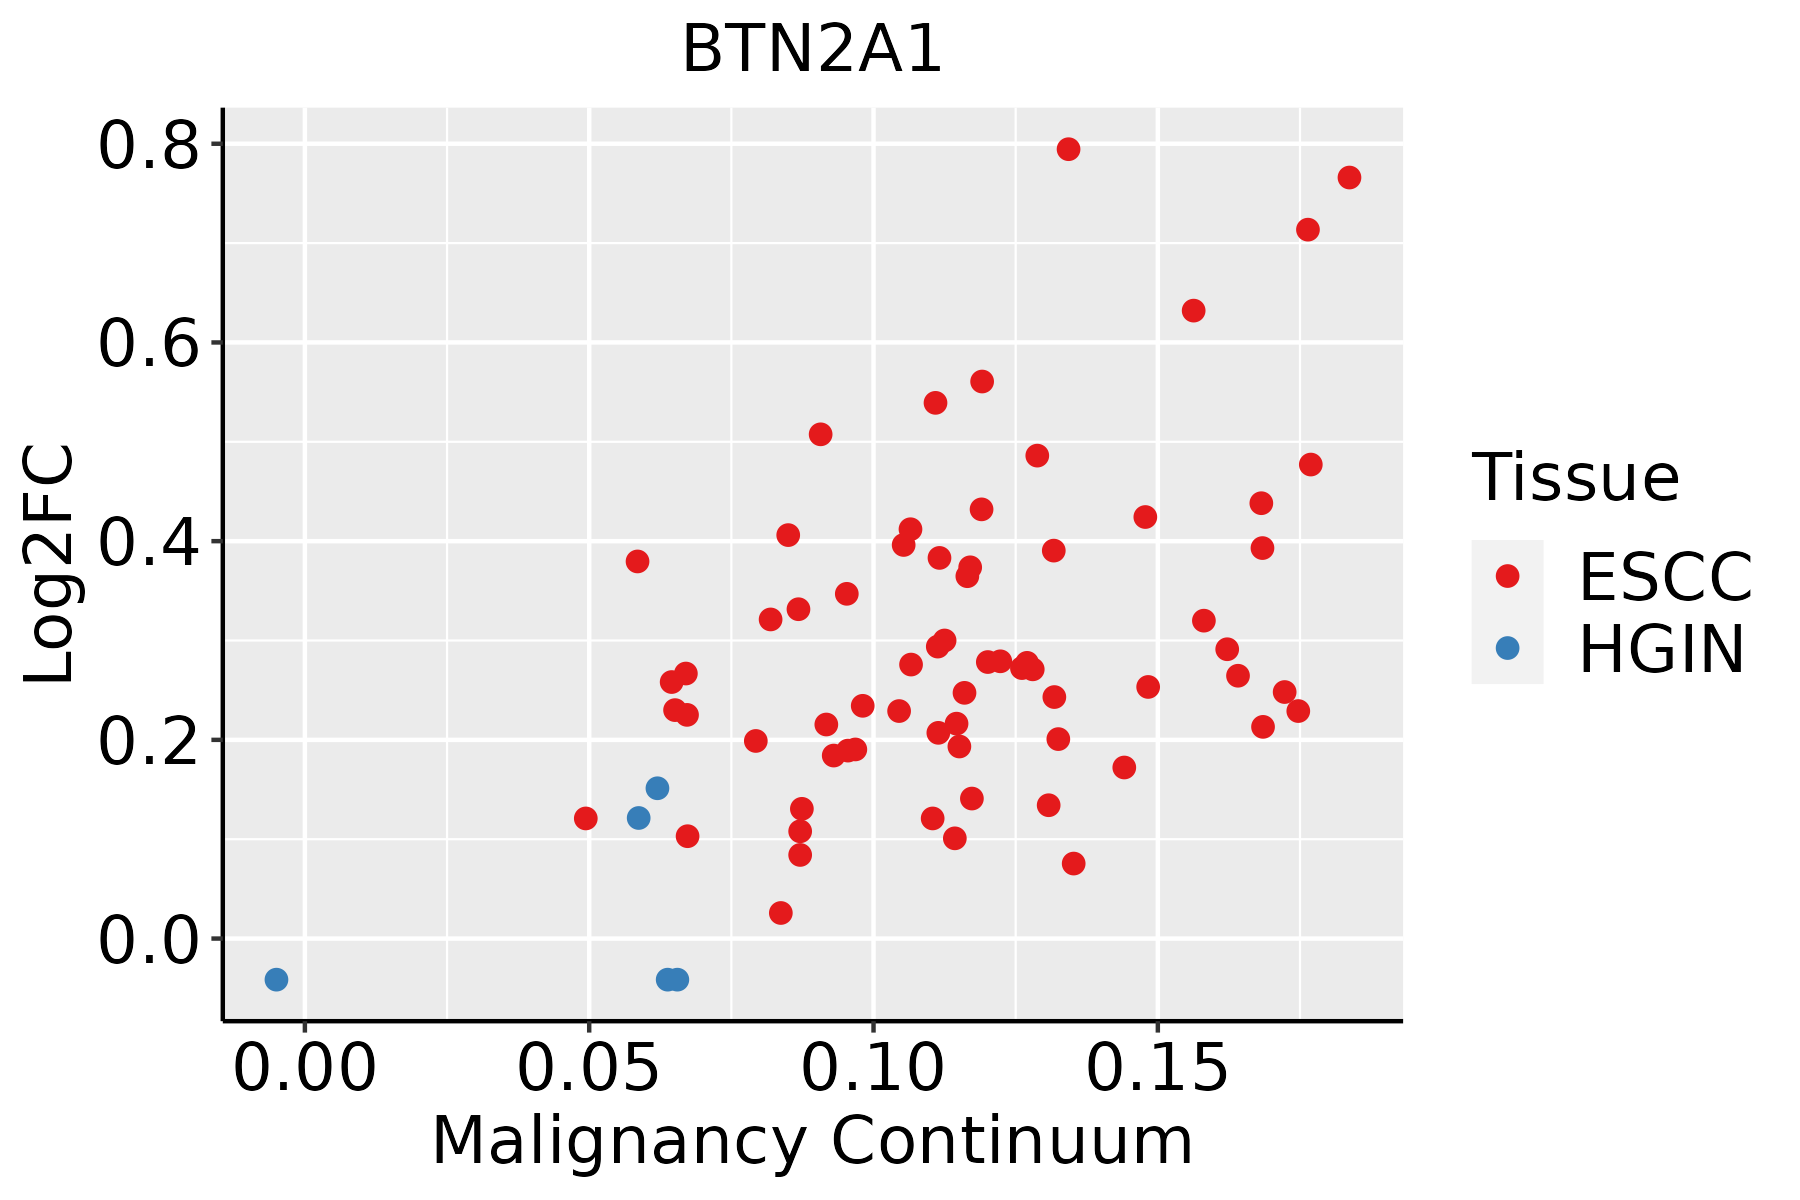 | ESCC: Esophageal squamous cell carcinoma |
| HGIN: High-grade intraepithelial neoplasias | ||
| LGIN: Low-grade intraepithelial neoplasias | ||
| Oral Cavity | 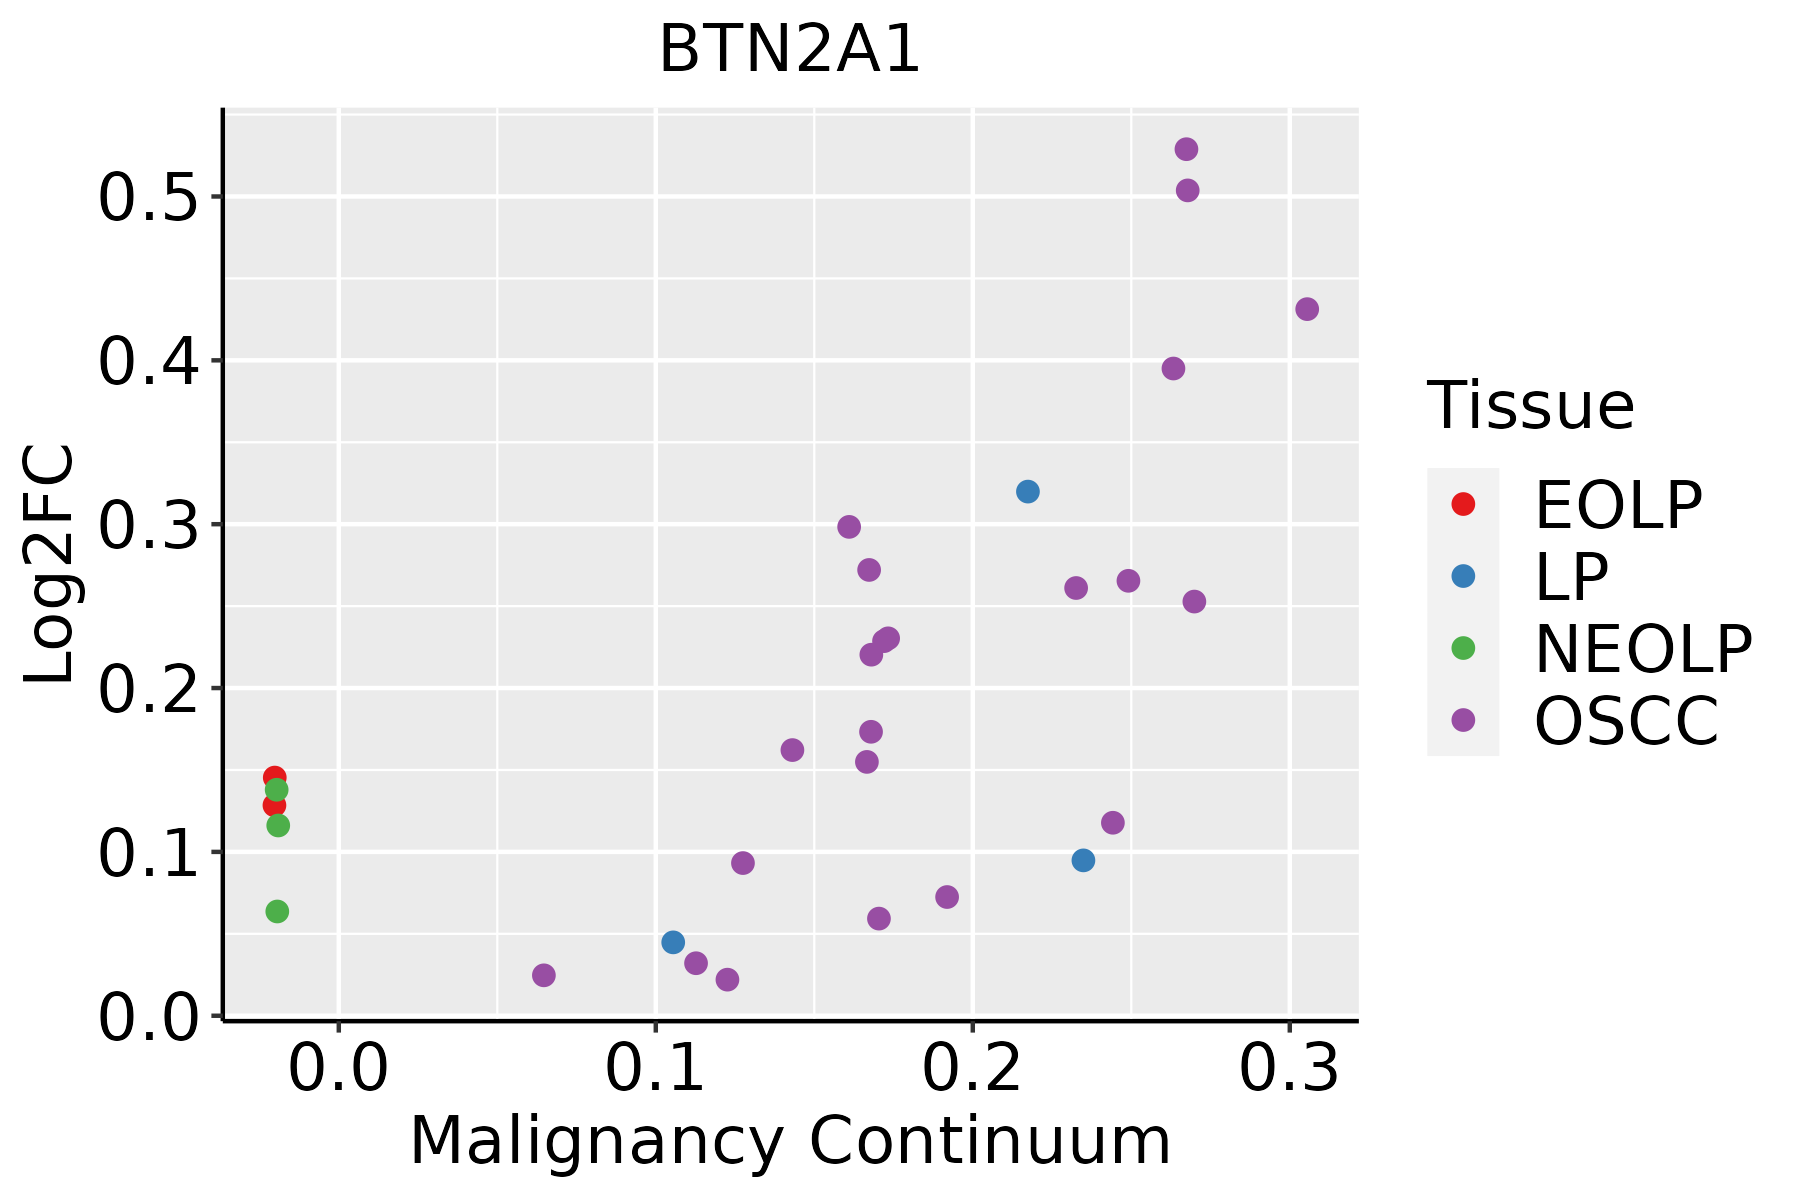 | EOLP: Erosive Oral lichen planus |
| LP: leukoplakia | ||
| NEOLP: Non-erosive oral lichen planus | ||
| OSCC: Oral squamous cell carcinoma |
| ∗log2FC in expression of this searched gene in stem-like cells from each diseased tissue sample relative to stem-like cells in normal samples in each tissue plotted against the malignancy continuum. Samples are colored based on if they are from different disease stage. |
Top |
Malignant transformation related pathway analysis |
| Find out the enriched GO biological processes and KEGG pathways involved in transition from healthy to precancer to cancer |
| Tissue | Disease Stage | Enriched GO biological Processes |
| Colorectum | AD |  |
| Colorectum | SER |  |
| Colorectum | MSS |  |
| Colorectum | MSI-H |  |
| Colorectum | FAP |  |
| ∗Top 15 enriched GO BP terms are showed in the bar plot of each disease state in each tissue. Each row represents a significant GO biological process which is colored according to the -log10(p.adjust). |
| Page: 1 2 3 4 5 6 7 8 9 |
| GO ID | Tissue | Disease Stage | Description | Gene Ratio | Bg Ratio | pvalue | p.adjust | Count |
| GO:00508528 | Esophagus | ESCC | T cell receptor signaling pathway | 73/8552 | 123/18723 | 1.54e-03 | 7.24e-03 | 73 |
| GO:00508527 | Oral cavity | OSCC | T cell receptor signaling pathway | 68/7305 | 123/18723 | 1.80e-04 | 1.22e-03 | 68 |
| GO:00027646 | Oral cavity | OSCC | immune response-regulating signaling pathway | 212/7305 | 468/18723 | 2.93e-03 | 1.27e-02 | 212 |
| Page: 1 |
| Pathway ID | Tissue | Disease Stage | Description | Gene Ratio | Bg Ratio | pvalue | p.adjust | qvalue | Count |
| Page: 1 |
Top |
Cell-cell communication analysis |
| Identification of potential cell-cell interactions between two cell types and their ligand-receptor pairs for different disease states |
| Ligand | Receptor | LRpair | Pathway | Tissue | Disease Stage |
| Page: 1 |
Top |
Single-cell gene regulatory network inference analysis |
| Find out the significant the regulons (TFs) and the target genes of each regulon across cell types for different disease states |
| TF | Cell Type | Tissue | Disease Stage | Target Gene | RSS | Regulon Activity |
| ∗The dot plots of a searched regulon are shown for all cell subpopulations in each disease state of each tissue based on the regulon specific score inferred using pySCENIC and by calculating the average expression. |
| Page: 1 |
Top |
Somatic mutation of malignant transformation related genes |
| Annotation of somatic variants for genes involved in malignant transformation |
| Hugo Symbol | Variant Class | Variant Classification | dbSNP RS | HGVSc | HGVSp | HGVSp Short | SWISSPROT | BIOTYPE | SIFT | PolyPhen | Tumor Sample Barcode | Tissue | Histology | Sex | Age | Stage | Therapy Types | Drugs | Outcome |
| BTN2A1 | SNV | Missense_Mutation | c.955N>G | p.Arg319Gly | p.R319G | Q7KYR7 | protein_coding | tolerated(0.09) | benign(0.007) | TCGA-A1-A0SO-01 | Breast | breast invasive carcinoma | Female | >=65 | I/II | Chemotherapy | SD | ||
| BTN2A1 | SNV | Missense_Mutation | c.500C>G | p.Ser167Cys | p.S167C | Q7KYR7 | protein_coding | deleterious(0) | probably_damaging(1) | TCGA-AR-A0TX-01 | Breast | breast invasive carcinoma | Female | <65 | I/II | Unknown | Unknown | SD | |
| BTN2A1 | SNV | Missense_Mutation | rs201996542 | c.1354G>A | p.Val452Ile | p.V452I | Q7KYR7 | protein_coding | tolerated(0.84) | benign(0.029) | TCGA-BH-A0HA-01 | Breast | breast invasive carcinoma | Female | <65 | I/II | Unknown | Unknown | SD |
| BTN2A1 | insertion | Frame_Shift_Ins | novel | c.168_169insA | p.Asn58LysfsTer3 | p.N58Kfs*3 | Q7KYR7 | protein_coding | TCGA-A2-A0SV-01 | Breast | breast invasive carcinoma | Female | <65 | III/IV | Other, specify in notesBisphosphonate therapy | zometa | PD | ||
| BTN2A1 | insertion | Nonsense_Mutation | novel | c.599_600insATAGTAGCATATTTGATATATTGGTTCTGTGTCATTGATGGA | p.Leu200_Phe201insTer | p.L200_F201ins* | Q7KYR7 | protein_coding | TCGA-A8-A08H-01 | Breast | breast invasive carcinoma | Female | >=65 | I/II | Unknown | Unknown | SD | ||
| BTN2A1 | insertion | In_Frame_Ins | novel | c.1232_1233insACCCTATGGTTTACATCCCAGGATCCTTTATCTTTT | p.Gly411_Glu412insProTyrGlyLeuHisProArgIleLeuTyrLeuLeu | p.G411_E412insPYGLHPRILYLL | Q7KYR7 | protein_coding | TCGA-AN-A04C-01 | Breast | breast invasive carcinoma | Female | <65 | I/II | Unknown | Unknown | SD | ||
| BTN2A1 | SNV | Missense_Mutation | novel | c.1178N>C | p.Glu393Ala | p.E393A | Q7KYR7 | protein_coding | tolerated(0.14) | benign(0.111) | TCGA-DS-A1OC-01 | Cervix | cervical & endocervical cancer | Female | <65 | I/II | Chemotherapy | gemcitabine | SD |
| BTN2A1 | SNV | Missense_Mutation | c.455N>T | p.Ser152Leu | p.S152L | Q7KYR7 | protein_coding | deleterious(0.01) | benign(0.005) | TCGA-IR-A3LI-01 | Cervix | cervical & endocervical cancer | Female | <65 | I/II | Chemotherapy | cisplatin | CR | |
| BTN2A1 | SNV | Missense_Mutation | novel | c.869N>C | p.Arg290Thr | p.R290T | Q7KYR7 | protein_coding | deleterious(0.01) | benign(0.003) | TCGA-VS-A8QA-01 | Cervix | cervical & endocervical cancer | Female | <65 | I/II | Unknown | Unknown | SD |
| BTN2A1 | SNV | Missense_Mutation | c.149N>T | p.Arg50Leu | p.R50L | Q7KYR7 | protein_coding | tolerated(0.18) | benign(0.28) | TCGA-AA-3811-01 | Colorectum | colon adenocarcinoma | Female | >=65 | III/IV | Unknown | Unknown | PD |
| Page: 1 2 3 4 5 6 7 |
Top |
Related drugs of malignant transformation related genes |
| Identification of chemicals and drugs interact with genes involved in malignant transfromation |
| (DGIdb 4.0) |
| Entrez ID | Symbol | Category | Interaction Types | Drug Claim Name | Drug Name | PMIDs |
| Page: 1 |

Copyright 2023-Present -The University of Texas Health Science Center at Houston |