
|
|||||
|
 | |
| |
| |
| |
| |
| |
|
Gene: BTG3 |
Gene summary for BTG3 |
| Gene information | Species | Human | Gene symbol | BTG3 | Gene ID | 10950 |
| Gene name | BTG anti-proliferation factor 3 | |
| Gene Alias | ANA | |
| Cytomap | 21q21.1 | |
| Gene Type | protein-coding | GO ID | GO:0000278 | UniProtAcc | Q14201 |
Top |
Malignant transformation analysis |
| Identification of the aberrant gene expression in precancerous and cancerous lesions by comparing the gene expression of stem-like cells in diseased tissues with normal stem cells |
| Entrez ID | Symbol | Replicates | Species | Organ | Tissue | Adj P-value | Log2FC | Malignancy |
| 10950 | BTG3 | GSM4909281 | Human | Breast | IDC | 2.63e-03 | -2.73e-01 | 0.21 |
| 10950 | BTG3 | GSM4909282 | Human | Breast | IDC | 8.61e-04 | 3.41e-01 | -0.0288 |
| 10950 | BTG3 | GSM4909286 | Human | Breast | IDC | 2.19e-09 | -3.89e-01 | 0.1081 |
| 10950 | BTG3 | GSM4909290 | Human | Breast | IDC | 2.36e-05 | -4.16e-01 | 0.2096 |
| 10950 | BTG3 | GSM4909291 | Human | Breast | IDC | 4.09e-11 | -5.26e-01 | 0.1753 |
| 10950 | BTG3 | GSM4909293 | Human | Breast | IDC | 4.40e-25 | -5.35e-01 | 0.1581 |
| 10950 | BTG3 | GSM4909294 | Human | Breast | IDC | 1.86e-14 | -4.42e-01 | 0.2022 |
| 10950 | BTG3 | GSM4909296 | Human | Breast | IDC | 4.66e-34 | -5.87e-01 | 0.1524 |
| 10950 | BTG3 | GSM4909297 | Human | Breast | IDC | 1.05e-28 | -5.12e-01 | 0.1517 |
| 10950 | BTG3 | GSM4909298 | Human | Breast | IDC | 5.49e-19 | -4.77e-01 | 0.1551 |
| 10950 | BTG3 | GSM4909301 | Human | Breast | IDC | 2.65e-19 | -4.95e-01 | 0.1577 |
| 10950 | BTG3 | GSM4909302 | Human | Breast | IDC | 4.80e-17 | -5.05e-01 | 0.1545 |
| 10950 | BTG3 | GSM4909304 | Human | Breast | IDC | 2.97e-20 | -5.08e-01 | 0.1636 |
| 10950 | BTG3 | GSM4909306 | Human | Breast | IDC | 7.81e-17 | -4.78e-01 | 0.1564 |
| 10950 | BTG3 | GSM4909307 | Human | Breast | IDC | 3.73e-28 | -5.63e-01 | 0.1569 |
| 10950 | BTG3 | GSM4909308 | Human | Breast | IDC | 3.77e-17 | -5.40e-01 | 0.158 |
| 10950 | BTG3 | GSM4909309 | Human | Breast | IDC | 2.45e-05 | -3.62e-01 | 0.0483 |
| 10950 | BTG3 | GSM4909311 | Human | Breast | IDC | 9.86e-34 | -5.79e-01 | 0.1534 |
| 10950 | BTG3 | GSM4909312 | Human | Breast | IDC | 4.06e-25 | -5.40e-01 | 0.1552 |
| 10950 | BTG3 | GSM4909313 | Human | Breast | IDC | 1.54e-07 | -4.02e-01 | 0.0391 |
| Page: 1 2 3 4 5 6 7 8 9 10 11 12 |
| Tissue | Expression Dynamics | Abbreviation |
| Breast |  | IDC: Invasive ductal carcinoma |
| DCIS: Ductal carcinoma in situ | ||
| Precancer(BRCA1-mut): Precancerous lesion from BRCA1 mutation carriers | ||
| Endometrium |  | AEH: Atypical endometrial hyperplasia |
| EEC: Endometrioid Cancer | ||
| Esophagus | 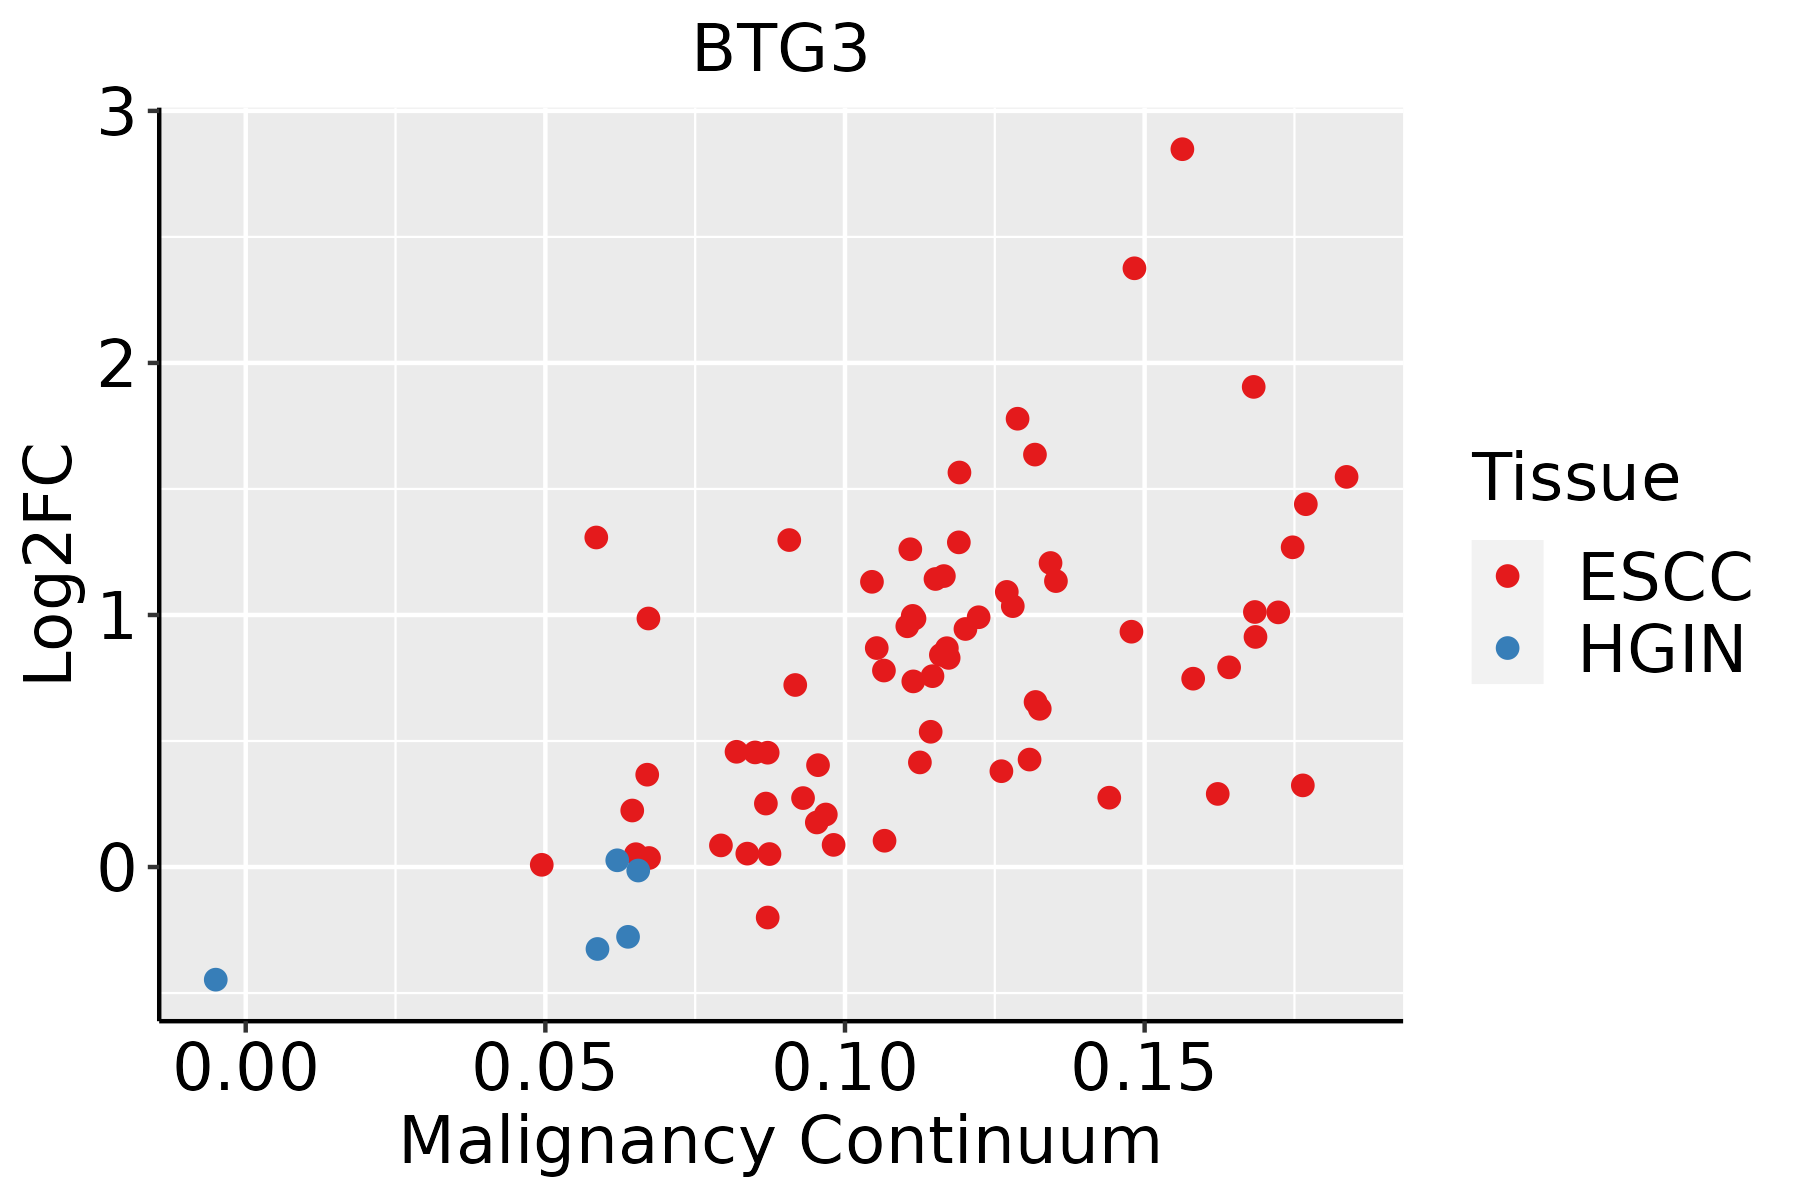 | ESCC: Esophageal squamous cell carcinoma |
| HGIN: High-grade intraepithelial neoplasias | ||
| LGIN: Low-grade intraepithelial neoplasias | ||
| Liver | 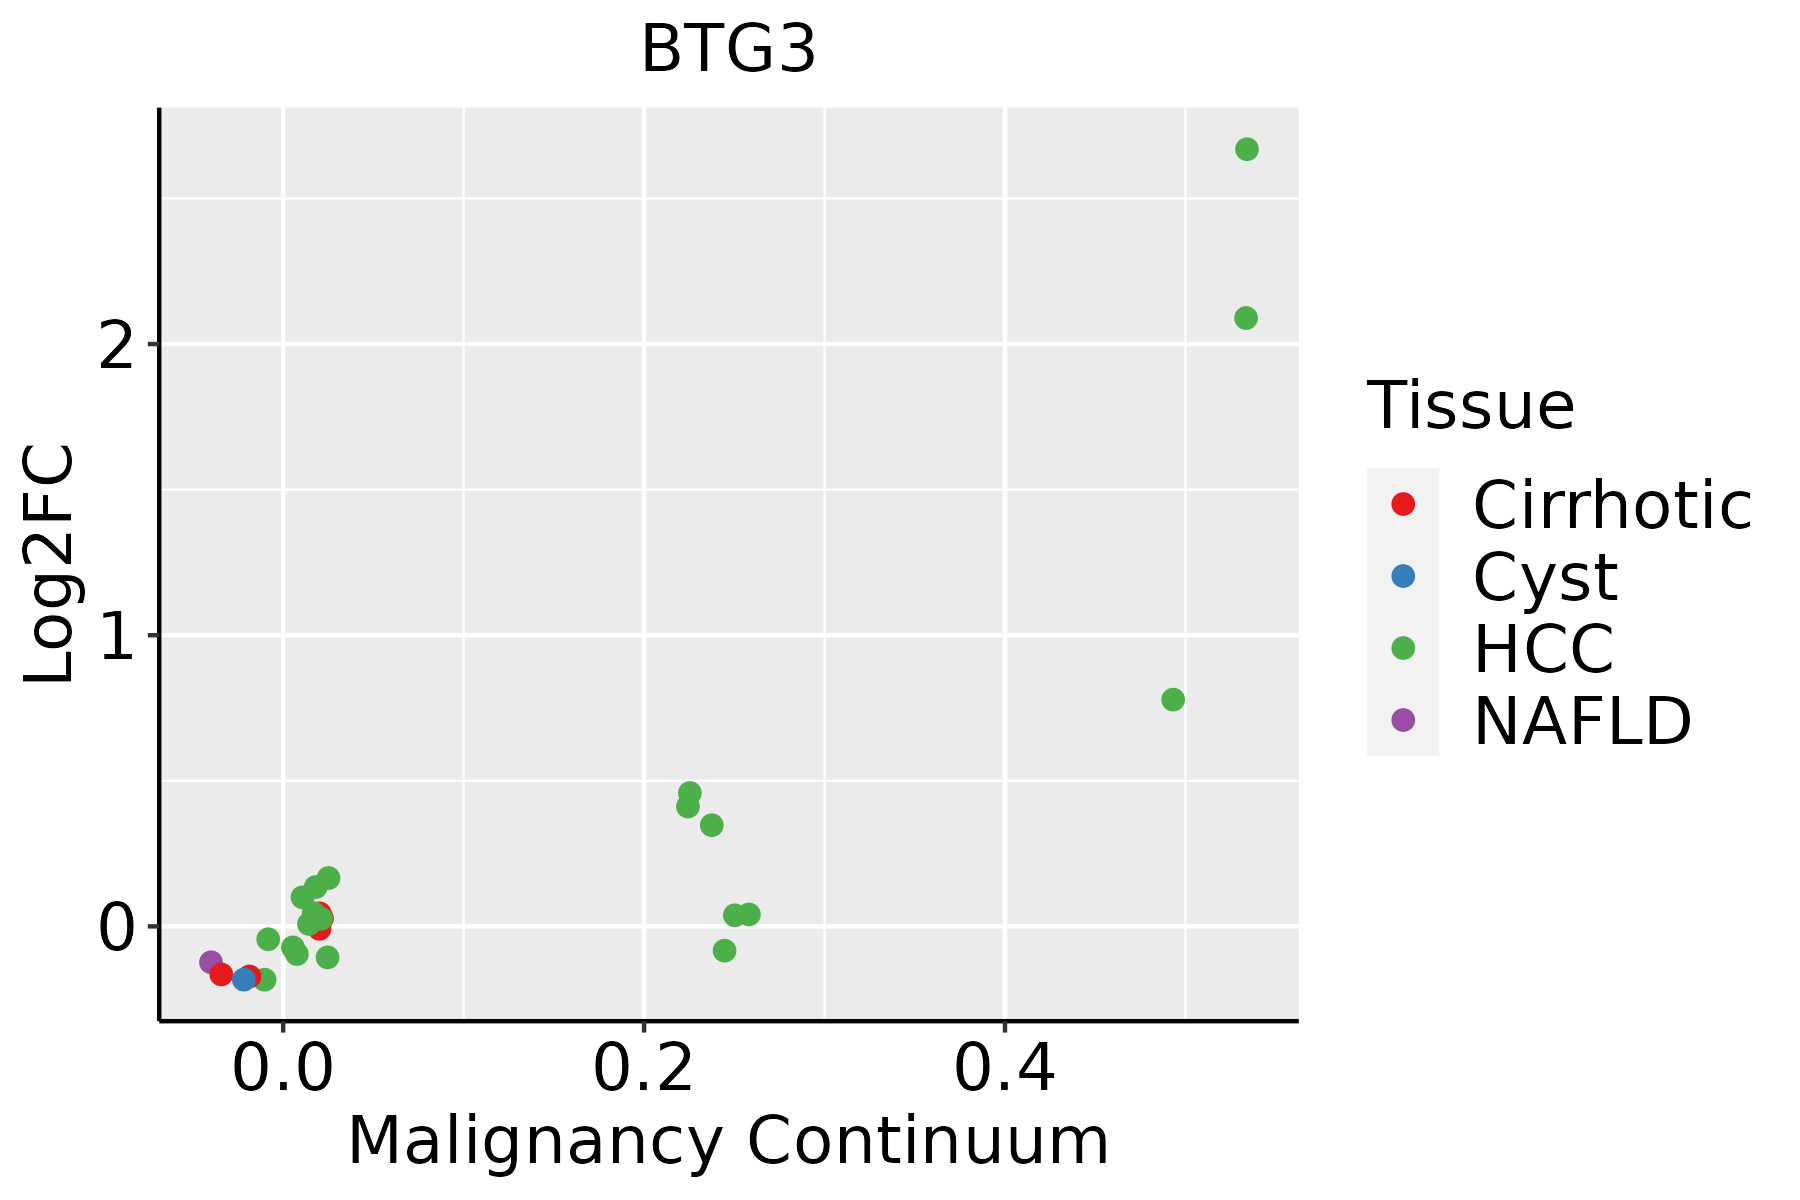 | HCC: Hepatocellular carcinoma |
| NAFLD: Non-alcoholic fatty liver disease | ||
| Lung |  | AAH: Atypical adenomatous hyperplasia |
| AIS: Adenocarcinoma in situ | ||
| IAC: Invasive lung adenocarcinoma | ||
| MIA: Minimally invasive adenocarcinoma | ||
| Oral Cavity | 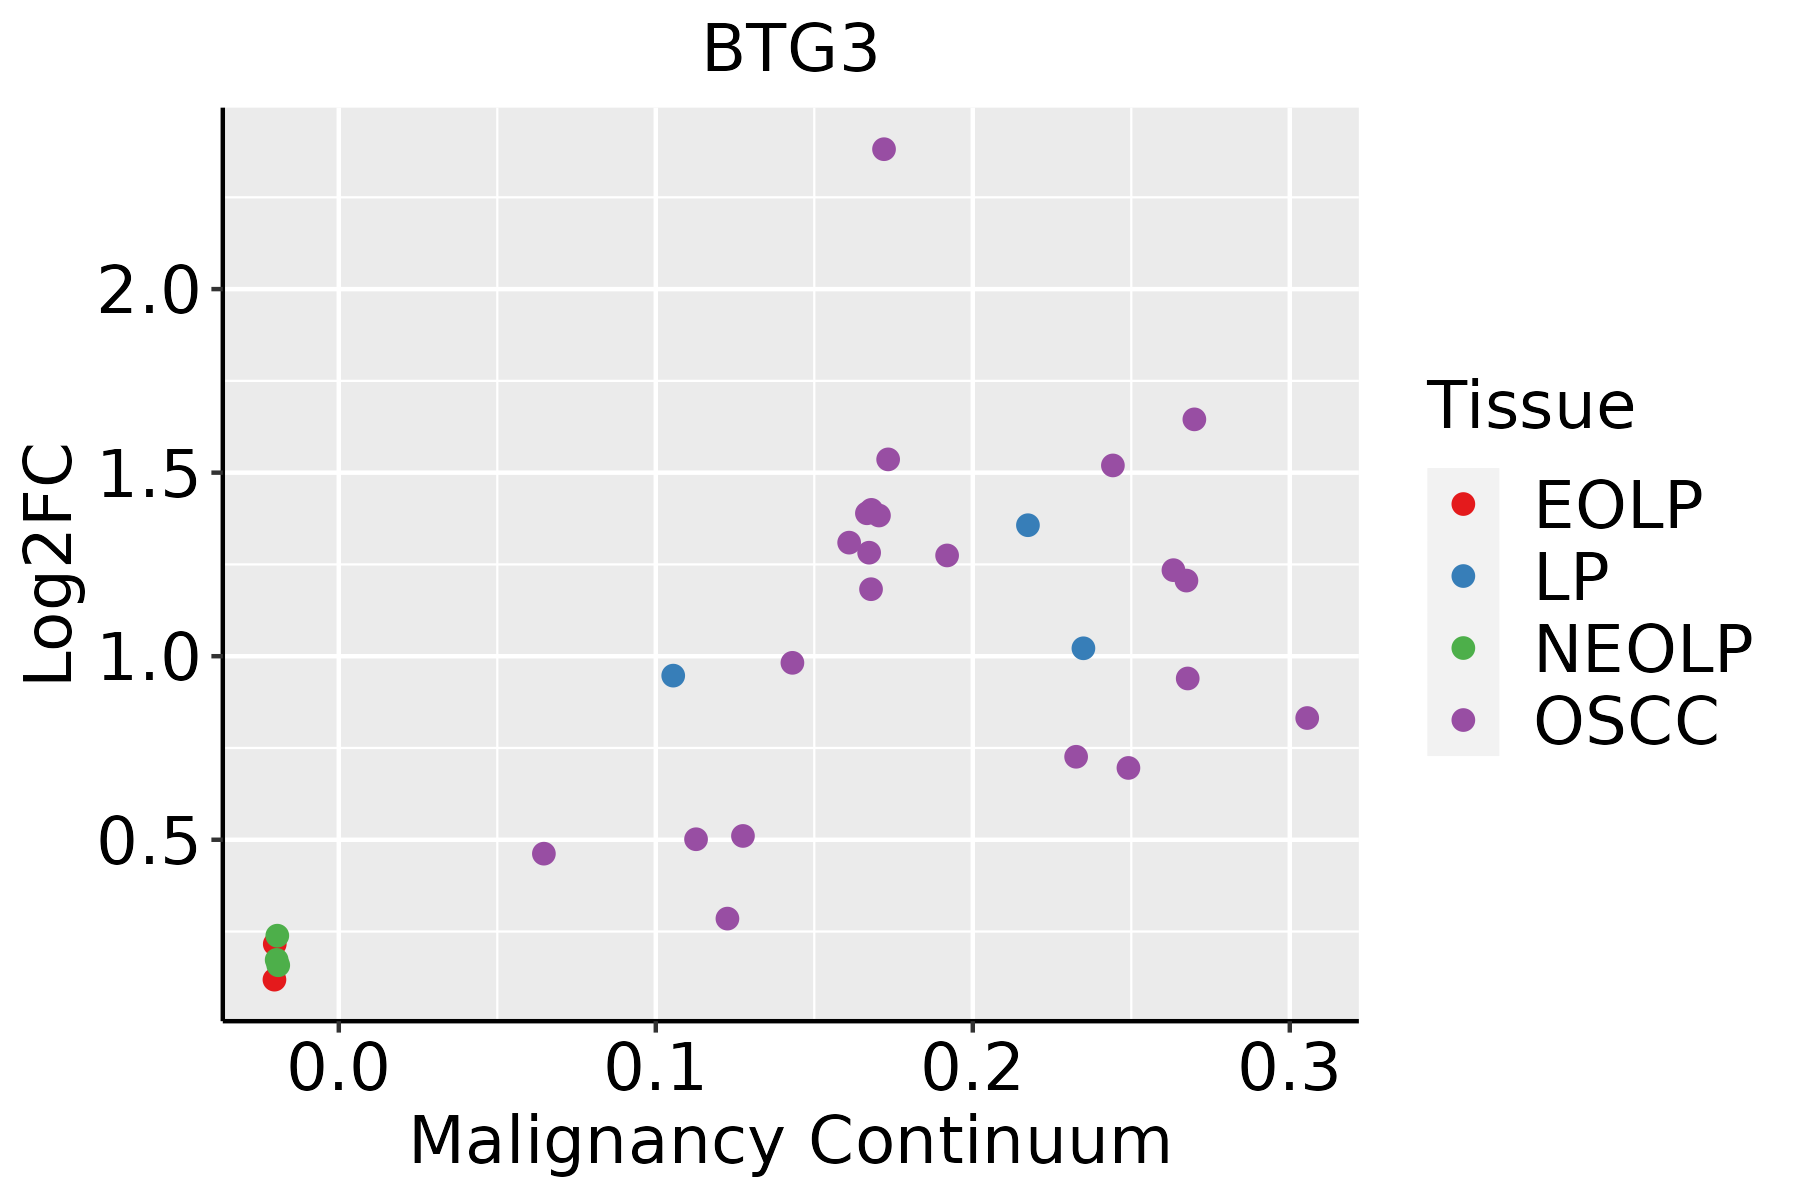 | EOLP: Erosive Oral lichen planus |
| LP: leukoplakia | ||
| NEOLP: Non-erosive oral lichen planus | ||
| OSCC: Oral squamous cell carcinoma | ||
| Prostate | 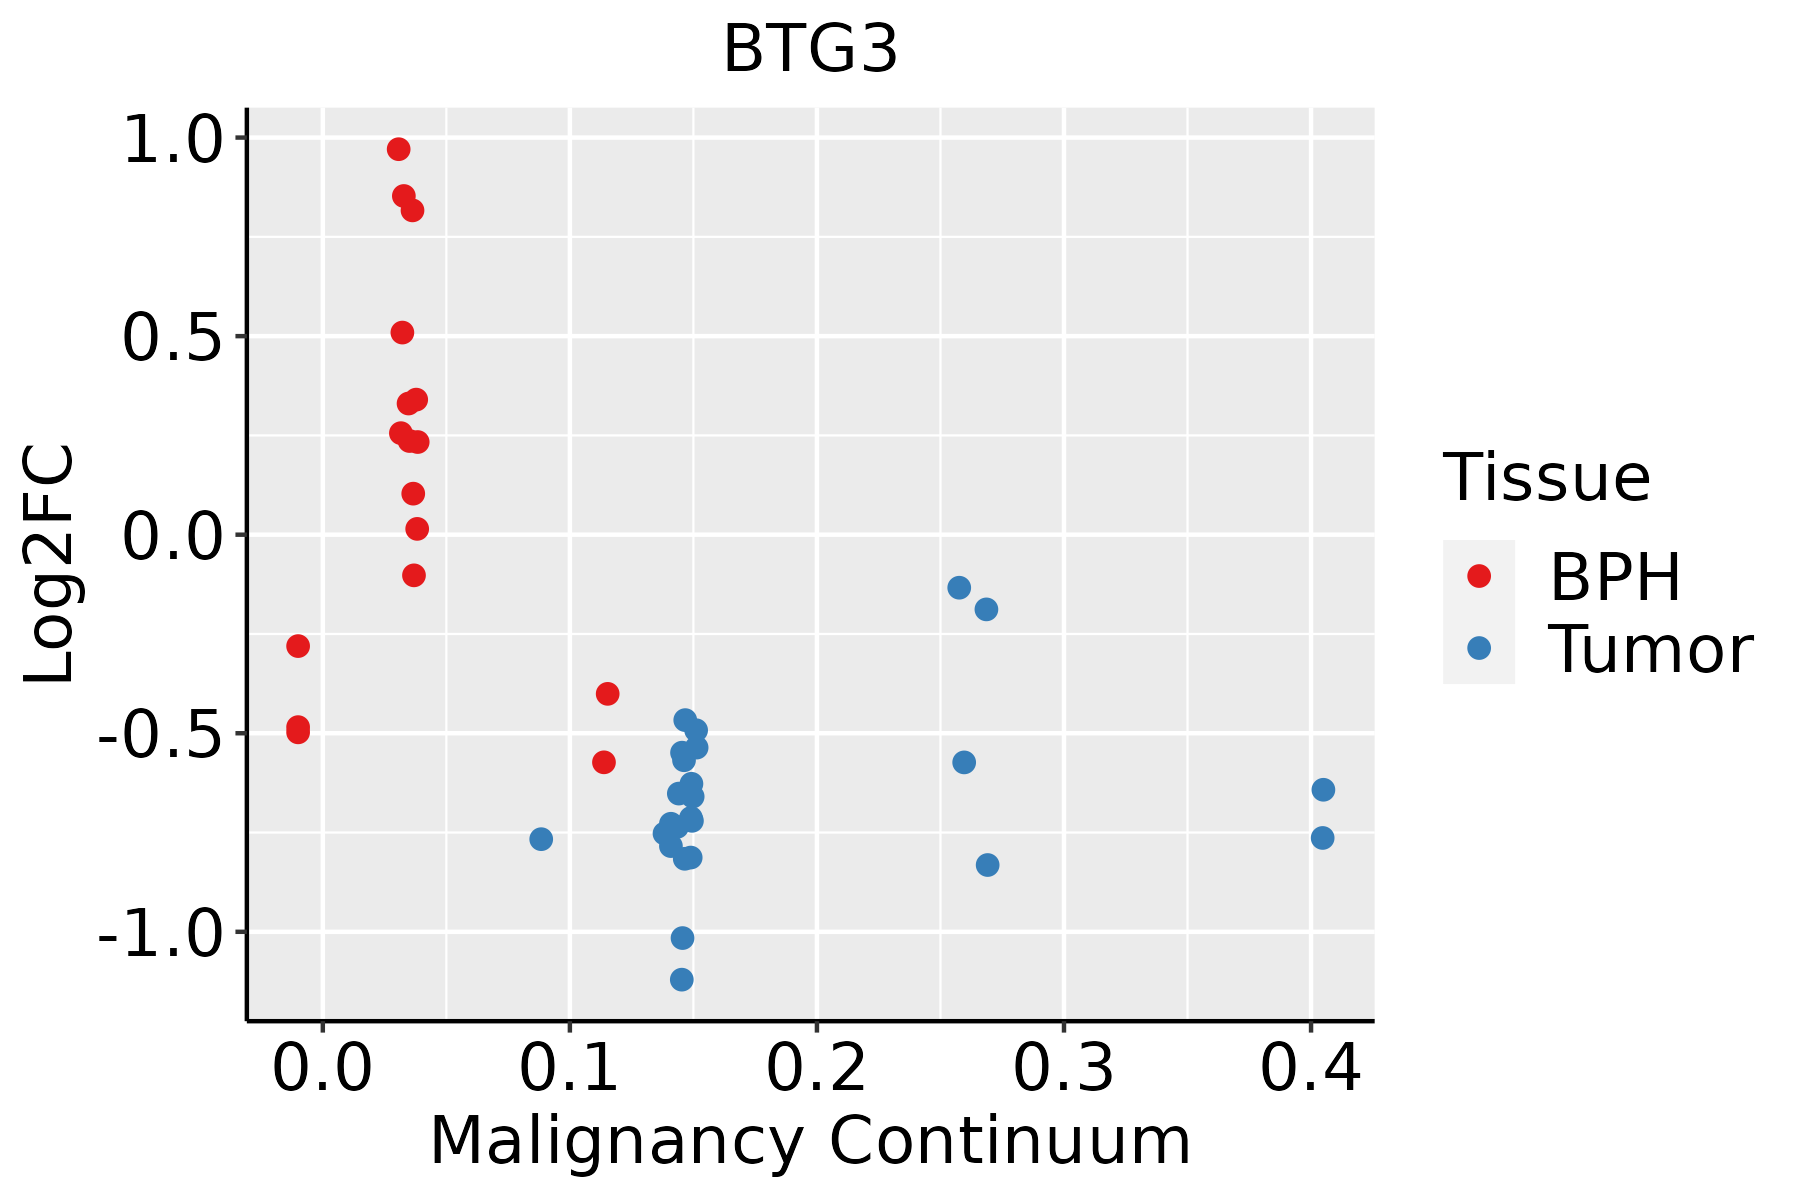 | BPH: Benign Prostatic Hyperplasia |
| Skin | 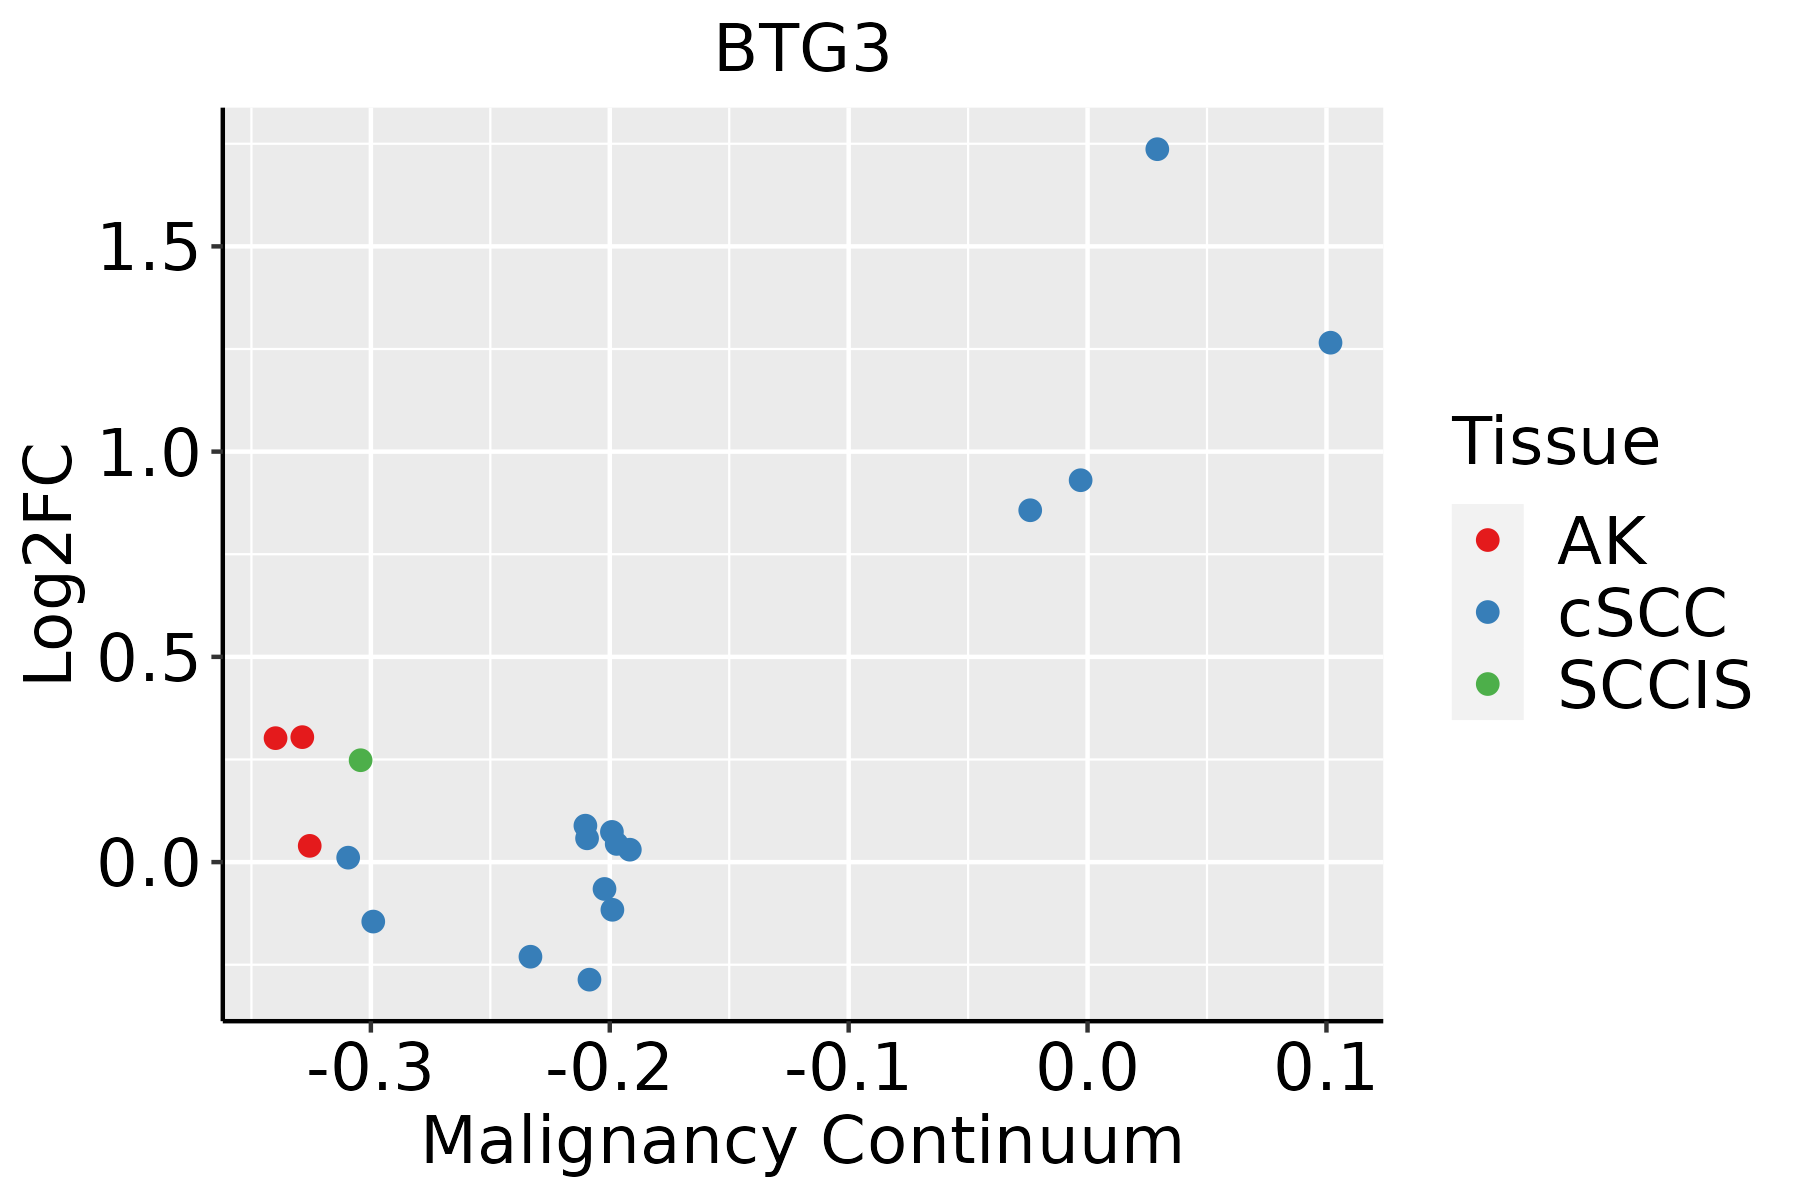 | AK: Actinic keratosis |
| cSCC: Cutaneous squamous cell carcinoma | ||
| SCCIS:squamous cell carcinoma in situ | ||
| Thyroid | 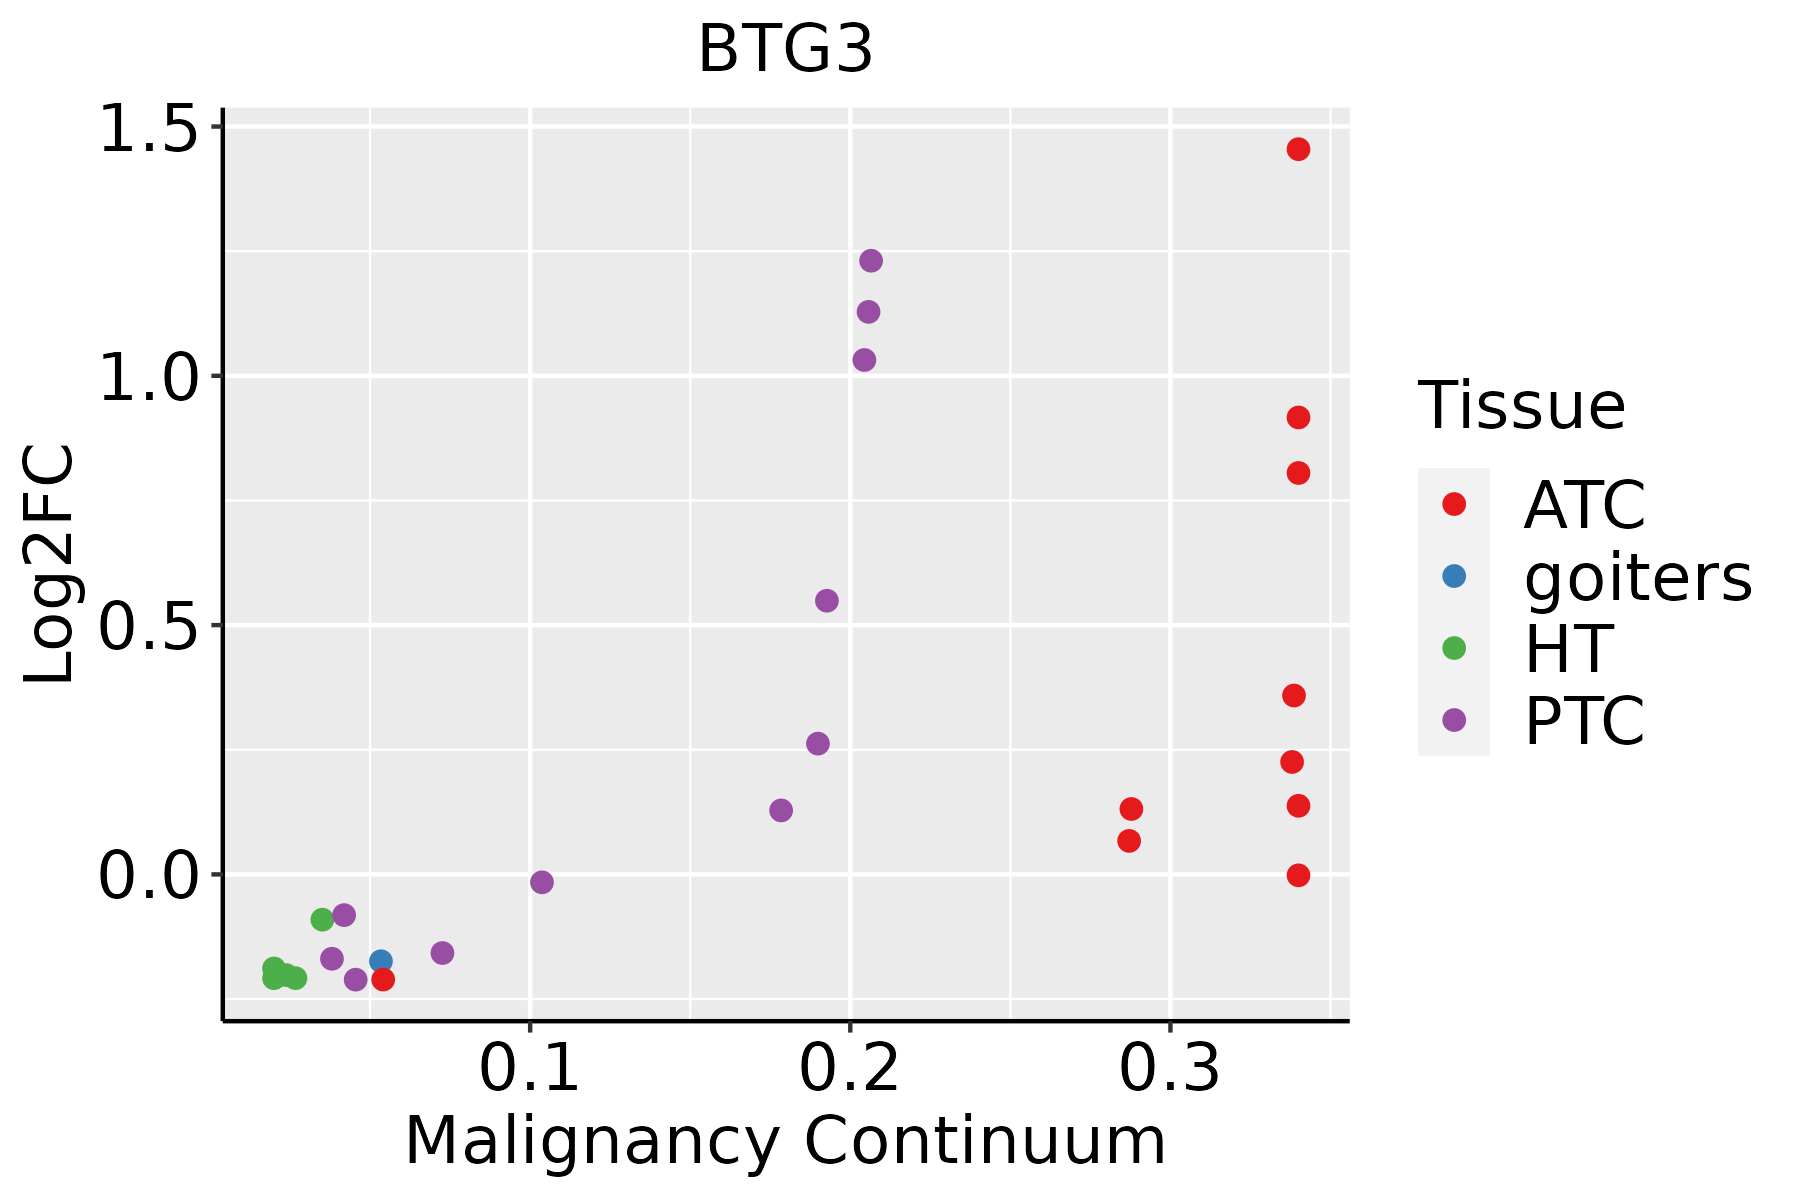 | ATC: Anaplastic thyroid cancer |
| HT: Hashimoto's thyroiditis | ||
| PTC: Papillary thyroid cancer |
| ∗log2FC in expression of this searched gene in stem-like cells from each diseased tissue sample relative to stem-like cells in normal samples in each tissue plotted against the malignancy continuum. Samples are colored based on if they are from different disease stage. |
Top |
Malignant transformation related pathway analysis |
| Find out the enriched GO biological processes and KEGG pathways involved in transition from healthy to precancer to cancer |
| Tissue | Disease Stage | Enriched GO biological Processes |
| Colorectum | AD |  |
| Colorectum | SER |  |
| Colorectum | MSS |  |
| Colorectum | MSI-H |  |
| Colorectum | FAP |  |
| ∗Top 15 enriched GO BP terms are showed in the bar plot of each disease state in each tissue. Each row represents a significant GO biological process which is colored according to the -log10(p.adjust). |
| Page: 1 2 3 4 5 6 7 8 9 |
| GO ID | Tissue | Disease Stage | Description | Gene Ratio | Bg Ratio | pvalue | p.adjust | Count |
| GO:00073465 | Breast | IDC | regulation of mitotic cell cycle | 51/1434 | 457/18723 | 4.30e-03 | 3.35e-02 | 51 |
| GO:000734612 | Breast | DCIS | regulation of mitotic cell cycle | 52/1390 | 457/18723 | 1.38e-03 | 1.43e-02 | 52 |
| GO:00073467 | Endometrium | EEC | regulation of mitotic cell cycle | 70/2168 | 457/18723 | 8.76e-03 | 4.74e-02 | 70 |
| GO:000734615 | Esophagus | ESCC | regulation of mitotic cell cycle | 293/8552 | 457/18723 | 8.00e-16 | 5.64e-14 | 293 |
| GO:00457865 | Esophagus | ESCC | negative regulation of cell cycle | 236/8552 | 385/18723 | 3.62e-10 | 9.93e-09 | 236 |
| GO:004593013 | Esophagus | ESCC | negative regulation of mitotic cell cycle | 143/8552 | 235/18723 | 1.84e-06 | 2.15e-05 | 143 |
| GO:00073463 | Liver | Cirrhotic | regulation of mitotic cell cycle | 154/4634 | 457/18723 | 8.73e-06 | 1.29e-04 | 154 |
| GO:000734611 | Liver | HCC | regulation of mitotic cell cycle | 255/7958 | 457/18723 | 4.96e-09 | 1.30e-07 | 255 |
| GO:0045786 | Liver | HCC | negative regulation of cell cycle | 204/7958 | 385/18723 | 1.84e-05 | 1.99e-04 | 204 |
| GO:0045930 | Liver | HCC | negative regulation of mitotic cell cycle | 130/7958 | 235/18723 | 4.69e-05 | 4.50e-04 | 130 |
| GO:00073464 | Lung | IAC | regulation of mitotic cell cycle | 78/2061 | 457/18723 | 5.37e-05 | 1.21e-03 | 78 |
| GO:00457861 | Lung | IAC | negative regulation of cell cycle | 67/2061 | 385/18723 | 9.74e-05 | 1.93e-03 | 67 |
| GO:00459301 | Lung | IAC | negative regulation of mitotic cell cycle | 45/2061 | 235/18723 | 1.49e-04 | 2.73e-03 | 45 |
| GO:00073469 | Oral cavity | OSCC | regulation of mitotic cell cycle | 266/7305 | 457/18723 | 3.87e-17 | 3.41e-15 | 266 |
| GO:00457864 | Oral cavity | OSCC | negative regulation of cell cycle | 206/7305 | 385/18723 | 4.28e-09 | 9.55e-08 | 206 |
| GO:00459304 | Oral cavity | OSCC | negative regulation of mitotic cell cycle | 132/7305 | 235/18723 | 6.51e-08 | 1.16e-06 | 132 |
| GO:000734614 | Oral cavity | LP | regulation of mitotic cell cycle | 163/4623 | 457/18723 | 7.64e-08 | 2.56e-06 | 163 |
| GO:004578612 | Oral cavity | LP | negative regulation of cell cycle | 127/4623 | 385/18723 | 1.33e-04 | 1.53e-03 | 127 |
| GO:004593012 | Oral cavity | LP | negative regulation of mitotic cell cycle | 83/4623 | 235/18723 | 1.62e-04 | 1.82e-03 | 83 |
| GO:000734621 | Oral cavity | EOLP | regulation of mitotic cell cycle | 82/2218 | 457/18723 | 7.50e-05 | 9.14e-04 | 82 |
| Page: 1 2 |
| Pathway ID | Tissue | Disease Stage | Description | Gene Ratio | Bg Ratio | pvalue | p.adjust | qvalue | Count |
| hsa0301821 | Breast | IDC | RNA degradation | 16/867 | 79/8465 | 5.65e-03 | 3.13e-02 | 2.34e-02 | 16 |
| hsa0301831 | Breast | IDC | RNA degradation | 16/867 | 79/8465 | 5.65e-03 | 3.13e-02 | 2.34e-02 | 16 |
| hsa030184 | Breast | DCIS | RNA degradation | 16/846 | 79/8465 | 4.45e-03 | 2.46e-02 | 1.82e-02 | 16 |
| hsa030185 | Breast | DCIS | RNA degradation | 16/846 | 79/8465 | 4.45e-03 | 2.46e-02 | 1.82e-02 | 16 |
| hsa030187 | Endometrium | EEC | RNA degradation | 20/1237 | 79/8465 | 8.36e-03 | 3.88e-02 | 2.89e-02 | 20 |
| hsa0301812 | Endometrium | EEC | RNA degradation | 20/1237 | 79/8465 | 8.36e-03 | 3.88e-02 | 2.89e-02 | 20 |
| hsa0301824 | Esophagus | ESCC | RNA degradation | 62/4205 | 79/8465 | 1.18e-07 | 9.39e-07 | 4.81e-07 | 62 |
| hsa0301834 | Esophagus | ESCC | RNA degradation | 62/4205 | 79/8465 | 1.18e-07 | 9.39e-07 | 4.81e-07 | 62 |
| hsa03018 | Liver | Cirrhotic | RNA degradation | 44/2530 | 79/8465 | 1.43e-06 | 1.65e-05 | 1.02e-05 | 44 |
| hsa030181 | Liver | Cirrhotic | RNA degradation | 44/2530 | 79/8465 | 1.43e-06 | 1.65e-05 | 1.02e-05 | 44 |
| hsa030182 | Liver | HCC | RNA degradation | 58/4020 | 79/8465 | 2.29e-06 | 2.19e-05 | 1.22e-05 | 58 |
| hsa030183 | Liver | HCC | RNA degradation | 58/4020 | 79/8465 | 2.29e-06 | 2.19e-05 | 1.22e-05 | 58 |
| hsa030189 | Oral cavity | OSCC | RNA degradation | 59/3704 | 79/8465 | 2.05e-08 | 1.91e-07 | 9.70e-08 | 59 |
| hsa0301814 | Oral cavity | OSCC | RNA degradation | 59/3704 | 79/8465 | 2.05e-08 | 1.91e-07 | 9.70e-08 | 59 |
| hsa0301823 | Oral cavity | LP | RNA degradation | 39/2418 | 79/8465 | 6.98e-05 | 4.38e-04 | 2.83e-04 | 39 |
| hsa0301833 | Oral cavity | LP | RNA degradation | 39/2418 | 79/8465 | 6.98e-05 | 4.38e-04 | 2.83e-04 | 39 |
| hsa0301841 | Oral cavity | EOLP | RNA degradation | 22/1218 | 79/8465 | 1.33e-03 | 4.80e-03 | 2.83e-03 | 22 |
| hsa0301851 | Oral cavity | EOLP | RNA degradation | 22/1218 | 79/8465 | 1.33e-03 | 4.80e-03 | 2.83e-03 | 22 |
| hsa030188 | Prostate | BPH | RNA degradation | 29/1718 | 79/8465 | 5.17e-04 | 2.67e-03 | 1.65e-03 | 29 |
| hsa0301813 | Prostate | BPH | RNA degradation | 29/1718 | 79/8465 | 5.17e-04 | 2.67e-03 | 1.65e-03 | 29 |
| Page: 1 2 |
Top |
Cell-cell communication analysis |
| Identification of potential cell-cell interactions between two cell types and their ligand-receptor pairs for different disease states |
| Ligand | Receptor | LRpair | Pathway | Tissue | Disease Stage |
| Page: 1 |
Top |
Single-cell gene regulatory network inference analysis |
| Find out the significant the regulons (TFs) and the target genes of each regulon across cell types for different disease states |
| TF | Cell Type | Tissue | Disease Stage | Target Gene | RSS | Regulon Activity |
| ∗The dot plots of a searched regulon are shown for all cell subpopulations in each disease state of each tissue based on the regulon specific score inferred using pySCENIC and by calculating the average expression. |
| Page: 1 |
Top |
Somatic mutation of malignant transformation related genes |
| Annotation of somatic variants for genes involved in malignant transformation |
| Hugo Symbol | Variant Class | Variant Classification | dbSNP RS | HGVSc | HGVSp | HGVSp Short | SWISSPROT | BIOTYPE | SIFT | PolyPhen | Tumor Sample Barcode | Tissue | Histology | Sex | Age | Stage | Therapy Types | Drugs | Outcome |
| BTG3 | SNV | Missense_Mutation | c.560N>C | p.His187Pro | p.H187P | Q14201 | protein_coding | tolerated(0.11) | probably_damaging(0.998) | TCGA-A2-A1G1-01 | Breast | breast invasive carcinoma | Female | >=65 | I/II | Unknown | Unknown | SD | |
| BTG3 | SNV | Missense_Mutation | c.464N>T | p.Ala155Val | p.A155V | Q14201 | protein_coding | deleterious(0.04) | possibly_damaging(0.794) | TCGA-AR-A0U0-01 | Breast | breast invasive carcinoma | Female | >=65 | I/II | Unknown | Unknown | SD | |
| BTG3 | deletion | Frame_Shift_Del | novel | c.791delN | p.Asn264IlefsTer9 | p.N264Ifs*9 | Q14201 | protein_coding | TCGA-EW-A2FV-01 | Breast | breast invasive carcinoma | Female | <65 | III/IV | Chemotherapy | docetaxel | SD | ||
| BTG3 | SNV | Missense_Mutation | c.817N>G | p.Thr273Ala | p.T273A | Q14201 | protein_coding | tolerated(0.51) | probably_damaging(0.953) | TCGA-D5-6930-01 | Colorectum | colon adenocarcinoma | Male | >=65 | I/II | Unknown | Unknown | SD | |
| BTG3 | SNV | Missense_Mutation | c.451N>C | p.Glu151Gln | p.E151Q | Q14201 | protein_coding | deleterious(0) | possibly_damaging(0.808) | TCGA-RU-A8FL-01 | Colorectum | colon adenocarcinoma | Male | <65 | III/IV | Chemotherapy | folfox | PD | |
| BTG3 | deletion | Frame_Shift_Del | c.1delN | p.Met1? | p.M1? | Q14201 | protein_coding | TCGA-AD-5900-01 | Colorectum | colon adenocarcinoma | Male | >=65 | I/II | Unknown | Unknown | SD | |||
| BTG3 | SNV | Missense_Mutation | rs542747898 | c.802C>T | p.Arg268Cys | p.R268C | Q14201 | protein_coding | deleterious(0.04) | probably_damaging(0.973) | TCGA-AP-A0LM-01 | Endometrium | uterine corpus endometrioid carcinoma | Female | <65 | III/IV | Chemotherapy | cisplatin | SD |
| BTG3 | SNV | Missense_Mutation | c.510G>T | p.Glu170Asp | p.E170D | Q14201 | protein_coding | tolerated(0.2) | benign(0.003) | TCGA-AP-A0LM-01 | Endometrium | uterine corpus endometrioid carcinoma | Female | <65 | III/IV | Chemotherapy | cisplatin | SD | |
| BTG3 | SNV | Missense_Mutation | c.851G>T | p.Arg284Leu | p.R284L | Q14201 | protein_coding | deleterious(0.03) | possibly_damaging(0.501) | TCGA-AX-A064-01 | Endometrium | uterine corpus endometrioid carcinoma | Female | >=65 | I/II | Unknown | Unknown | SD | |
| BTG3 | SNV | Missense_Mutation | novel | c.830C>A | p.Pro277His | p.P277H | Q14201 | protein_coding | tolerated(0.06) | probably_damaging(0.998) | TCGA-AX-A2HC-01 | Endometrium | uterine corpus endometrioid carcinoma | Female | <65 | III/IV | Chemotherapy | paclitaxel | PD |
| Page: 1 2 3 4 |
Top |
Related drugs of malignant transformation related genes |
| Identification of chemicals and drugs interact with genes involved in malignant transfromation |
| (DGIdb 4.0) |
| Entrez ID | Symbol | Category | Interaction Types | Drug Claim Name | Drug Name | PMIDs |
| Page: 1 |

Copyright 2023-Present -The University of Texas Health Science Center at Houston |