
|
|||||
|
 | |
| |
| |
| |
| |
| |
|
Gene: BTD |
Gene summary for BTD |
| Gene information | Species | Human | Gene symbol | BTD | Gene ID | 686 |
| Gene name | biotinidase | |
| Gene Alias | BTD | |
| Cytomap | 3p25.1 | |
| Gene Type | protein-coding | GO ID | GO:0006082 | UniProtAcc | P43251 |
Top |
Malignant transformation analysis |
| Identification of the aberrant gene expression in precancerous and cancerous lesions by comparing the gene expression of stem-like cells in diseased tissues with normal stem cells |
| Entrez ID | Symbol | Replicates | Species | Organ | Tissue | Adj P-value | Log2FC | Malignancy |
| 686 | BTD | HCC1_Meng | Human | Liver | HCC | 3.64e-37 | 1.25e-02 | 0.0246 |
| 686 | BTD | cirrhotic1 | Human | Liver | Cirrhotic | 3.78e-03 | 1.55e-01 | 0.0202 |
| 686 | BTD | HCC1 | Human | Liver | HCC | 5.50e-04 | 2.91e+00 | 0.5336 |
| 686 | BTD | HCC2 | Human | Liver | HCC | 6.73e-08 | 2.64e+00 | 0.5341 |
| 686 | BTD | S014 | Human | Liver | HCC | 6.00e-16 | 5.86e-01 | 0.2254 |
| 686 | BTD | S015 | Human | Liver | HCC | 2.54e-17 | 7.28e-01 | 0.2375 |
| 686 | BTD | S016 | Human | Liver | HCC | 4.10e-20 | 6.14e-01 | 0.2243 |
| 686 | BTD | S028 | Human | Liver | HCC | 5.35e-14 | 4.28e-01 | 0.2503 |
| 686 | BTD | S029 | Human | Liver | HCC | 5.44e-12 | 4.19e-01 | 0.2581 |
| 686 | BTD | RNA-P10T2-P10T2-1 | Human | Lung | AAH | 4.60e-02 | 7.41e-01 | -0.1271 |
| 686 | BTD | RNA-P10T2-P10T2-3 | Human | Lung | AAH | 2.11e-03 | 6.95e-01 | -0.1408 |
| 686 | BTD | RNA-P17T-P17T-4 | Human | Lung | IAC | 4.45e-02 | 5.20e-01 | 0.343 |
| 686 | BTD | RNA-P17T-P17T-6 | Human | Lung | IAC | 1.52e-05 | 6.28e-01 | 0.3385 |
| 686 | BTD | RNA-P17T-P17T-8 | Human | Lung | IAC | 2.71e-03 | 4.47e-01 | 0.3329 |
| 686 | BTD | RNA-P25T1-P25T1-4 | Human | Lung | AIS | 7.83e-05 | 3.91e-01 | -0.2119 |
| 686 | BTD | RNA-P6T2-P6T2-2 | Human | Lung | IAC | 6.25e-05 | 2.55e-01 | -0.0132 |
| 686 | BTD | RNA-P6T2-P6T2-3 | Human | Lung | IAC | 1.63e-05 | 2.13e-01 | -0.013 |
| 686 | BTD | RNA-P6T2-P6T2-4 | Human | Lung | IAC | 1.11e-03 | 2.43e-01 | -0.0121 |
| 686 | BTD | RNA-P7T1-P7T1-1 | Human | Lung | AIS | 3.07e-04 | 4.95e-01 | -0.0961 |
| 686 | BTD | RNA-P7T1-P7T1-2 | Human | Lung | AIS | 5.94e-07 | 6.35e-01 | -0.0876 |
| Page: 1 2 |
| Tissue | Expression Dynamics | Abbreviation |
| Liver | 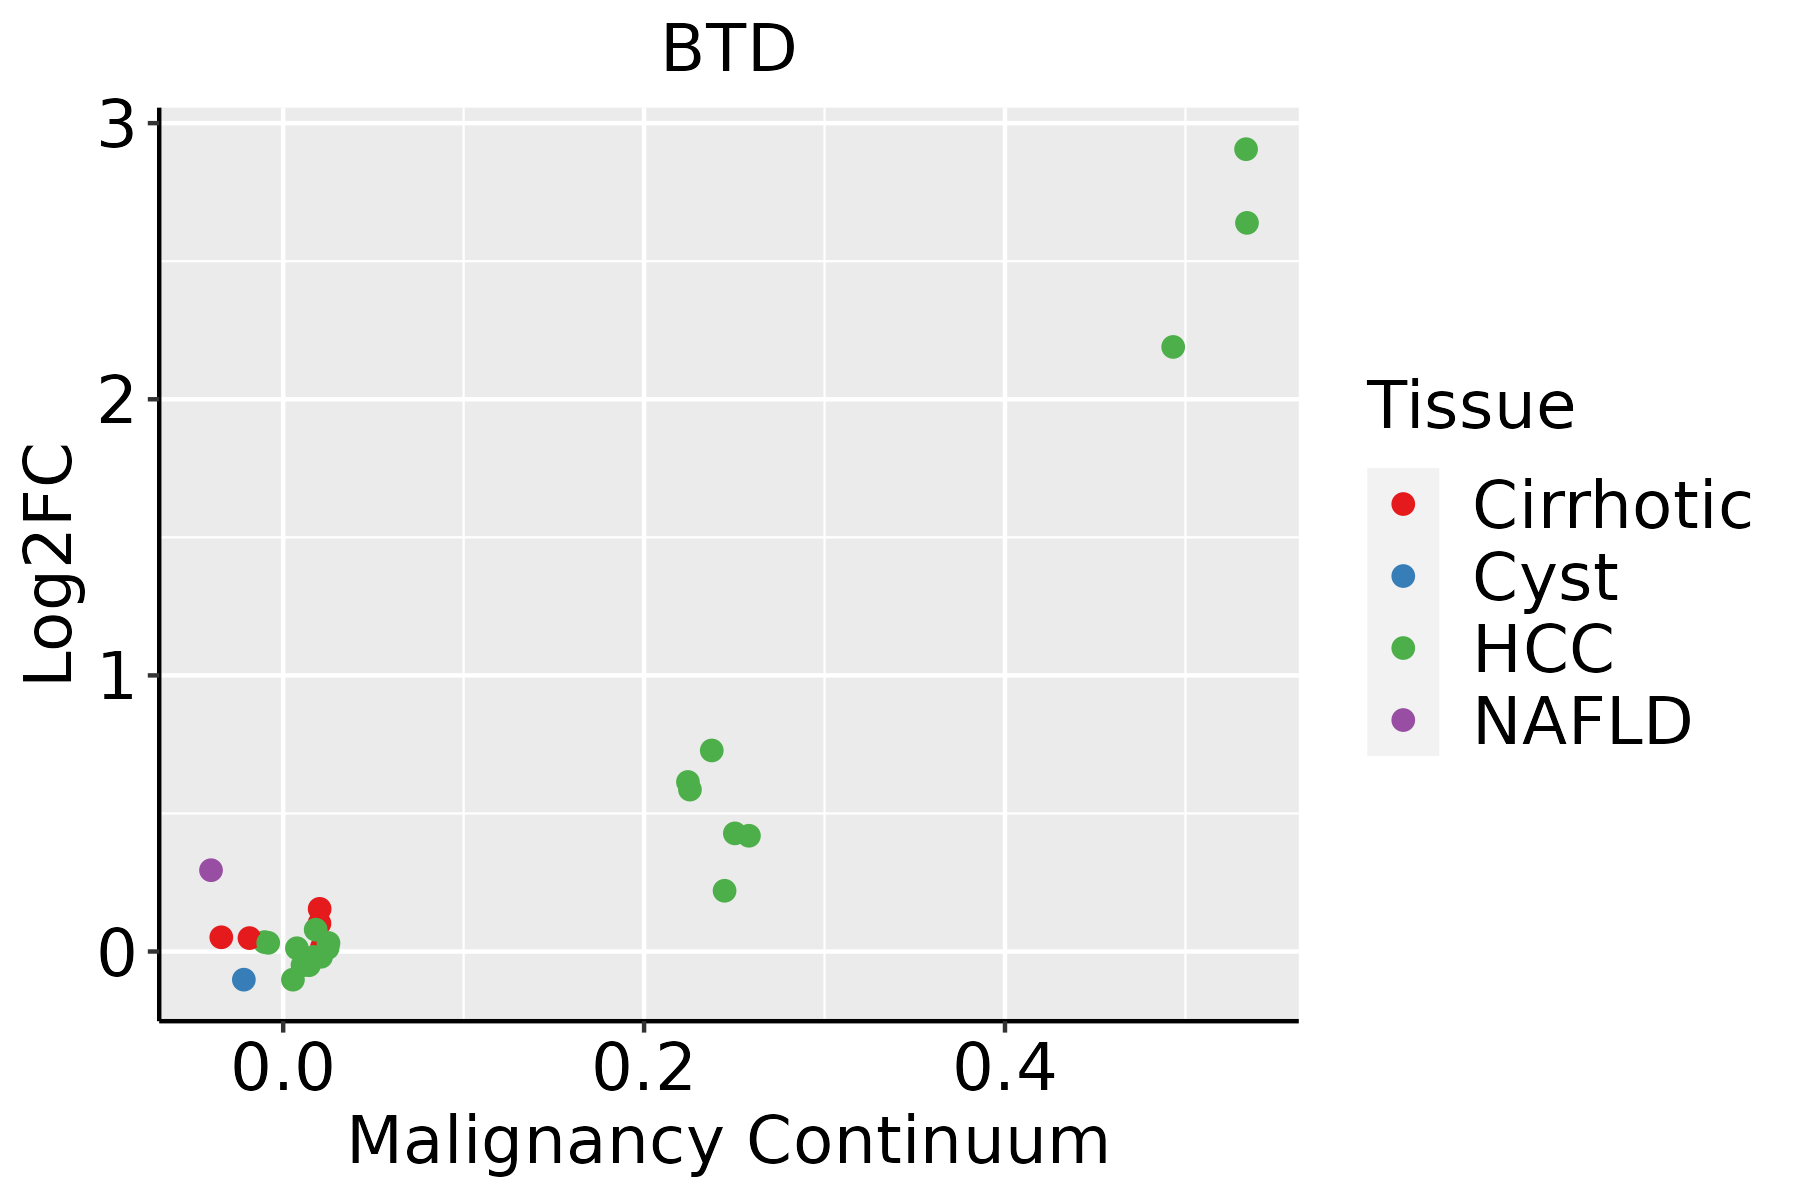 | HCC: Hepatocellular carcinoma |
| NAFLD: Non-alcoholic fatty liver disease | ||
| Lung | 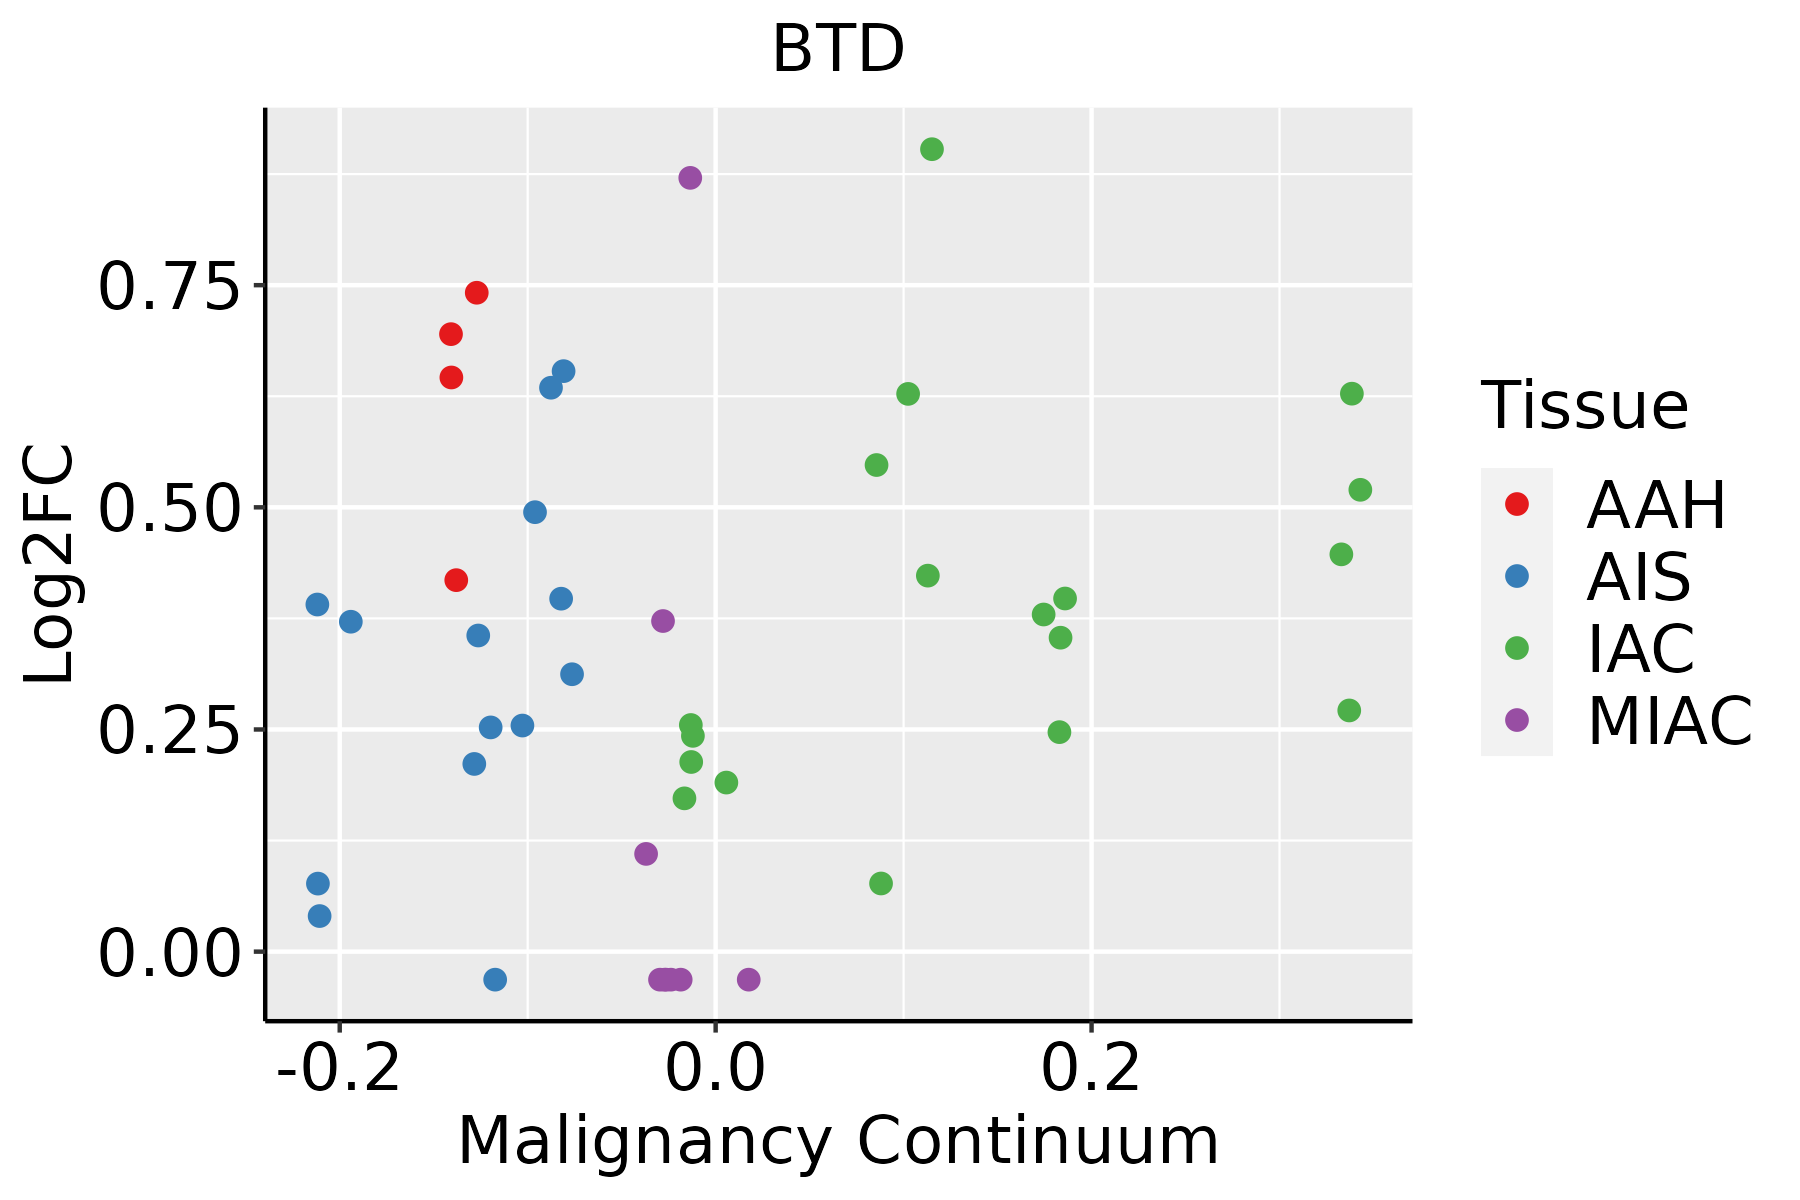 | AAH: Atypical adenomatous hyperplasia |
| AIS: Adenocarcinoma in situ | ||
| IAC: Invasive lung adenocarcinoma | ||
| MIA: Minimally invasive adenocarcinoma |
| ∗log2FC in expression of this searched gene in stem-like cells from each diseased tissue sample relative to stem-like cells in normal samples in each tissue plotted against the malignancy continuum. Samples are colored based on if they are from different disease stage. |
Top |
Malignant transformation related pathway analysis |
| Find out the enriched GO biological processes and KEGG pathways involved in transition from healthy to precancer to cancer |
| Tissue | Disease Stage | Enriched GO biological Processes |
| Colorectum | AD |  |
| Colorectum | SER |  |
| Colorectum | MSS |  |
| Colorectum | MSI-H |  |
| Colorectum | FAP |  |
| ∗Top 15 enriched GO BP terms are showed in the bar plot of each disease state in each tissue. Each row represents a significant GO biological process which is colored according to the -log10(p.adjust). |
| Page: 1 2 3 4 5 6 7 8 9 |
| GO ID | Tissue | Disease Stage | Description | Gene Ratio | Bg Ratio | pvalue | p.adjust | Count |
| GO:00063257 | Cervix | CC | chromatin organization | 78/2311 | 409/18723 | 5.40e-05 | 8.02e-04 | 78 |
| GO:000679011 | Liver | Cirrhotic | sulfur compound metabolic process | 129/4634 | 339/18723 | 3.06e-08 | 1.04e-06 | 129 |
| GO:000679021 | Liver | HCC | sulfur compound metabolic process | 212/7958 | 339/18723 | 5.60e-14 | 3.39e-12 | 212 |
| GO:0006767 | Liver | HCC | water-soluble vitamin metabolic process | 39/7958 | 59/18723 | 2.14e-04 | 1.63e-03 | 39 |
| GO:0006766 | Liver | HCC | vitamin metabolic process | 57/7958 | 106/18723 | 1.25e-02 | 4.53e-02 | 57 |
| Page: 1 |
| Pathway ID | Tissue | Disease Stage | Description | Gene Ratio | Bg Ratio | pvalue | p.adjust | qvalue | Count |
| Page: 1 |
Top |
Cell-cell communication analysis |
| Identification of potential cell-cell interactions between two cell types and their ligand-receptor pairs for different disease states |
| Ligand | Receptor | LRpair | Pathway | Tissue | Disease Stage |
| Page: 1 |
Top |
Single-cell gene regulatory network inference analysis |
| Find out the significant the regulons (TFs) and the target genes of each regulon across cell types for different disease states |
| TF | Cell Type | Tissue | Disease Stage | Target Gene | RSS | Regulon Activity |
| ∗The dot plots of a searched regulon are shown for all cell subpopulations in each disease state of each tissue based on the regulon specific score inferred using pySCENIC and by calculating the average expression. |
| Page: 1 |
Top |
Somatic mutation of malignant transformation related genes |
| Annotation of somatic variants for genes involved in malignant transformation |
| Hugo Symbol | Variant Class | Variant Classification | dbSNP RS | HGVSc | HGVSp | HGVSp Short | SWISSPROT | BIOTYPE | SIFT | PolyPhen | Tumor Sample Barcode | Tissue | Histology | Sex | Age | Stage | Therapy Types | Drugs | Outcome |
| BTD | SNV | Missense_Mutation | novel | c.1572G>T | p.Arg524Ser | p.R524S | P43251 | protein_coding | tolerated(1) | benign(0.003) | TCGA-5L-AAT1-01 | Breast | breast invasive carcinoma | Female | <65 | III/IV | Hormone Therapy | letrozol | SD |
| BTD | SNV | Missense_Mutation | c.1015N>A | p.Val339Met | p.V339M | P43251 | protein_coding | deleterious(0.02) | probably_damaging(0.919) | TCGA-A2-A04T-01 | Breast | breast invasive carcinoma | Female | <65 | I/II | Chemotherapy | cyclophosphamide | SD | |
| BTD | SNV | Missense_Mutation | c.226N>G | p.Leu76Val | p.L76V | P43251 | protein_coding | tolerated(0.28) | benign(0.268) | TCGA-A2-A0CX-01 | Breast | breast invasive carcinoma | Female | <65 | I/II | Chemotherapy | adriamycin | SD | |
| BTD | SNV | Missense_Mutation | c.1402N>G | p.Leu468Val | p.L468V | P43251 | protein_coding | tolerated(0.29) | benign(0.049) | TCGA-A8-A094-01 | Breast | breast invasive carcinoma | Female | >=65 | I/II | Unknown | Unknown | SD | |
| BTD | SNV | Missense_Mutation | rs397514340 | c.196G>A | p.Glu66Lys | p.E66K | P43251 | protein_coding | deleterious(0.01) | probably_damaging(0.998) | TCGA-AR-A24Q-01 | Breast | breast invasive carcinoma | Female | <65 | I/II | Chemotherapy | doxorubicin | SD |
| BTD | SNV | Missense_Mutation | rs397514419 | c.1358G>A | p.Gly453Asp | p.G453D | P43251 | protein_coding | deleterious(0.02) | possibly_damaging(0.601) | TCGA-E9-A5FL-01 | Breast | breast invasive carcinoma | Female | >=65 | I/II | Unknown | Unknown | SD |
| BTD | SNV | Missense_Mutation | rs397514418 | c.1345N>T | p.His449Tyr | p.H449Y | P43251 | protein_coding | deleterious(0.02) | probably_damaging(0.998) | TCGA-C5-A902-01 | Cervix | cervical & endocervical cancer | Female | <65 | I/II | Chemotherapy | cisplatin | SD |
| BTD | SNV | Missense_Mutation | c.1402N>G | p.Leu468Val | p.L468V | P43251 | protein_coding | tolerated(0.29) | benign(0.049) | TCGA-EK-A2PM-01 | Cervix | cervical & endocervical cancer | Female | >=65 | I/II | Unknown | Unknown | SD | |
| BTD | SNV | Missense_Mutation | novel | c.43N>G | p.Leu15Val | p.L15V | P43251 | protein_coding | tolerated_low_confidence(0.36) | benign(0) | TCGA-FU-A3HZ-01 | Cervix | cervical & endocervical cancer | Female | <65 | I/II | Chemotherapy | cisplatin | CR |
| BTD | SNV | Missense_Mutation | c.986N>C | p.Asn329Thr | p.N329T | P43251 | protein_coding | tolerated(1) | benign(0.001) | TCGA-FU-A3HZ-01 | Cervix | cervical & endocervical cancer | Female | <65 | I/II | Chemotherapy | cisplatin | CR |
| Page: 1 2 3 4 5 6 7 |
Top |
Related drugs of malignant transformation related genes |
| Identification of chemicals and drugs interact with genes involved in malignant transfromation |
| (DGIdb 4.0) |
| Entrez ID | Symbol | Category | Interaction Types | Drug Claim Name | Drug Name | PMIDs |
| Page: 1 |

Copyright 2023-Present -The University of Texas Health Science Center at Houston |