
|
|||||
|
 | |
| |
| |
| |
| |
| |
|
Gene: BTC |
Gene summary for BTC |
| Gene information | Species | Human | Gene symbol | BTC | Gene ID | 685 |
| Gene name | betacellulin | |
| Gene Alias | BTC | |
| Cytomap | 4q13.3 | |
| Gene Type | protein-coding | GO ID | GO:0000278 | UniProtAcc | A0A0S2Z3I5 |
Top |
Malignant transformation analysis |
| Identification of the aberrant gene expression in precancerous and cancerous lesions by comparing the gene expression of stem-like cells in diseased tissues with normal stem cells |
| Entrez ID | Symbol | Replicates | Species | Organ | Tissue | Adj P-value | Log2FC | Malignancy |
| 685 | BTC | HCC1_Meng | Human | Liver | HCC | 3.86e-05 | 2.28e-03 | 0.0246 |
| 685 | BTC | HCC2_Meng | Human | Liver | HCC | 3.53e-14 | 9.98e-02 | 0.0107 |
| 685 | BTC | S027 | Human | Liver | HCC | 5.76e-13 | 8.54e-01 | 0.2446 |
| 685 | BTC | S028 | Human | Liver | HCC | 2.07e-30 | 1.10e+00 | 0.2503 |
| 685 | BTC | S029 | Human | Liver | HCC | 2.05e-19 | 7.24e-01 | 0.2581 |
| Page: 1 |
| Tissue | Expression Dynamics | Abbreviation |
| Liver | 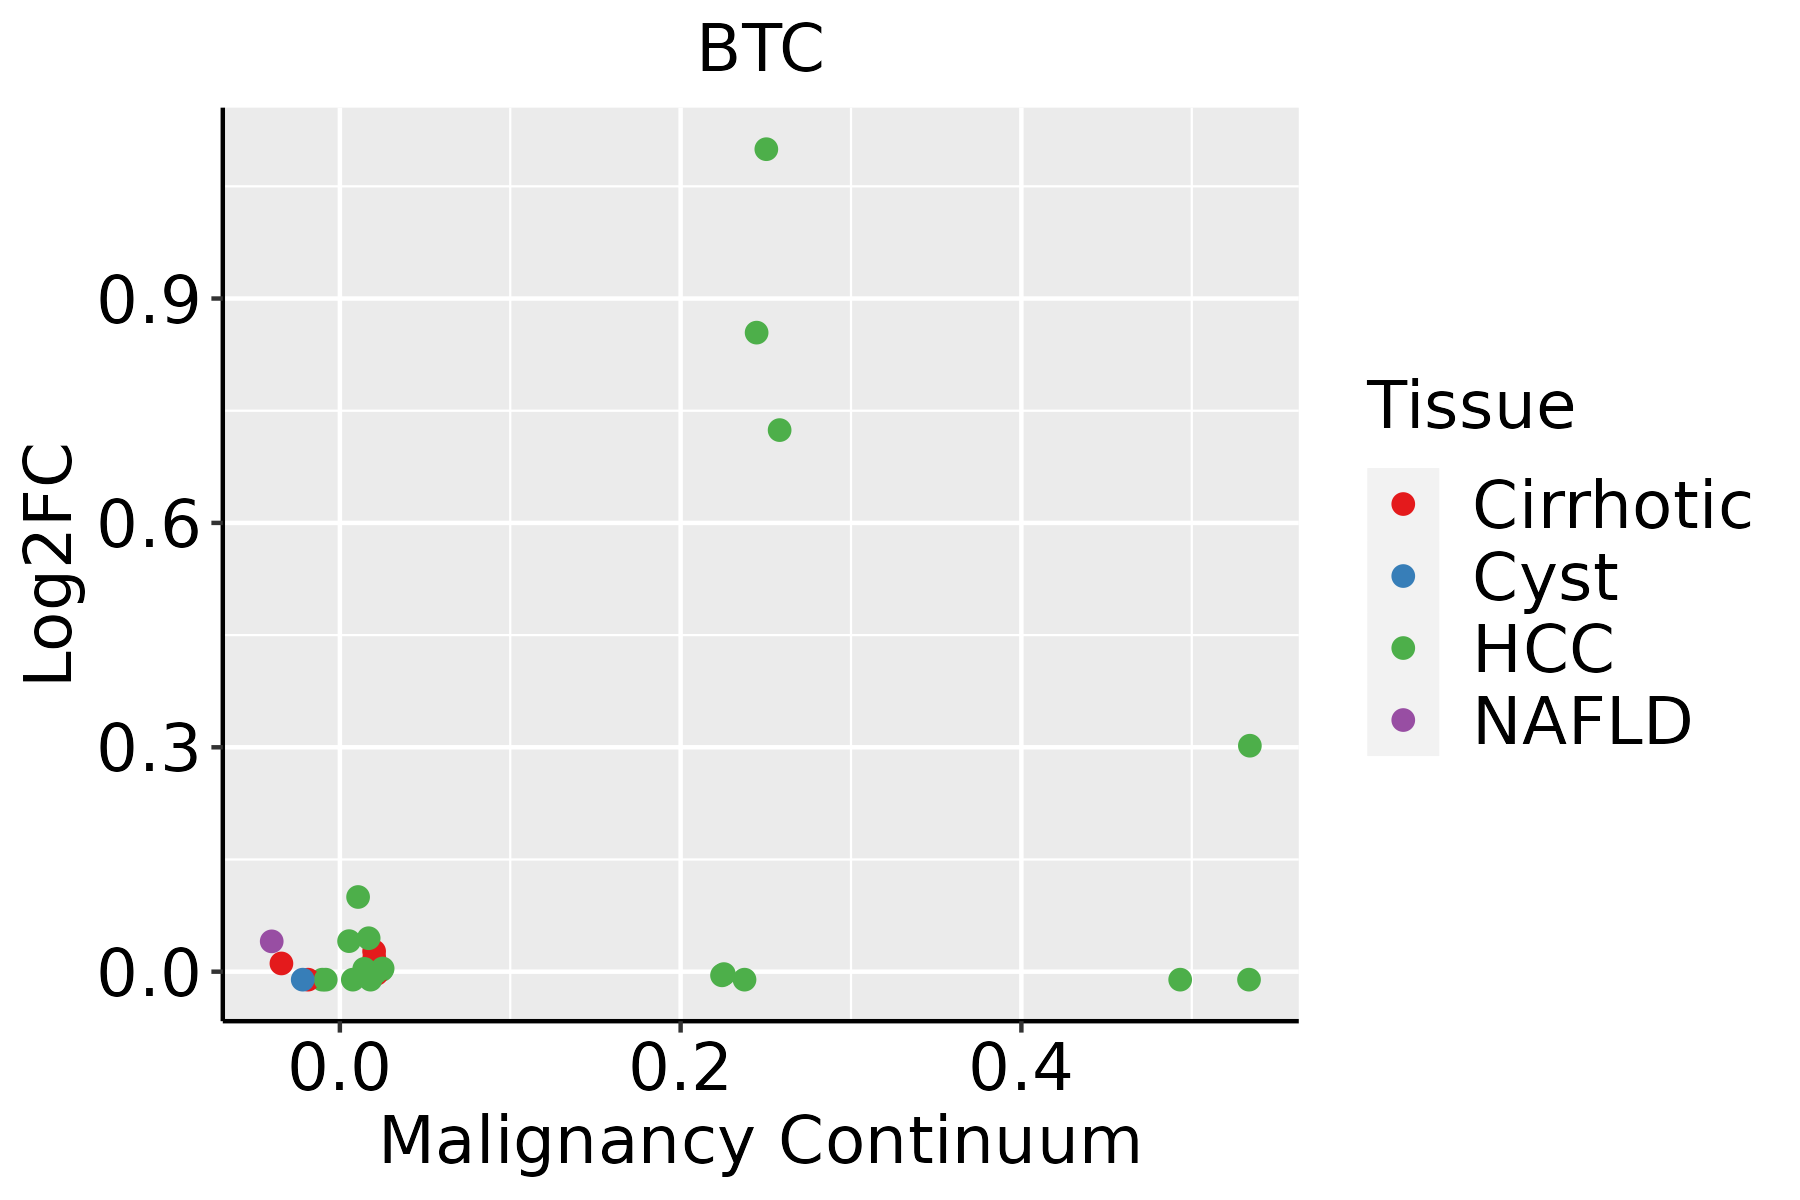 | HCC: Hepatocellular carcinoma |
| NAFLD: Non-alcoholic fatty liver disease |
| ∗log2FC in expression of this searched gene in stem-like cells from each diseased tissue sample relative to stem-like cells in normal samples in each tissue plotted against the malignancy continuum. Samples are colored based on if they are from different disease stage. |
Top |
Malignant transformation related pathway analysis |
| Find out the enriched GO biological processes and KEGG pathways involved in transition from healthy to precancer to cancer |
| Tissue | Disease Stage | Enriched GO biological Processes |
| Colorectum | AD |  |
| Colorectum | SER |  |
| Colorectum | MSS |  |
| Colorectum | MSI-H |  |
| Colorectum | FAP |  |
| ∗Top 15 enriched GO BP terms are showed in the bar plot of each disease state in each tissue. Each row represents a significant GO biological process which is colored according to the -log10(p.adjust). |
| Page: 1 2 3 4 5 6 7 8 9 |
| GO ID | Tissue | Disease Stage | Description | Gene Ratio | Bg Ratio | pvalue | p.adjust | Count |
| GO:014001411 | Liver | HCC | mitotic nuclear division | 174/7958 | 287/18723 | 3.74e-10 | 1.23e-08 | 174 |
| GO:000734611 | Liver | HCC | regulation of mitotic cell cycle | 255/7958 | 457/18723 | 4.96e-09 | 1.30e-07 | 255 |
| GO:004578711 | Liver | HCC | positive regulation of cell cycle | 172/7958 | 313/18723 | 5.29e-06 | 6.58e-05 | 172 |
| GO:0048285 | Liver | HCC | organelle fission | 254/7958 | 488/18723 | 1.07e-05 | 1.23e-04 | 254 |
| GO:003812721 | Liver | HCC | ERBB signaling pathway | 73/7958 | 121/18723 | 5.65e-05 | 5.26e-04 | 73 |
| GO:000717321 | Liver | HCC | epidermal growth factor receptor signaling pathway | 65/7958 | 108/18723 | 1.56e-04 | 1.25e-03 | 65 |
| GO:0000280 | Liver | HCC | nuclear division | 220/7958 | 439/18723 | 6.90e-04 | 4.25e-03 | 220 |
| GO:00900683 | Liver | HCC | positive regulation of cell cycle process | 125/7958 | 236/18723 | 7.21e-04 | 4.40e-03 | 125 |
| GO:005087822 | Liver | HCC | regulation of body fluid levels | 191/7958 | 379/18723 | 1.06e-03 | 6.11e-03 | 191 |
| GO:004586021 | Liver | HCC | positive regulation of protein kinase activity | 194/7958 | 386/18723 | 1.16e-03 | 6.54e-03 | 194 |
| GO:0007088 | Liver | HCC | regulation of mitotic nuclear division | 63/7958 | 110/18723 | 1.24e-03 | 6.85e-03 | 63 |
| GO:19011844 | Liver | HCC | regulation of ERBB signaling pathway | 47/7958 | 79/18723 | 1.71e-03 | 8.91e-03 | 47 |
| GO:003367411 | Liver | HCC | positive regulation of kinase activity | 230/7958 | 467/18723 | 1.72e-03 | 8.95e-03 | 230 |
| GO:00420584 | Liver | HCC | regulation of epidermal growth factor receptor signaling pathway | 43/7958 | 73/18723 | 3.43e-03 | 1.55e-02 | 43 |
| Page: 1 |
| Pathway ID | Tissue | Disease Stage | Description | Gene Ratio | Bg Ratio | pvalue | p.adjust | qvalue | Count |
| hsa040128 | Liver | HCC | ErbB signaling pathway | 54/4020 | 85/8465 | 2.02e-03 | 7.07e-03 | 3.93e-03 | 54 |
| hsa0401211 | Liver | HCC | ErbB signaling pathway | 54/4020 | 85/8465 | 2.02e-03 | 7.07e-03 | 3.93e-03 | 54 |
| Page: 1 |
Top |
Cell-cell communication analysis |
| Identification of potential cell-cell interactions between two cell types and their ligand-receptor pairs for different disease states |
| Ligand | Receptor | LRpair | Pathway | Tissue | Disease Stage |
| Page: 1 |
Top |
Single-cell gene regulatory network inference analysis |
| Find out the significant the regulons (TFs) and the target genes of each regulon across cell types for different disease states |
| TF | Cell Type | Tissue | Disease Stage | Target Gene | RSS | Regulon Activity |
| ∗The dot plots of a searched regulon are shown for all cell subpopulations in each disease state of each tissue based on the regulon specific score inferred using pySCENIC and by calculating the average expression. |
| Page: 1 |
Top |
Somatic mutation of malignant transformation related genes |
| Annotation of somatic variants for genes involved in malignant transformation |
| Hugo Symbol | Variant Class | Variant Classification | dbSNP RS | HGVSc | HGVSp | HGVSp Short | SWISSPROT | BIOTYPE | SIFT | PolyPhen | Tumor Sample Barcode | Tissue | Histology | Sex | Age | Stage | Therapy Types | Drugs | Outcome |
| BTC | SNV | Missense_Mutation | rs375367986 | c.185G>A | p.Arg62Gln | p.R62Q | P35070 | protein_coding | tolerated(0.28) | benign(0.354) | TCGA-A8-A0AD-01 | Breast | breast invasive carcinoma | Female | >=65 | I/II | Hormone Therapy | tamoxiphen | SD |
| BTC | SNV | Missense_Mutation | c.315G>C | p.Glu105Asp | p.E105D | P35070 | protein_coding | tolerated(0.05) | benign(0.417) | TCGA-DS-A0VM-01 | Cervix | cervical & endocervical cancer | Female | <65 | I/II | Chemotherapy | cisplatin | PD | |
| BTC | SNV | Missense_Mutation | rs782271380 | c.445N>T | p.Arg149Cys | p.R149C | P35070 | protein_coding | deleterious(0.04) | benign(0.049) | TCGA-A6-4105-01 | Colorectum | colon adenocarcinoma | Male | >=65 | I/II | Unknown | Unknown | PD |
| BTC | SNV | Missense_Mutation | rs782514658 | c.184N>T | p.Arg62Trp | p.R62W | P35070 | protein_coding | tolerated(0.17) | benign(0.003) | TCGA-AA-3864-01 | Colorectum | colon adenocarcinoma | Male | >=65 | I/II | Unknown | Unknown | SD |
| BTC | SNV | Missense_Mutation | novel | c.92C>T | p.Ala31Val | p.A31V | P35070 | protein_coding | deleterious(0) | possibly_damaging(0.88) | TCGA-A5-A2K3-01 | Endometrium | uterine corpus endometrioid carcinoma | Female | >=65 | I/II | Chemotherapy | carboplatin | SD |
| BTC | SNV | Missense_Mutation | rs782514658 | c.184C>T | p.Arg62Trp | p.R62W | P35070 | protein_coding | tolerated(0.17) | benign(0.003) | TCGA-AP-A051-01 | Endometrium | uterine corpus endometrioid carcinoma | Female | >=65 | I/II | Unknown | Unknown | SD |
| BTC | SNV | Missense_Mutation | novel | c.268N>G | p.Thr90Ala | p.T90A | P35070 | protein_coding | tolerated(0.38) | benign(0.057) | TCGA-B5-A3FA-01 | Endometrium | uterine corpus endometrioid carcinoma | Female | >=65 | I/II | Unknown | Unknown | SD |
| BTC | SNV | Missense_Mutation | rs376806249 | c.436C>T | p.Arg146Trp | p.R146W | P35070 | protein_coding | deleterious(0) | possibly_damaging(0.799) | TCGA-EO-A22X-01 | Endometrium | uterine corpus endometrioid carcinoma | Female | <65 | III/IV | Unspecific | Carboplatin | Complete Response |
| BTC | SNV | Missense_Mutation | novel | c.520G>A | p.Glu174Lys | p.E174K | P35070 | protein_coding | deleterious(0) | probably_damaging(0.99) | TCGA-CV-7433-01 | Oral cavity | head & neck squamous cell carcinoma | Male | <65 | I/II | Unknown | Unknown | PD |
| BTC | SNV | Missense_Mutation | novel | c.339A>T | p.Arg113Ser | p.R113S | P35070 | protein_coding | deleterious(0.01) | benign(0.225) | TCGA-F7-7848-01 | Oral cavity | head & neck squamous cell carcinoma | Male | <65 | I/II | Unknown | Unknown | SD |
| Page: 1 2 |
Top |
Related drugs of malignant transformation related genes |
| Identification of chemicals and drugs interact with genes involved in malignant transfromation |
| (DGIdb 4.0) |
| Entrez ID | Symbol | Category | Interaction Types | Drug Claim Name | Drug Name | PMIDs |
| 685 | BTC | DRUGGABLE GENOME, GROWTH FACTOR | panitumumab | PANITUMUMAB | ||
| 685 | BTC | DRUGGABLE GENOME, GROWTH FACTOR | cetuximab | CETUXIMAB |
| Page: 1 |

Copyright 2023-Present -The University of Texas Health Science Center at Houston |