| Tissue | Expression Dynamics | Abbreviation |
| Cervix | 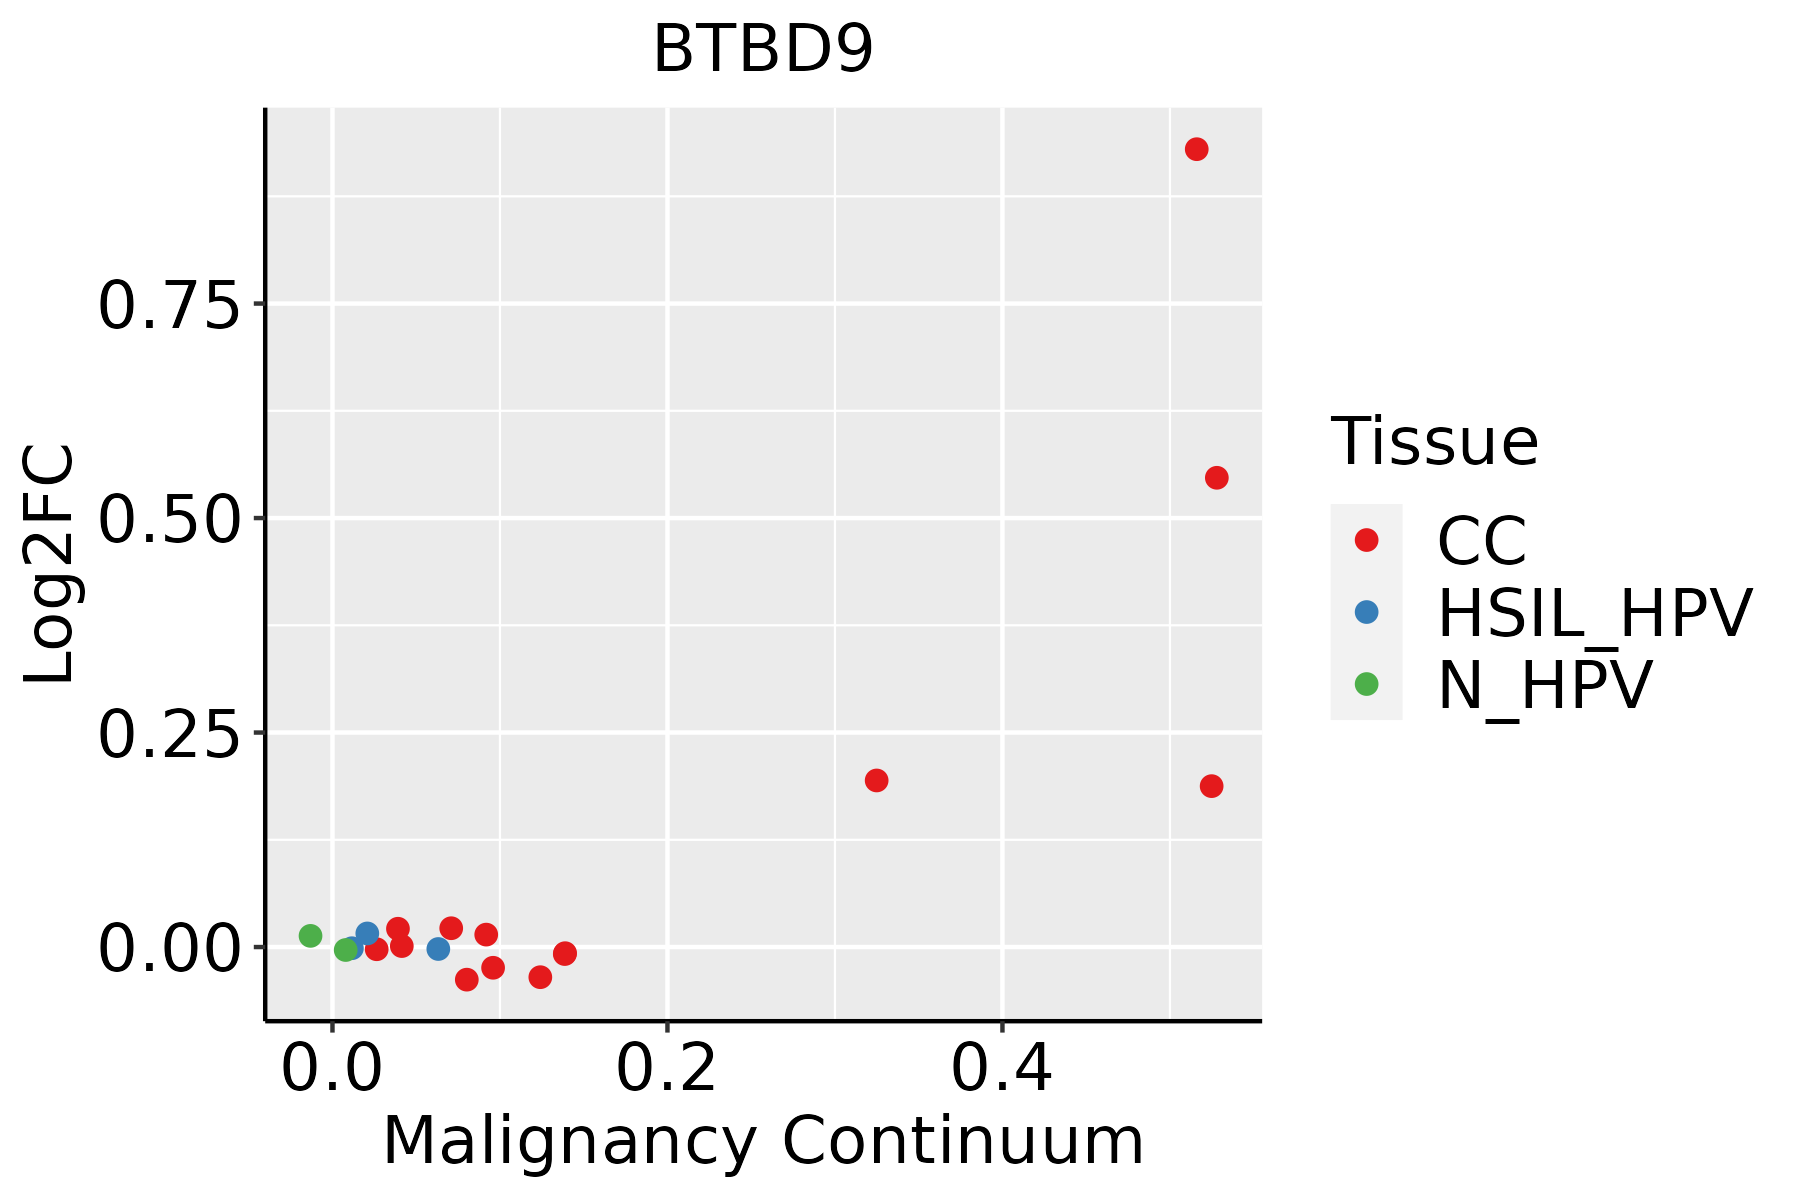 | CC: Cervix cancer |
| HSIL_HPV: HPV-infected high-grade squamous intraepithelial lesions |
| N_HPV: HPV-infected normal cervix |
| Colorectum (GSE201348) |  | FAP: Familial adenomatous polyposis |
| CRC: Colorectal cancer |
| Colorectum (HTA11) |  | AD: Adenomas |
| SER: Sessile serrated lesions |
| MSI-H: Microsatellite-high colorectal cancer |
| MSS: Microsatellite stable colorectal cancer |
| Endometrium | 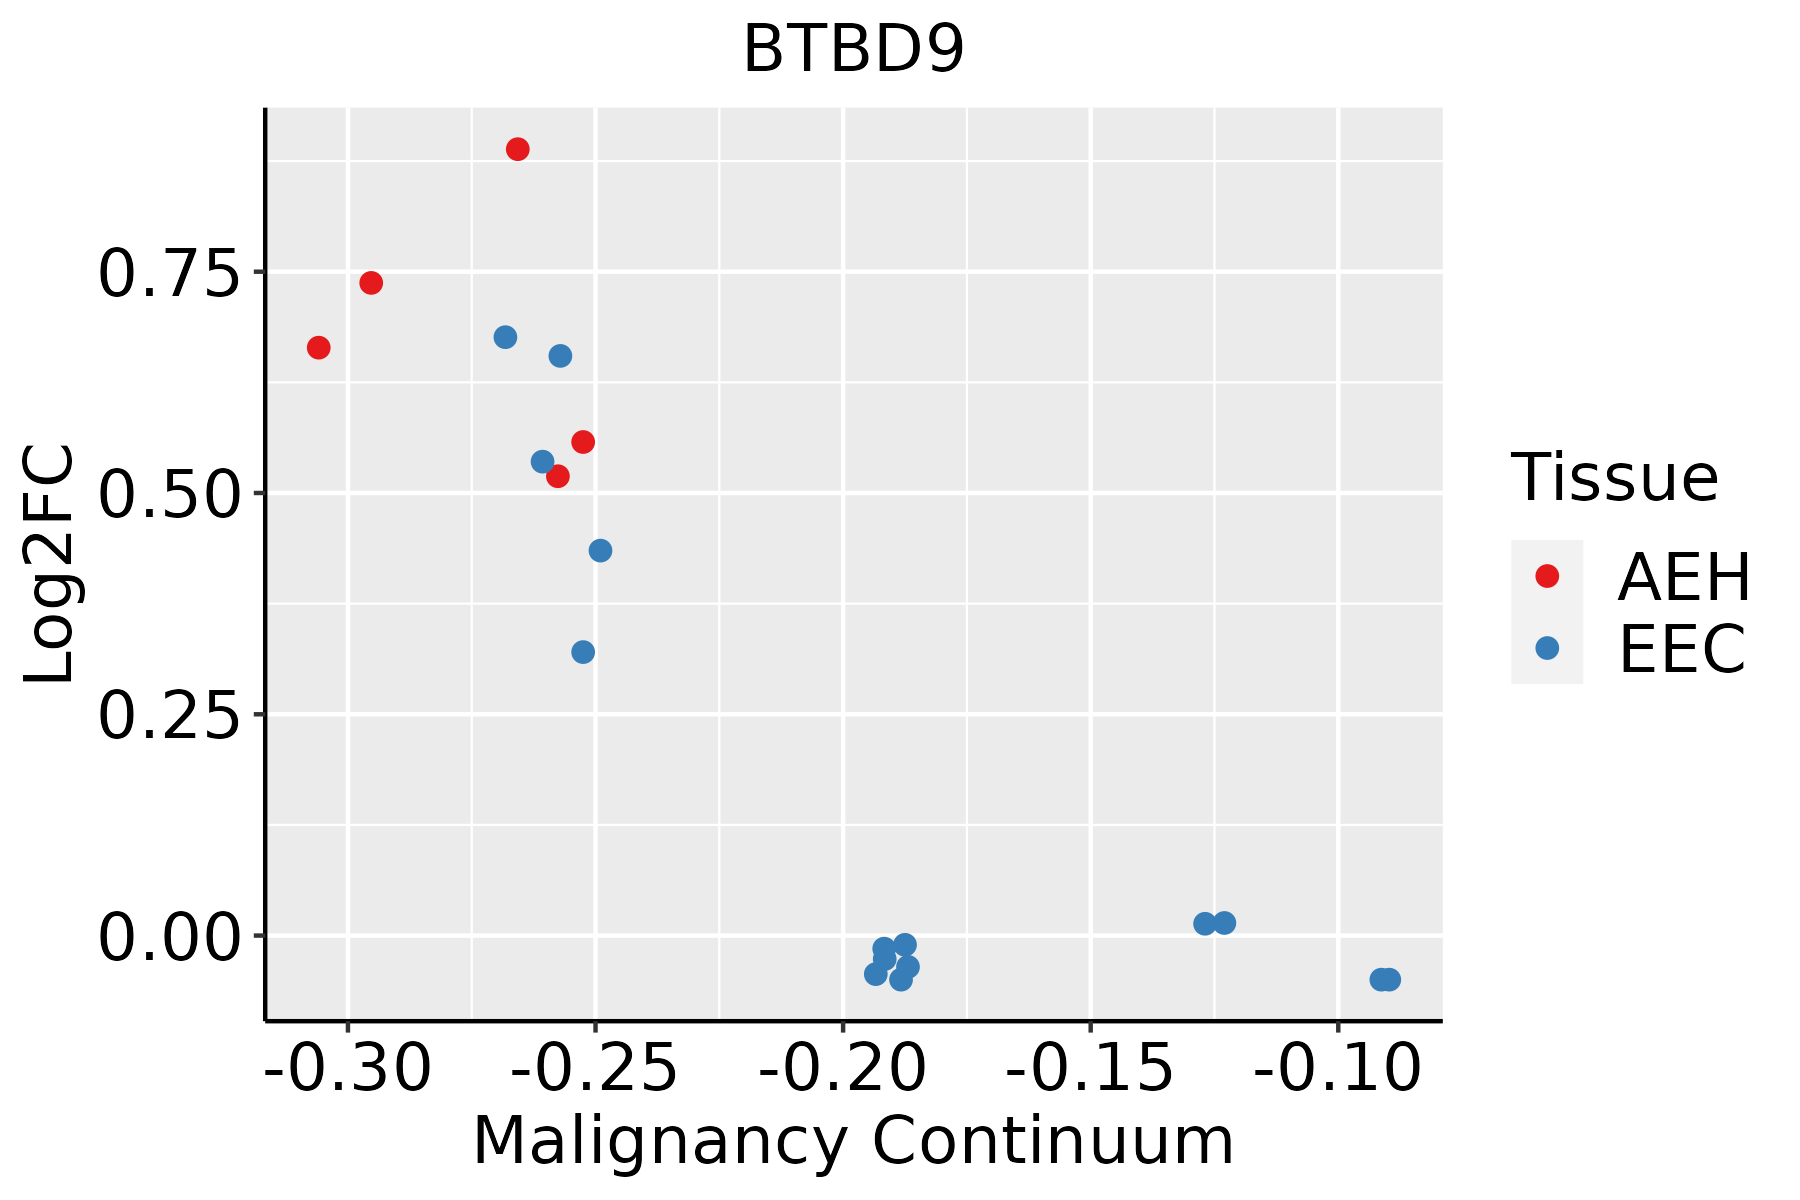 | AEH: Atypical endometrial hyperplasia |
| EEC: Endometrioid Cancer |
| GC | 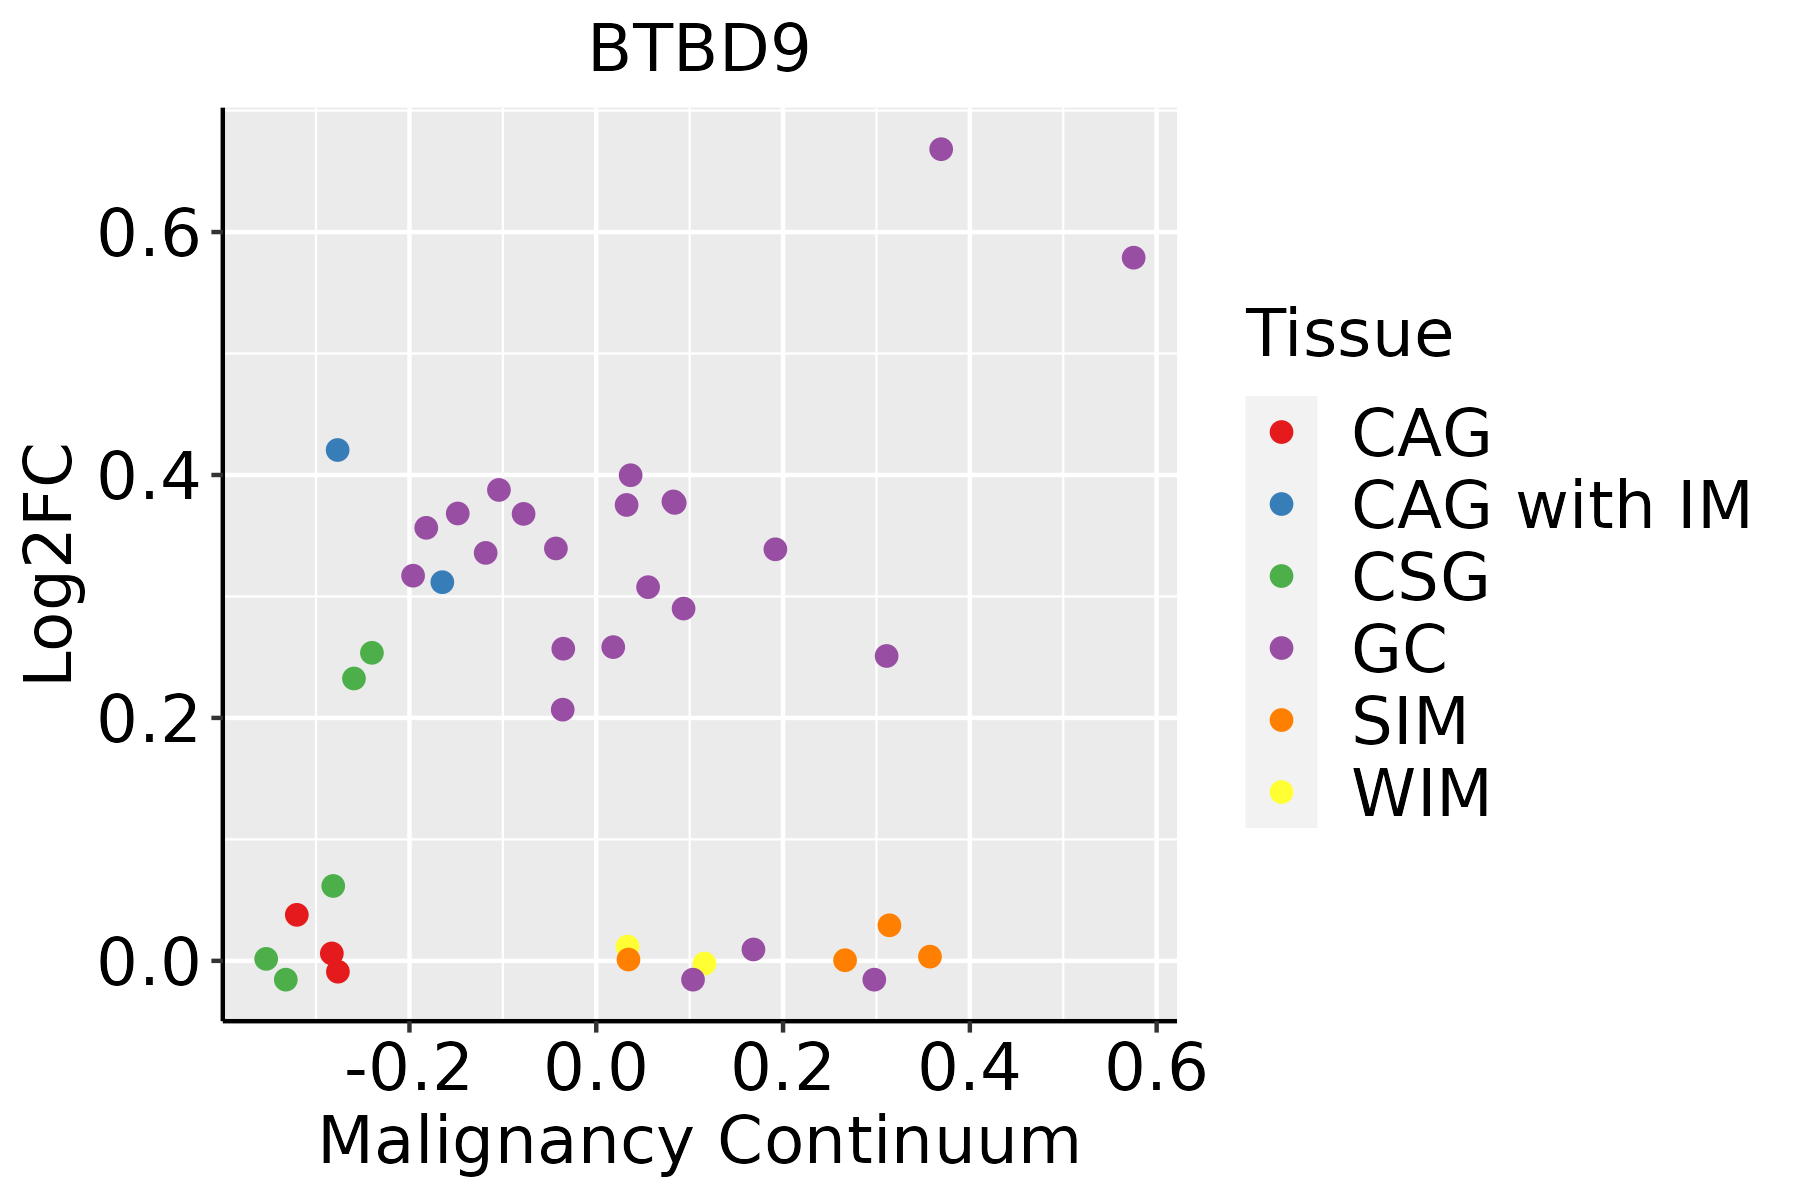 | CAG: Chronic atrophic gastritis |
| CAG with IM: Chronic atrophic gastritis with intestinal metaplasia |
| CSG: Chronic superficial gastritis |
| GC: Gastric cancer |
| SIM: Severe intestinal metaplasia |
| WIM: Wild intestinal metaplasia |
| Lung | 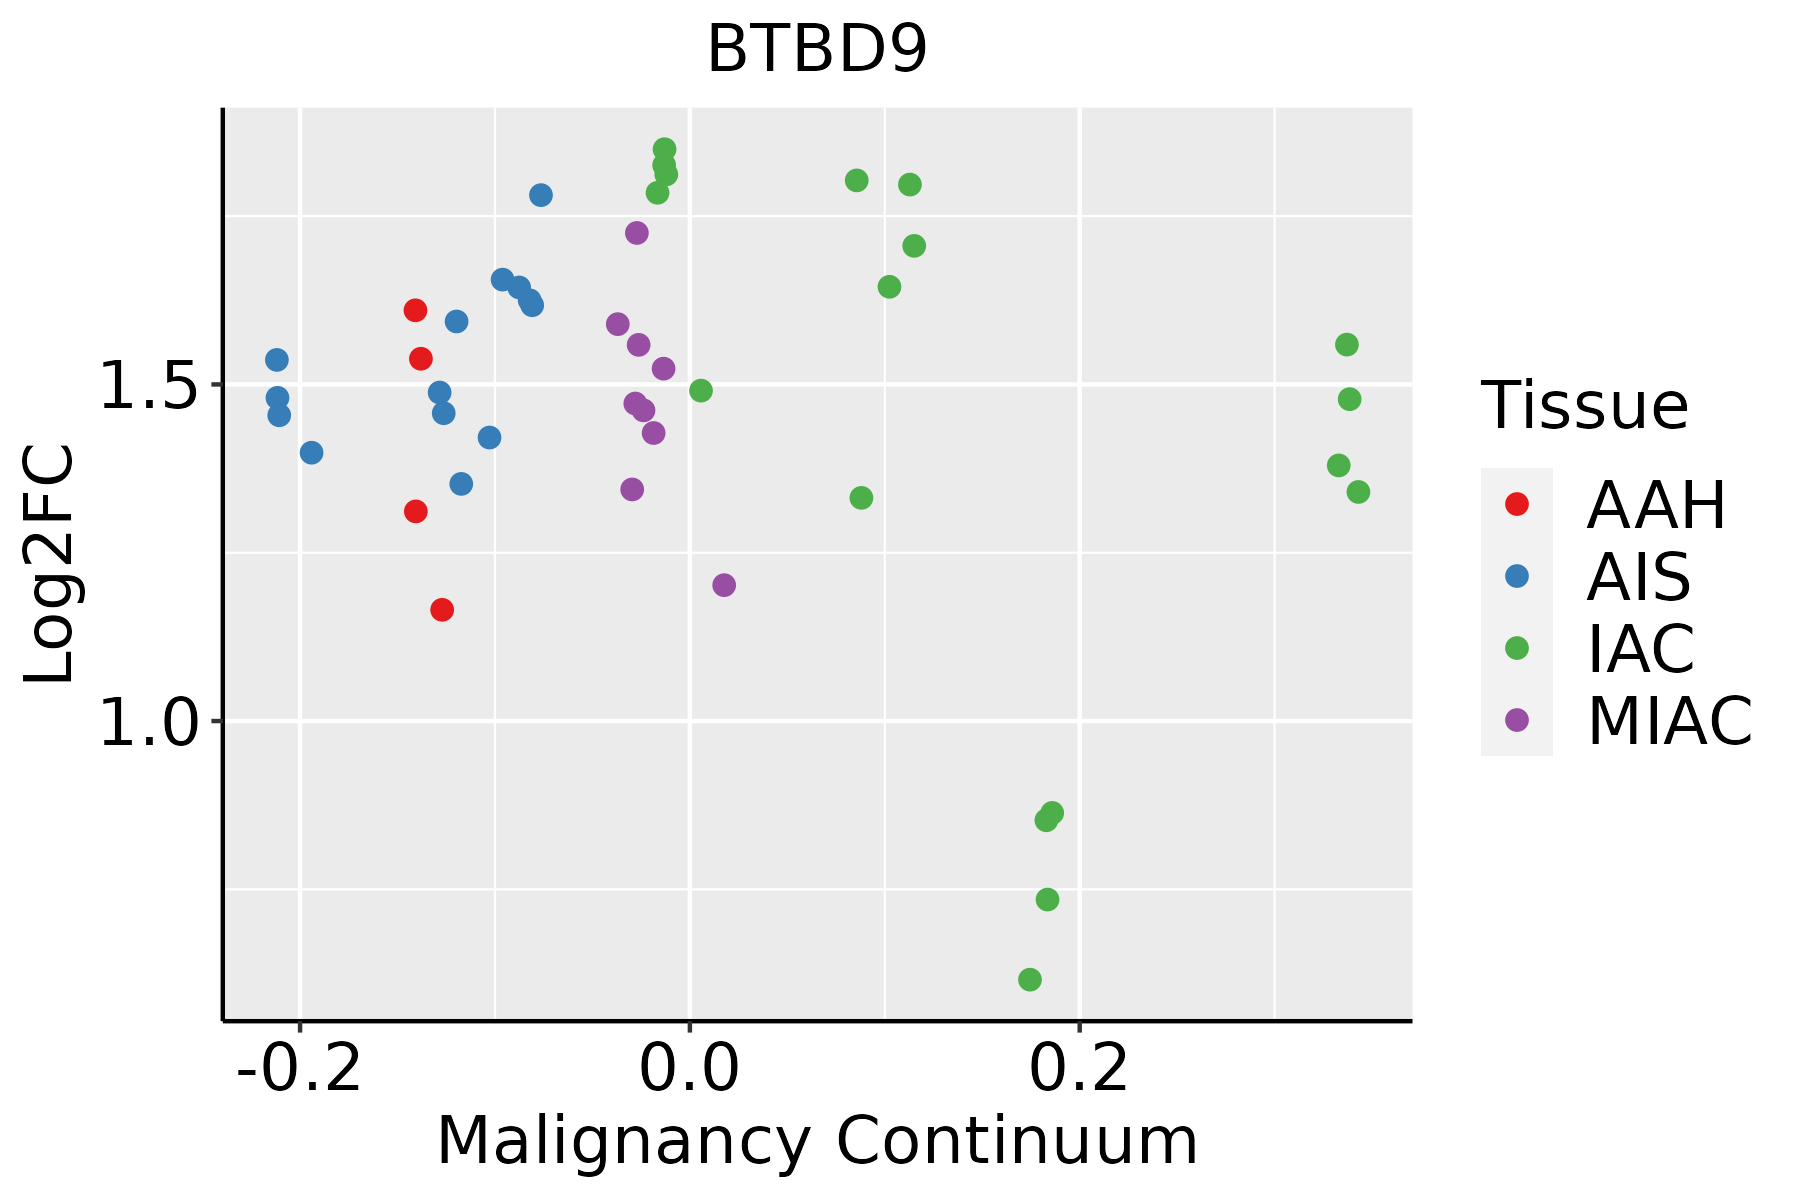 | AAH: Atypical adenomatous hyperplasia |
| AIS: Adenocarcinoma in situ |
| IAC: Invasive lung adenocarcinoma |
| MIA: Minimally invasive adenocarcinoma |
| Oral Cavity | 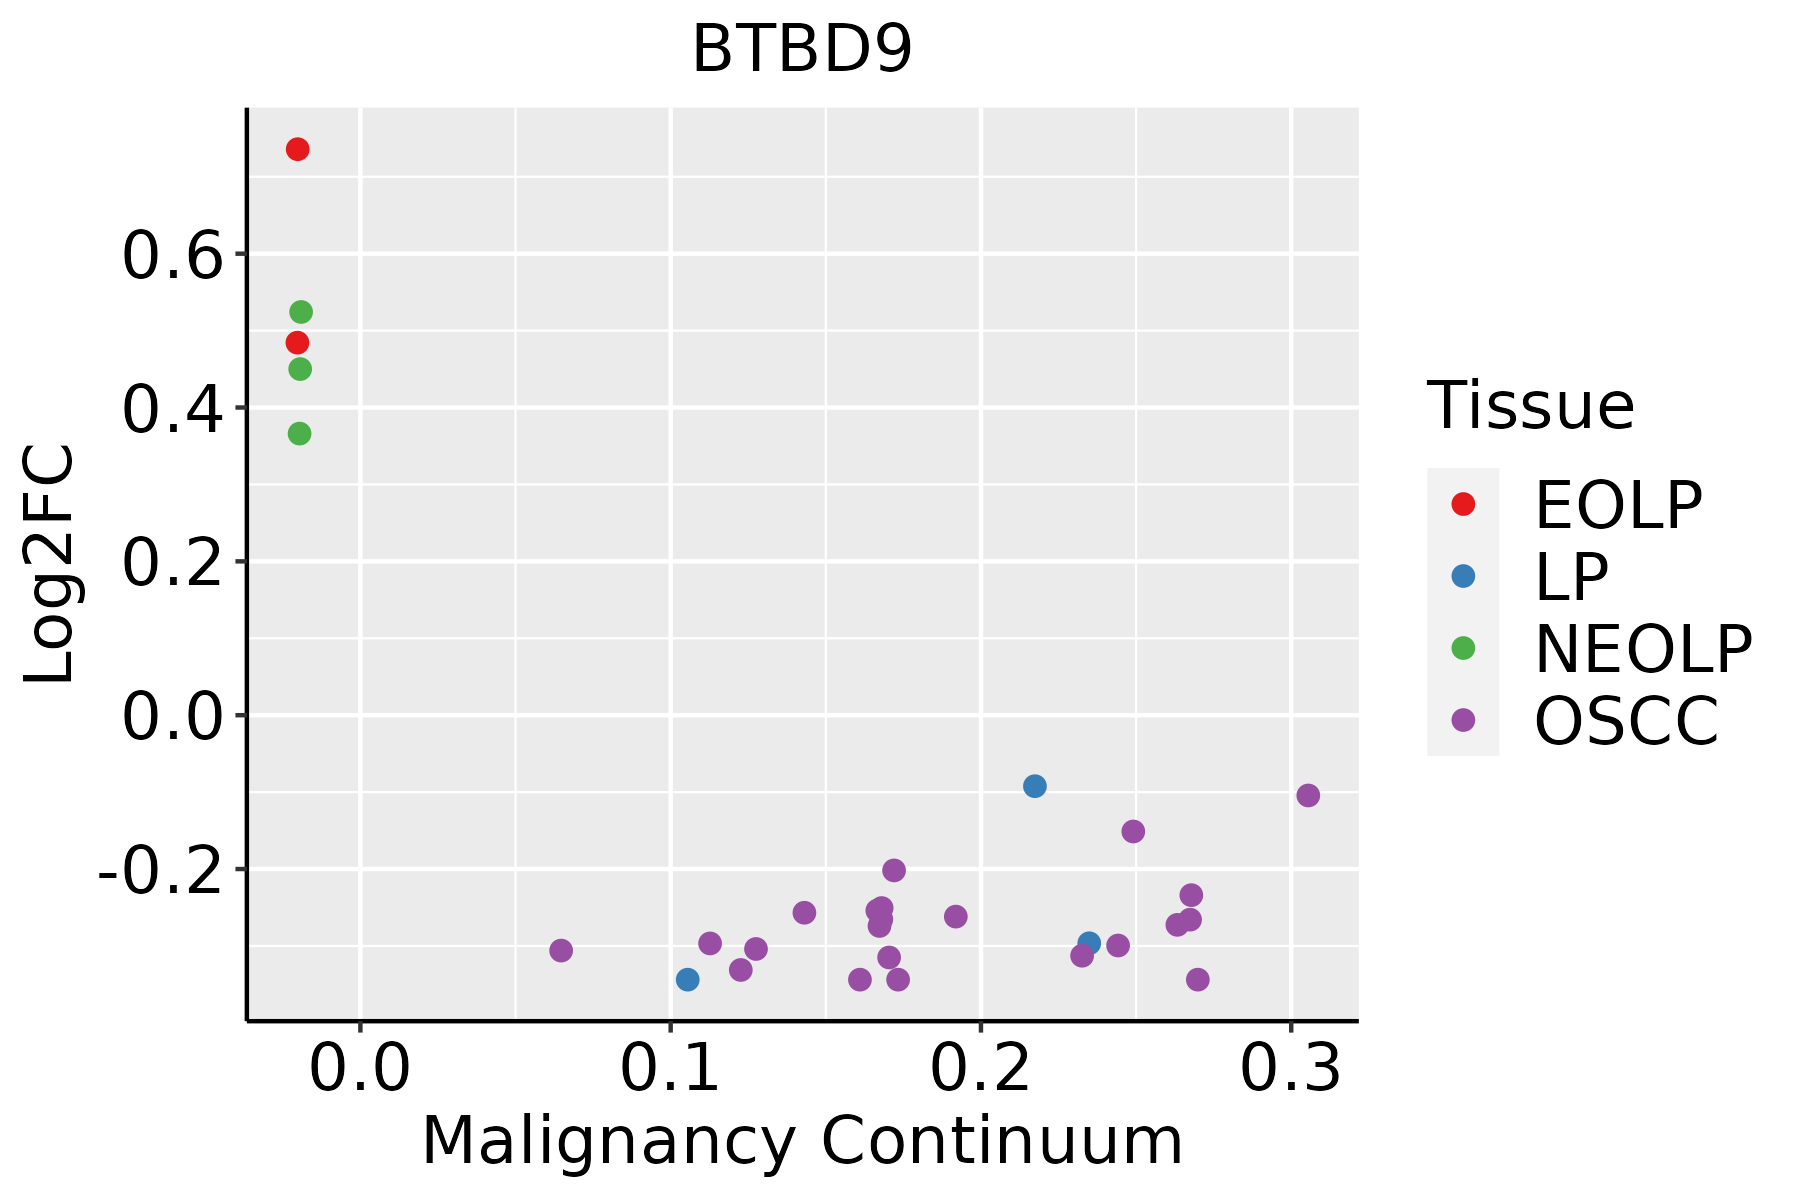 | EOLP: Erosive Oral lichen planus |
| LP: leukoplakia |
| NEOLP: Non-erosive oral lichen planus |
| OSCC: Oral squamous cell carcinoma |
| Prostate | 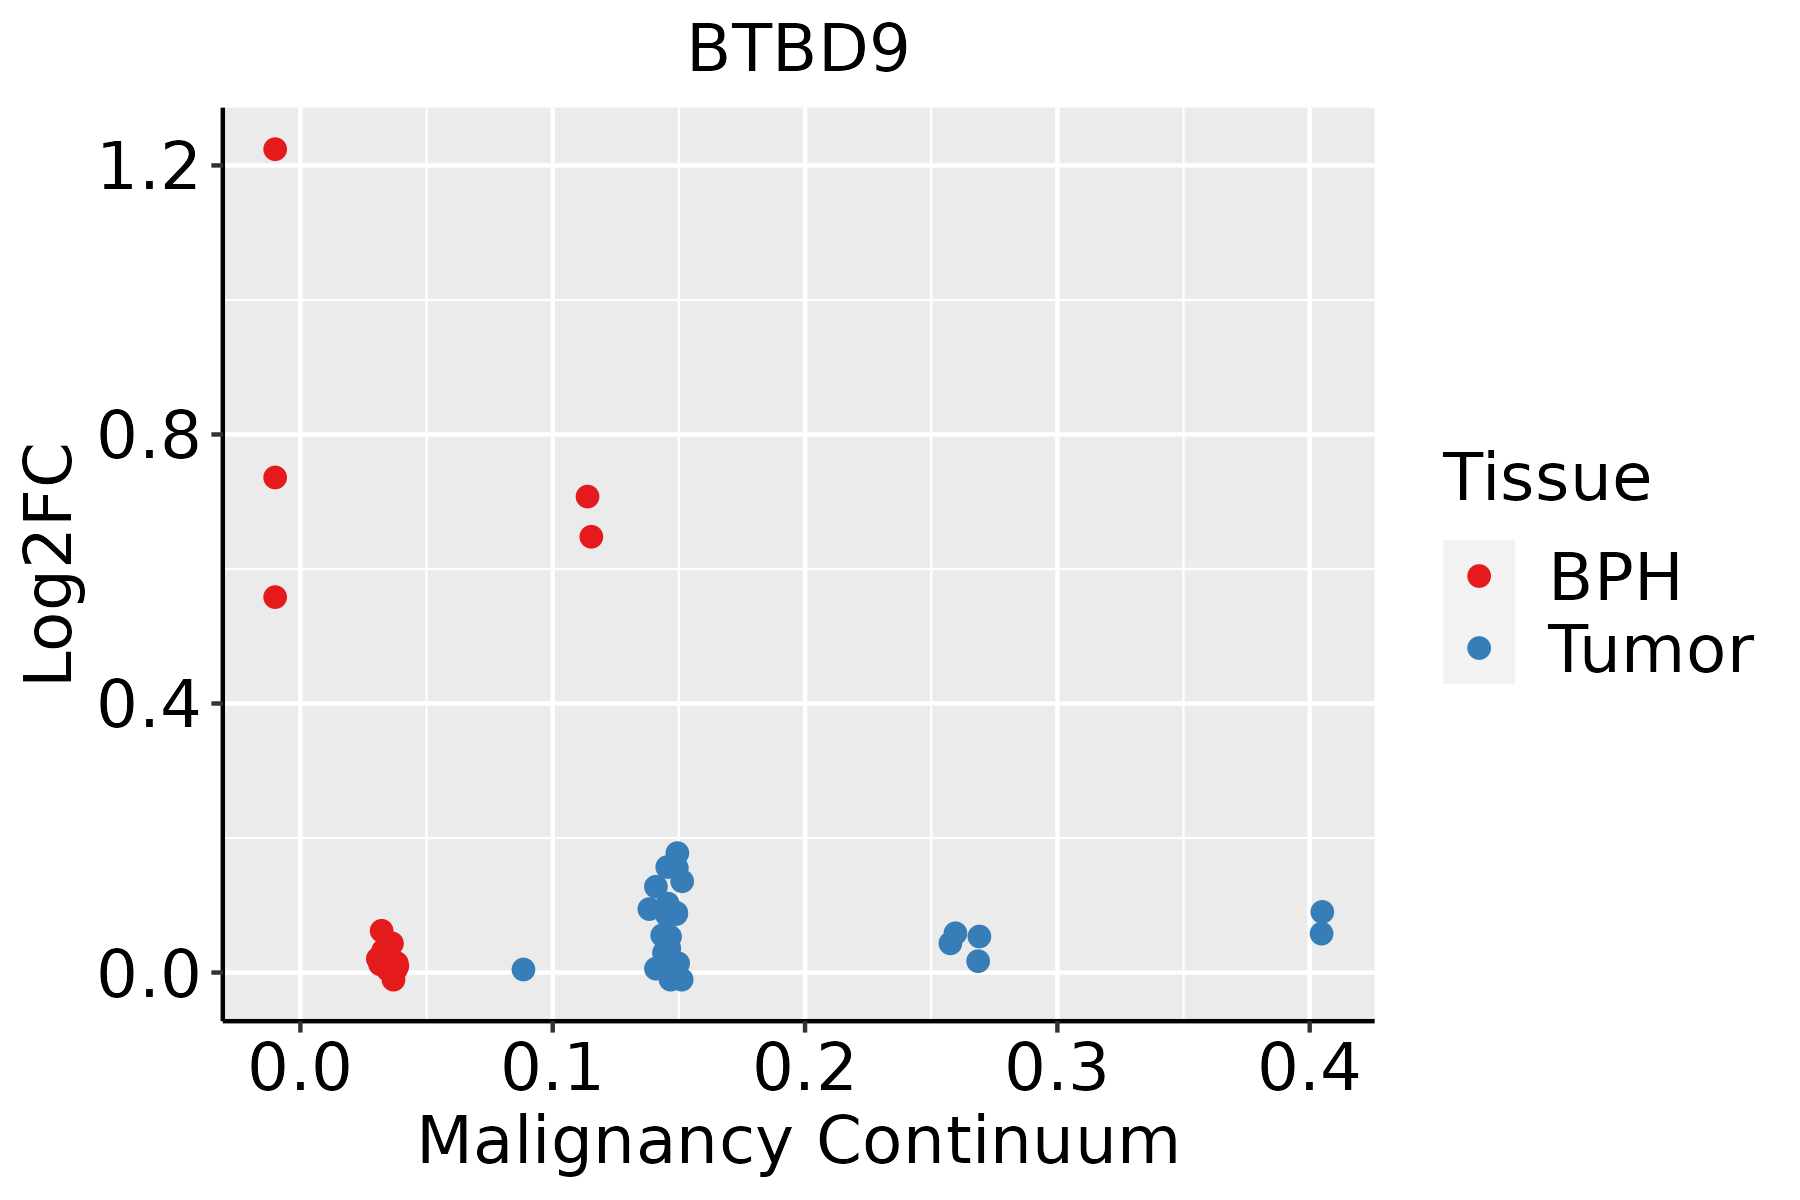 | BPH: Benign Prostatic Hyperplasia |
| GO ID | Tissue | Disease Stage | Description | Gene Ratio | Bg Ratio | pvalue | p.adjust | Count |
| GO:00485118 | Cervix | CC | rhythmic process | 65/2311 | 298/18723 | 2.79e-06 | 8.04e-05 | 65 |
| GO:00301008 | Cervix | CC | regulation of endocytosis | 47/2311 | 211/18723 | 3.65e-05 | 5.82e-04 | 47 |
| GO:00076238 | Cervix | CC | circadian rhythm | 46/2311 | 210/18723 | 6.76e-05 | 9.60e-04 | 46 |
| GO:00484883 | Cervix | CC | synaptic vesicle endocytosis | 16/2311 | 62/18723 | 2.87e-03 | 1.91e-02 | 16 |
| GO:01402383 | Cervix | CC | presynaptic endocytosis | 16/2311 | 62/18723 | 2.87e-03 | 1.91e-02 | 16 |
| GO:00550726 | Cervix | CC | iron ion homeostasis | 19/2311 | 85/18723 | 6.88e-03 | 3.74e-02 | 19 |
| GO:00364655 | Cervix | CC | synaptic vesicle recycling | 17/2311 | 75/18723 | 8.87e-03 | 4.53e-02 | 17 |
| GO:00550768 | Cervix | CC | transition metal ion homeostasis | 27/2311 | 138/18723 | 9.89e-03 | 4.85e-02 | 27 |
| GO:0055076 | Colorectum | AD | transition metal ion homeostasis | 53/3918 | 138/18723 | 1.89e-06 | 5.65e-05 | 53 |
| GO:0007623 | Colorectum | AD | circadian rhythm | 72/3918 | 210/18723 | 4.50e-06 | 1.21e-04 | 72 |
| GO:0048511 | Colorectum | AD | rhythmic process | 94/3918 | 298/18723 | 1.00e-05 | 2.34e-04 | 94 |
| GO:0030100 | Colorectum | AD | regulation of endocytosis | 67/3918 | 211/18723 | 1.42e-04 | 2.01e-03 | 67 |
| GO:0055072 | Colorectum | AD | iron ion homeostasis | 32/3918 | 85/18723 | 2.97e-04 | 3.60e-03 | 32 |
| GO:0099003 | Colorectum | AD | vesicle-mediated transport in synapse | 57/3918 | 200/18723 | 6.53e-03 | 4.06e-02 | 57 |
| GO:00550761 | Colorectum | SER | transition metal ion homeostasis | 41/2897 | 138/18723 | 1.66e-05 | 5.05e-04 | 41 |
| GO:00076231 | Colorectum | SER | circadian rhythm | 54/2897 | 210/18723 | 7.98e-05 | 1.77e-03 | 54 |
| GO:00550721 | Colorectum | SER | iron ion homeostasis | 24/2897 | 85/18723 | 1.91e-03 | 1.93e-02 | 24 |
| GO:00485111 | Colorectum | SER | rhythmic process | 65/2897 | 298/18723 | 2.18e-03 | 2.11e-02 | 65 |
| GO:00301001 | Colorectum | SER | regulation of endocytosis | 48/2897 | 211/18723 | 3.29e-03 | 2.82e-02 | 48 |
| GO:00076232 | Colorectum | MSS | circadian rhythm | 69/3467 | 210/18723 | 4.22e-07 | 1.67e-05 | 69 |
| Hugo Symbol | Variant Class | Variant Classification | dbSNP RS | HGVSc | HGVSp | HGVSp Short | SWISSPROT | BIOTYPE | SIFT | PolyPhen | Tumor Sample Barcode | Tissue | Histology | Sex | Age | Stage | Therapy Types | Drugs | Outcome |
| BTBD9 | SNV | Missense_Mutation | | c.1824N>A | p.Asn608Lys | p.N608K | Q96Q07 | protein_coding | tolerated_low_confidence(1) | benign(0) | TCGA-A1-A0SO-01 | Breast | breast invasive carcinoma | Female | >=65 | I/II | Chemotherapy | | SD |
| BTBD9 | SNV | Missense_Mutation | | c.959N>T | p.Ser320Phe | p.S320F | Q96Q07 | protein_coding | deleterious(0.02) | possibly_damaging(0.796) | TCGA-A8-A06Q-01 | Breast | breast invasive carcinoma | Female | <65 | III/IV | Unknown | Unknown | SD |
| BTBD9 | insertion | Frame_Shift_Ins | novel | c.621_622insTACAACAATATTCAAGGGAGTACATGTTATAGAACTTCAG | p.Asn208TyrfsTer17 | p.N208Yfs*17 | Q96Q07 | protein_coding | | | TCGA-A8-A08X-01 | Breast | breast invasive carcinoma | Female | <65 | III/IV | Chemotherapy | doxorubicin | PD |
| BTBD9 | SNV | Missense_Mutation | novel | c.320A>T | p.Glu107Val | p.E107V | Q96Q07 | protein_coding | deleterious(0) | probably_damaging(0.995) | TCGA-2W-A8YY-01 | Cervix | cervical & endocervical cancer | Female | <65 | I/II | Chemotherapy | cisplatin | CR |
| BTBD9 | SNV | Missense_Mutation | | c.1738G>A | p.Gly580Ser | p.G580S | Q96Q07 | protein_coding | tolerated_low_confidence(1) | benign(0.007) | TCGA-EA-A410-01 | Cervix | cervical & endocervical cancer | Female | <65 | I/II | Unknown | Unknown | SD |
| BTBD9 | SNV | Missense_Mutation | | c.959N>T | p.Ser320Phe | p.S320F | Q96Q07 | protein_coding | deleterious(0.02) | possibly_damaging(0.796) | TCGA-JW-A5VJ-01 | Cervix | cervical & endocervical cancer | Female | <65 | I/II | Unknown | Unknown | PD |
| BTBD9 | SNV | Missense_Mutation | | c.982C>G | p.Gln328Glu | p.Q328E | Q96Q07 | protein_coding | tolerated(0.72) | benign(0.085) | TCGA-Q1-A73O-01 | Cervix | cervical & endocervical cancer | Female | <65 | I/II | Chemotherapy | cisplatin | CR |
| BTBD9 | SNV | Missense_Mutation | | c.132N>T | p.Lys44Asn | p.K44N | Q96Q07 | protein_coding | tolerated(0.37) | benign(0.239) | TCGA-AA-3510-01 | Colorectum | colon adenocarcinoma | Male | >=65 | I/II | Unknown | Unknown | SD |
| BTBD9 | SNV | Missense_Mutation | | c.1007N>A | p.Arg336Gln | p.R336Q | Q96Q07 | protein_coding | deleterious(0.03) | probably_damaging(0.992) | TCGA-AA-3815-01 | Colorectum | colon adenocarcinoma | Female | >=65 | I/II | Unknown | Unknown | SD |
| BTBD9 | SNV | Missense_Mutation | | c.1301N>T | p.Ala434Val | p.A434V | Q96Q07 | protein_coding | deleterious(0) | probably_damaging(0.994) | TCGA-AA-3966-01 | Colorectum | colon adenocarcinoma | Female | >=65 | I/II | Unknown | Unknown | SD |


